
Market Overview
| Study Period | 2021 - 2031 |
|---|---|
| Forecast Data Period | 2026 - 2031 |
| Base Year Market Size (2025) | USD 116.32 Billion |
| Market Size (2026) | USD 125.41 Billion |
| Market Size (2031) | USD 182.65 Billion |
| Growth Rate (2026 - 2031) | 7.81 % |
| Market Concentration | Low |
Major Players *Disclaimer: Major Players sorted in no particular order Image © Mordor Intelligence. Reuse requires attribution under CC BY 4.0. | |
Asia-Pacific Nutraceutical Market Analysis by Mordor Intelligence
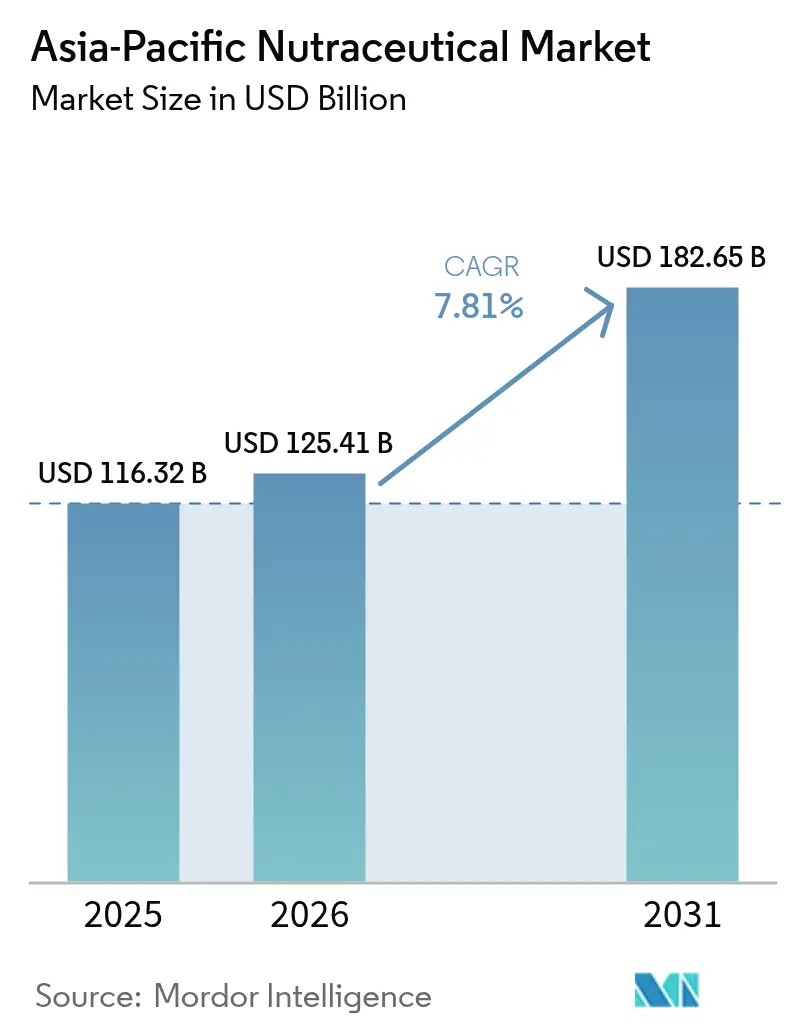
The Asia-Pacific nutraceutical market size is expected to grow from USD 116.32 billion in 2025 to USD 125.41 billion in 2026 and is forecast to reach USD 182.65 billion by 2031 at 7.81% CAGR over 2026-2031. This market expansion is underpinned by consumers' increasing focus on preventive healthcare solutions, significant improvements in regulatory frameworks across major economies, and the widespread adoption of digital retail platforms. While functional foods continue to be the primary driver of market spending, both functional beverages and personalized dietary supplements are experiencing substantial growth as consumers increasingly prefer convenient product formats that address specific health conditions. The rapid adoption of e-commerce platforms, especially in large markets like China and India, has fundamentally transformed the traditional purchasing journey, creating opportunities for direct-to-consumer business models while intensifying market competition. Furthermore, the ongoing regulatory harmonization efforts within ASEAN countries, coupled with stricter enforcement measures in China, are establishing higher quality benchmarks and building consumer trust, although this has resulted in increased compliance-related costs for smaller market participants. In response to market challenges, companies are actively pursuing supply chain diversification strategies and investing in local manufacturing capabilities to effectively manage raw material price volatility and minimize logistics-related risks.
Key Report Takeaways
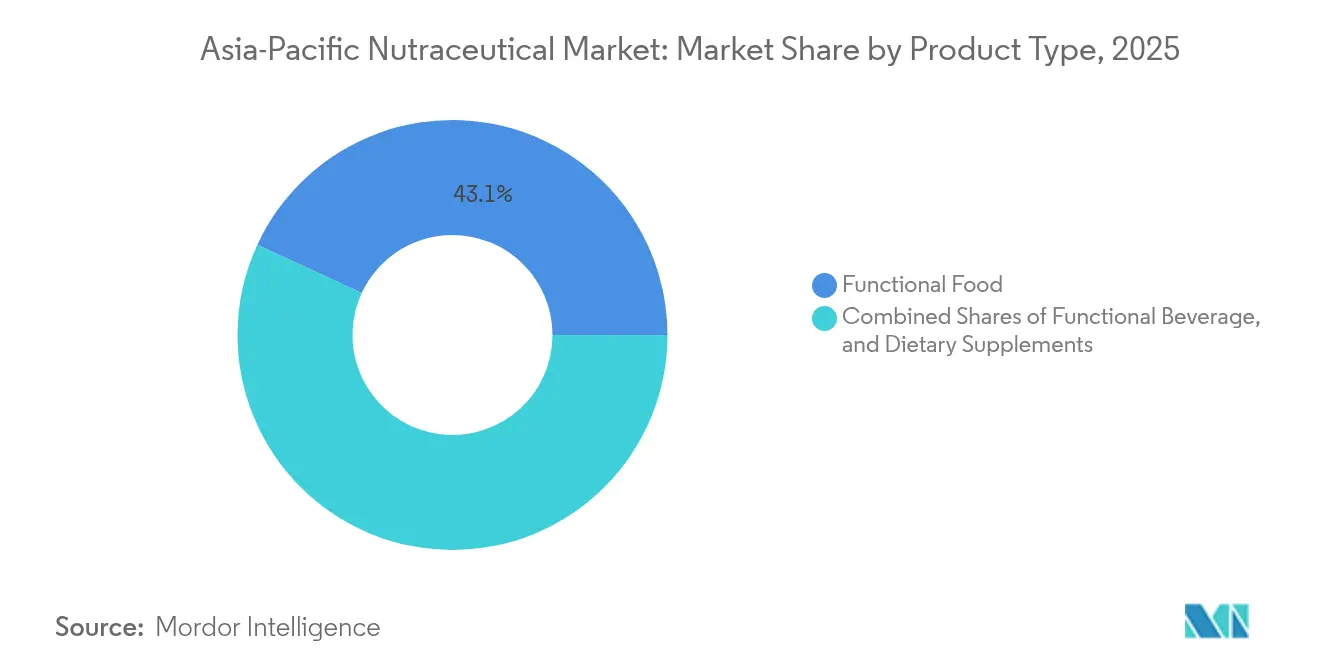
- By product type, functional foods accounted for 43.10% of the Asia-Pacific nutraceutical market share in 2025, while functional beverages are projected to compound at a 8.74% CAGR between 2026-2031.
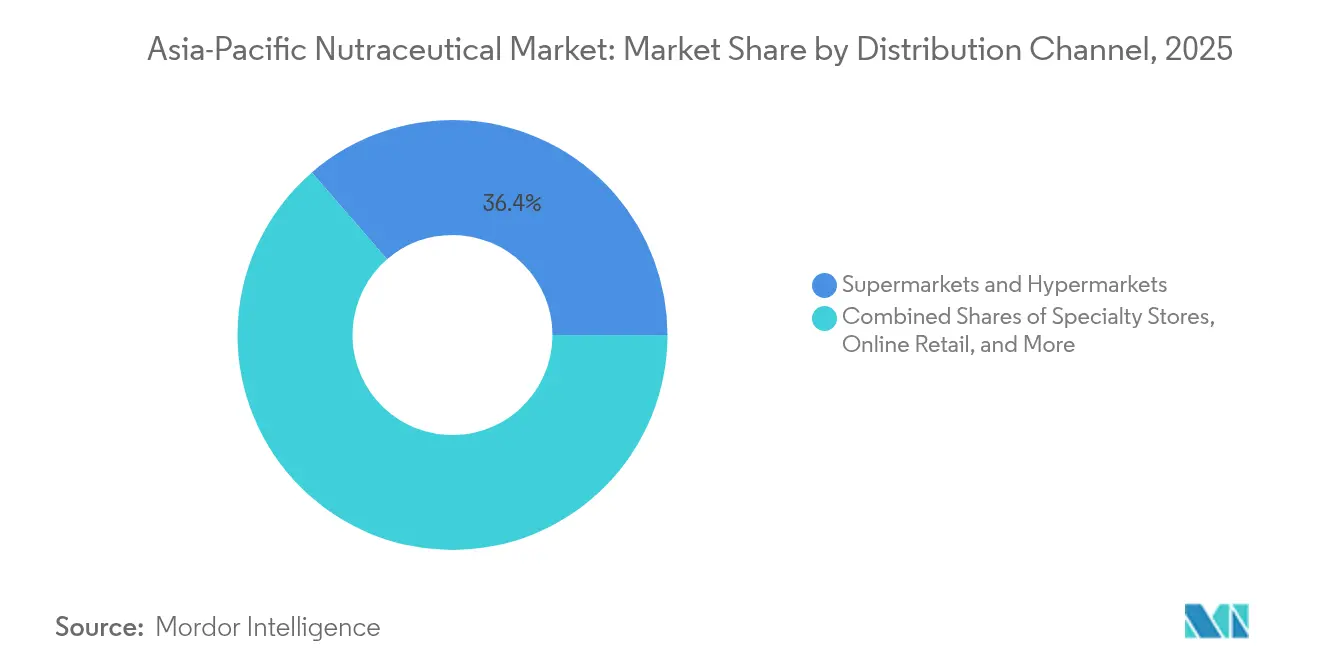
- By distribution channel, supermarkets and hypermarkets captured 36.35% of the Asia-Pacific nutraceutical market size in 2025 and online retail is forecast to rise at an 8.59% CAGR through 2031.
- By geography, China led with 37.55% revenue share in 2025, whereas India is set to post the fastest 8.31% CAGR to 2031.
Note: Market size and forecast figures in this report are generated using Mordor Intelligence’s proprietary estimation framework, updated with the latest available data and insights as of 2026.
Asia-Pacific Nutraceutical Market Trends and Insights
Drivers Impact Analysis*
| Driver | (~) % Impact on CAGR Forecast | Geographic Relevance | Impact Timeline |
|---|---|---|---|
| Rising health consciousness and awareness about preventive care | +2.1% | Global, with early gains in Singapore, Hong Kong, Japan | Medium term (2-4 years) |
| Increasing prevalence of lifestyle-related diseases | +1.8% | APAC core, spill-over to emerging markets | Long term (≥ 4 years) |
| Growing popularity of plant-based and vegan products | +1.2% | Urban centers across China, India, Australia | Short term (≤ 2 years) |
| Ageing population seeking functional products | +1.5% | Japan, South Korea, Singapore, Australia | Long term (≥ 4 years) |
| Increased consumer interest in functional beverages | +0.9% | China, India, Southeast Asia | Medium term (2-4 years) |
| Enhanced distribution channels, including e-commerce | +0.5% | Global, with concentration in China, India | Short term (≤ 2 years) |
| Source: Mordor Intelligence | |||
Rising Health Consciousness and Awareness About Preventive Care
Consumer behavior in Asia-Pacific has experienced a notable transformation toward proactive health management, with a significant portion of ASEAN populations incorporating nutraceuticals into their daily routines. This evolution extends beyond traditional wellness approaches, embracing personalized nutrition solutions that target individual biomarkers and genetic characteristics. Singaporean consumers have become increasingly mindful of ingredient origins and nutritional profiles, while Japanese consumers demonstrate a sophisticated understanding of functional food science, actively seeking products backed by clinical evidence [1]Source: New Zealand Trade & Enterprise, “Selling Food and Beverage into Singapore’s Grocery Retail Market,” nzte.govt.nz. The market continues to evolve as digital health platforms integrate seamlessly with nutraceutical consumption patterns, facilitating continuous health monitoring and personalized supplementation recommendations. Japan's Foods for Specified Health Uses (FOSHU) regulatory framework instills consumer confidence through comprehensive pre-market evaluation processes, enabling premium pricing strategies for products with scientific validation.
Increasing Prevalence of Lifestyle-Related Diseases
The increasing shift toward urban lifestyles and Western dietary patterns across emerging Asia-Pacific markets has triggered widespread health challenges, particularly diabetes, cardiovascular disease, and metabolic disorders. India's nutraceutical market has experienced substantial expansion, demonstrating remarkable growth, directly reflecting the rising prevalence of non-communicable diseases. In China, health-conscious middle-class consumers are increasingly seeking sophisticated supplement solutions, particularly gravitating toward products addressing blood sugar management and cardiovascular health, resulting in significant market growth. The mounting health challenges create sustained demand for targeted nutritional interventions, specifically omega-3 fatty acids, plant sterols, and blood glucose management formulations. As healthcare systems in developing markets face mounting pressure from increased patient loads, nutraceuticals emerge as cost-effective preventive alternatives, receiving additional support through government initiatives that promote functional food consumption and the integration of traditional medicine practices.
Growing Popularity of Plant-Based and Vegan Products
Plant-based nutraceutical adoption accelerates across urban APAC centers, driven by environmental consciousness and perceived health benefits. The trend transcends dietary preferences, encompassing protein powders, plant-derived omega-3 alternatives, and botanical extracts with traditional medicine heritage. Consumer acceptance of algae-based supplements and fermented plant proteins indicates sophisticated market evolution beyond basic vegetarian alternatives. Regulatory support varies significantly, with Australia's Therapeutic Goods Administration providing clear pathways for plant-based therapeutic goods, while China's traditional medicine integration offers unique positioning opportunities for botanical nutraceuticalsManufacturing innovations in plant protein isolation and bioavailability enhancement support premium product development and market differentiation strategies.
Ageing Population Seeking Functional Products
The Asia-Pacific region is experiencing significant demographic changes, creating market opportunities for age-specific nutritional products. Japan's large elderly population serves as a key market for testing cognitive health and mobility support products before regional expansion. The pre-elderly segment offers strong market potential due to their high purchasing power and health-conscious behavior. In South Korea, consumers show high acceptance of premium functional foods for memory enhancement and energy maintenance. Korea Ginseng Corporation has successfully implemented premium pricing by modernizing traditional ingredients. China's growing aging middle class presents significant opportunities, though market success requires incorporating traditional Chinese medicine principles alongside modern supplement formats. This demographic shift extends to emerging economies where aging populations coincide with increasing wealth, creating opportunities for companies that develop products aligned with cultural preferences and meet both clinical and regulatory requirements. According to the United Nations Population Fund (UNFPA), by 2050, 25% of Asia-Pacific's population will be over 60 years old. The region's elderly population (aged over 60) will increase threefold between 2010 and 2050, reaching approximately 1.3 billion people [2]Source: UNFPA, “Ageing,” unfpa.org.
Restraints Impact Analysis*
| Restraint | (~) % Impact on CAGR Forecast | Geographic Relevance | Impact Timeline |
|---|---|---|---|
| Allergens and dietary restrictions limiting scope | -0.8% | Global, with concentration in developed markets | Medium term (2-4 years) |
| Prevalence of counterfeit and substandard products | -1.2% | China, India, Southeast Asia | Short term (≤ 2 years) |
| Supply chain disruptions impacting raw material quality | -0.9% | Global, with manufacturing hubs affected | Medium term (2-4 years) |
| High research and development costs for innovation and compliance | -0.6% | Japan, Australia, Singapore | Long term (≥ 4 years) |
| Source: Mordor Intelligence | |||
Allergens and Dietary Restrictions Limiting Scope
The complex landscape of dietary requirements across Asia-Pacific markets presents manufacturers with intricate formulation challenges. In Muslim-majority Southeast Asian countries, obtaining halal certification involves rigorous compliance processes, while manufacturers must simultaneously accommodate Hindu dietary practices in India and Buddhist preferences in other regional markets. These requirements fundamentally impact ingredient selection and manufacturing methodologies. The operation of shared production facilities introduces substantial cross-contamination risks, while varying allergen labeling regulations across different jurisdictions create additional compliance burdens. The growing incidence of food allergies in developed Asia-Pacific markets requires manufacturers to implement extensive testing protocols and maintain strictly separated supply chains. While ISO 22000 and HACCP standards offer structured operational frameworks, they introduce additional layers of complexity and financial considerations, particularly impacting smaller manufacturers attempting to establish a presence across multiple regional markets.
Prevalence of Counterfeit and Substandard Products
Regulatory enforcement actions across the Asia-Pacific region continue to expose significant quality control challenges that directly impact consumer confidence and sustainable market growth. Vietnam's comprehensive enforcement campaign against unregistered health supplements demonstrates the widespread presence of counterfeit products in the market. Similarly, China has implemented more stringent cross-border e-commerce regulations to combat the influx of substandard imports, while India's Food Safety and Standards Authority has strengthened its oversight of unregulated health drinks distributed through online platforms. The increasing presence of low-quality products not only creates significant price pressures on legitimate manufacturers but also necessitates substantial investments in brand protection measures and consumer education initiatives. Although blockchain-based traceability systems and sophisticated laboratory testing capabilities present viable solutions to these challenges, the substantial implementation costs create financial barriers for smaller market participants, potentially limiting their ability to compete effectively.
*Our forecasts treat driver/restraint impacts as directional, not additive. The impact forecasts reflect baseline growth, mix effects, and variable interactions.
Segment Analysis
By Product Type: Functional Foods Lead Despite Beverage Acceleration
Functional foods continue to dominate the APAC nutraceutical market, commanding a substantial 43.10% share in 2025. This dominance stems from widespread consumer acceptance across diverse Asian markets, where products like fortified cereals, probiotic dairy items, and nutrient-enhanced snacks have become dietary staples. The market's foundation remains strong through traditional functional food categories, with fortified rice maintaining its significance in Southeast Asian countries and fermented dairy products showing consistent demand in East Asian regions, providing established companies with reliable revenue streams.
The functional beverages segment emerges as the fastest-growing category, projecting a robust CAGR of 8.74% through 2031. This growth aligns with increasing urbanization trends and evolving consumer preferences for convenient, on-the-go consumption options. The segment's expansion is particularly notable in two distinct consumer groups: younger demographics gravitating toward energy drinks and sports beverages, and health-conscious consumers who prefer fortified juices and dairy alternatives. These beverages successfully combine nutritional enhancement with familiar product formats, meeting the dual consumer demands for health benefits and taste preferences.



By Distribution Channel: Digital Transformation Reshapes Traditional Retail
Supermarkets and hypermarkets continue to dominate the retail landscape, commanding a substantial 36.35% market share in 2025. These traditional retail formats have successfully maintained their market leadership position by leveraging deeply ingrained consumer shopping behaviors and offering an unmatched variety of products in a single location. The physical retail environment provides brands with valuable opportunities to engage directly with consumers through product education and sampling experiences. This face-to-face interaction remains particularly crucial for the successful launch of new functional food products, where consumer trial and acceptance significantly influence market performance.
The online retail segment demonstrates significant market transformation, advancing at an impressive 8.59% CAGR and fundamentally reshaping traditional distribution channels. This remarkable growth is primarily attributed to the widespread adoption of direct-to-consumer brand strategies and the increasing consumer preference for subscription-based delivery models. In the regulatory landscape, China's cross-border e-commerce framework presents international brands with distinct market entry opportunities while necessitating careful attention to compliance requirements. Simultaneously, India's sophisticated digital payment infrastructure acts as a powerful catalyst for market expansion, enabling retailers to effectively penetrate and serve previously untapped rural consumer segments. According to India Brand Equity Foundation, the country's e-commerce sector is positioned to achieve a notable ~12% year-on-year growth in FY2025, underlining the robust growth trajectory of digital retail channels .
Geography Analysis
The Asia-Pacific nutraceutical market demonstrates China's commanding presence, holding a substantial 37.55% market share in 2025. This dominance stems from the country's sophisticated manufacturing infrastructure and a notable shift in health consciousness among its expanding middle-class population. The Chinese government actively promotes the integration of traditional Chinese medicine with contemporary nutraceutical science, creating unique opportunities for product differentiation. The implementation of cross-border e-commerce regulations in 2024 has fundamentally altered how international brands approach market entry, introducing more stringent compliance requirements while simultaneously establishing clearer regulatory pathways for products that meet approval standards.
India has emerged as the region's growth powerhouse, projecting an impressive 8.31% CAGR through 2031. This remarkable growth trajectory is underpinned by the modernization of FSSAI regulations and significant improvements in digital distribution infrastructure. The country's rich heritage in Ayurvedic medicine provides a natural advantage, fostering widespread acceptance of botanical and herbal formulations among consumers. However, the industry faces a period of adjustment as regulatory discussions continue regarding the potential transfer of oversight responsibilities from FSSAI to the Central Drugs Standard Control Organisation (CDSCO), introducing an element of uncertainty in long-term industry planning and investment decisions.
Japan maintains its position as a sophisticated market characterized by innovation and stringent quality standards, with established regulatory frameworks such as FOSHU enabling companies to position premium products effectively. The country's demographic profile, particularly its aging population, generates sustained demand for functional foods targeting cognitive health, joint mobility, and cardiovascular support. Meanwhile, Australia and Southeast Asian markets demonstrate steady progression, benefiting from ongoing regulatory harmonization efforts through ASEAN frameworks. These initiatives effectively reduce trade barriers and enable companies to implement standardized product strategies across the region.
Regulatory Landscape
Regulation across Asia-Pacific nutraceuticals continues to tighten around claims, labeling, and post-market controls, while ASEAN harmonization efforts aim to reduce technical barriers for health supplements through common guidelines and reference documents coordinated via the ASEAN Secretariat. China remains a bellwether for claims governance, with the State Administration for Market Regulation (SAMR) adding the function claim "helps maintain bone and joint health" to the Directory of Health Functions effective January 1, 2026. This reinforces the value of approved claim directories in product positioning and registration or filing choices.
In Southeast Asia, regulators are raising compliance requirements that affect formulation and packaging decisions. Singapore's Health Sciences Authority (HSA) opened a public consultation from July 1 to July 29, 2026 on a proposed regulatory framework for Complementary Health Products under the Health Products Act. Malaysia's National Pharmaceutical Regulatory Agency (NPRA) issued 2026 updates covering analytical testing and labeling declarations for products containing animal-derived materials (April 2026), and additional warning statements for products containing Vitamin B6 due to peripheral neuropathy risks (June 2026). These changes increase documentation and label management demands for brands selling across multiple APAC markets.
Value Chain Analysis
The APAC nutraceutical value chain begins with raw materials and bioactives (vitamins and amino acids, botanicals, specialty strains and enzymes), then moves through extraction or fermentation and premix blending. Finished-dose manufacturing (tablets, capsules, powders) and functional food and beverage processing follow, along with quality testing, packaging, and multi-channel distribution. The region relies heavily on China for vitamin and amino-acid premix exports and on India for botanical extracts, while high-potency probiotic strains and specialty enzymes are still widely sourced from Europe and North America. That sourcing pattern increases exposure to lead times, import compliance requirements, and cold-chain needs for viability-sensitive products.
Key constraints sit at compliance and logistics nodes. Divergent national requirements across Asia can add significant time to launches, and limited GMP-certified blending capacity plus constrained testing laboratory throughput for contaminants (heavy metals and microbial) can slow scale-up in emerging hubs. Distribution has split between modern trade (supermarkets and hypermarkets) and fast-growing online retail, but fulfillment performance depends on warehousing and cold-chain networks. This friction is visible in India, where Dabur India and Himalaya Wellness executives flagged supply-chain strain in June 2026 as demand outpaced warehouse and cold-chain capacity.
Competitive Landscape
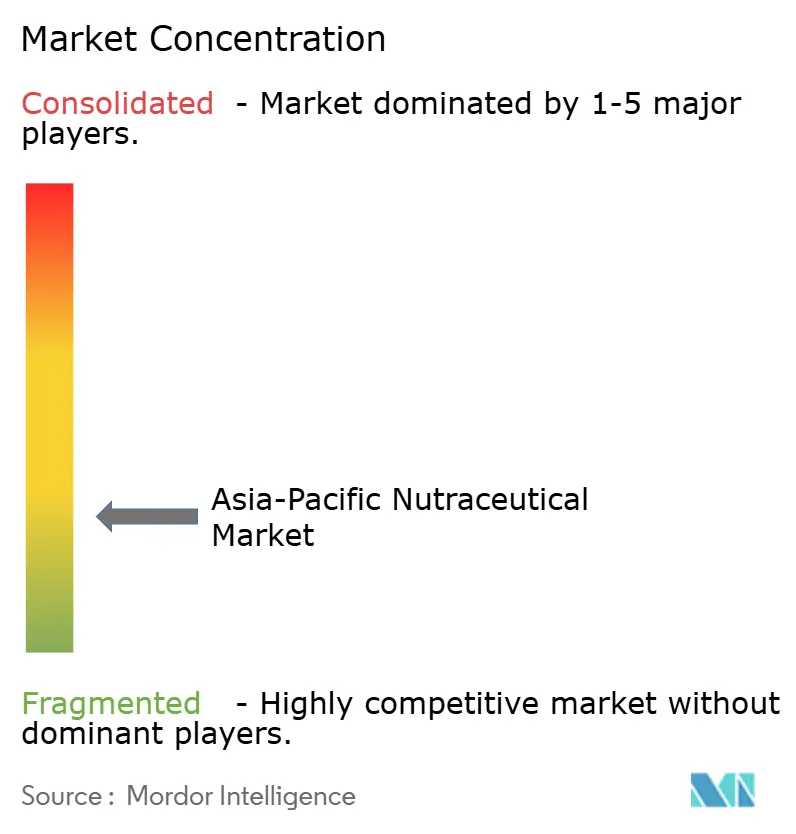
The Asia-Pacific nutraceutical market structure presents a unique balance of moderate concentration and significant fragmentation, opening doors for both established multinational corporations and specialized regional players to thrive. The market environment particularly favors organizations that maintain diverse product portfolios while demonstrating robust regulatory compliance capabilities. This dynamic has become increasingly important as enhanced regulatory enforcement across various jurisdictions creates substantial barriers for smaller companies that lack comprehensive quality systems and proper documentation resources.
The importance of strategic partnerships between international brands and local distributors continues to grow, as illustrated by the significant April 2024 transaction where Mitsui and Rohto jointly acquired Eu Yan Sang International for SGD 800 million, effectively combining traditional Chinese medicine expertise with modern research capabilities. Companies are actively differentiating themselves through technological integration, implementing personalized nutrition platforms, establishing direct-to-consumer digital channels, and adopting advanced manufacturing processes. Market success increasingly depends on organizations' ability to navigate complex regulatory environments while establishing consumer trust through transparent sourcing practices and rigorous quality verification systems.
The industry demonstrates strong confidence in long-term growth prospects, evidenced by substantial manufacturing capacity expansions across the region, including Sirio Pharma's new Thailand facility and numerous facility upgrades, despite ongoing supply chain challenges. Significant opportunities remain in specialized market segments, particularly in sports nutrition, beauty-from-within products, and condition-specific formulations that require extensive clinical validation and regulatory expertise. Companies that maintain ISO 22000 and Good Manufacturing Practice (GMP) compliance frameworks gain significant advantages when operating across multiple APAC markets, each with its distinct regulatory requirements and compliance standards.
Asia-Pacific Nutraceutical Industry Leaders
Nestlé SA
PepsiCo Inc.
Herbalife International of America, Inc.
Bayer AG
Abbott Laboratories
- *Disclaimer: Major Players sorted in no particular order

Market Opportunities and Future Outlook
Regulatory tightening in Southeast Asia creates room for brands that can operationalize compliance across portfolios and markets, especially around label governance, analytical testing, and ingredient-origin disclosures. Malaysia NPRA updates on animal-derived material declarations (April 2026) and mandatory Vitamin B6 warning statements for certain supplements and OTC products (June 2026) provide specific 2026 references, along with Singapore HSA's July 2026 consultation on a Complementary Health Products framework under the Health Products Act. Companies that standardize dossiers, labeling workflows, and quality systems (for example, ISO 22000/HACCP-aligned operations mentioned in the market context) can translate those capabilities into more consistent functional-food, beverage, and supplement launches across ASEAN markets.
Product-format innovation and distribution shifts also point to near-term opportunity areas. In the market context, functional beverages are the fastest-growing product type, and the region continues to move toward more convenient formats that fit digital-first shopping journeys. That supports expansion of condition-specific, ready-to-consume offerings in online retail as subscription and direct-to-consumer models gain traction. At the same time, supply-chain stress points, including India-specific warehousing and cold-chain constraints highlighted by local industry executives, create an opening to invest in local blending, cold-chain, and quality testing capacity. Such investments can help improve service levels for probiotic and other stability-sensitive nutraceutical formats.
Recent Industry Developments
- June 2026: Asahi Group Foods signed a sales agreement with Maypro Industries to export its proprietary milk peptide LNDP to international markets from July 2026. The move expands an APAC-origin functional ingredient into broader downstream nutraceutical and functional food applications, supporting cross-border ingredient sourcing strategies.
- August 2025: Florenz Limited lodged a bid to acquire New Zealand manuka honey company Comvita Limited at NZD 0.80 per share, implying an equity value of about NZD 56 million and enterprise value of about NZD 119 million. The proposed deal highlighted consolidation interest around premium bioactive ingredients and branded natural-health platforms in the region.
- April 2024: Mitsui and Rohto jointly acquired Eu Yan Sang International for about SGD 800 million, combining traditional Chinese medicine capabilities with modern R&D and an established retail footprint. The transaction strengthened scale and distribution leverage across multiple APAC markets and accelerated portfolio modernization in TCM-adjacent nutraceutical categories.


Research Methodology Framework and Report Scope
Market Definition and Coverage
For this study, the market is defined as the value of nutraceutical products sold across Asia-Pacific, covering functional foods, functional beverages, and dietary supplements, measured at the market level in current US dollars.
Scope exclusions: The sizing excludes conventional packaged foods and drinks with no added functional claim, and it also excludes pharmaceutical drug sales that are not marketed as nutraceuticals.
Segmentation Overview
- By Product Type
- Functional Food
- Cereals
- Bakery and Confectionery
- Dairy
- Snacks
- Other Functional Foods
- Functional Beverage
- Energy Drinks
- Sports Drinks
- Fortified Juice
- Dairy and Dairy-Alternative Beverages
- Other Functional Beverages
- Dietary Supplements
- Vitamins and Minerals
- Botanicals
- Enzymes
- Fatty Acids
- Proteins
- Other Dietary Supplements
- Functional Food
- By Distribution Channel
- Supermarkets and Hypermarkets
- Convenience Stores
- Specialty Stores
- Online Retail
- Others
- By Geography
- China
- India
- Japan
- Australia
- Indonesia
- South Korea
- Thailand
- Singapore
- Rest of Asia-Pacific
Data Sources, Market Sizing, and Validation
Desk Research
Desk research was used to set the demand context and the country-level starting points before assumptions were finalized. We leaned on public sources such as national statistics offices for population and household spend indicators, food safety and labeling regulators in key Asia-Pacific countries, customs and tariff databases for import-export signals, and nutrition or public health agencies for diet and deficiency trends. These sources helped us keep the addressable pool grounded in what is actually consumed and traded.
To translate that context into market math, we also reviewed company annual reports, investor presentations, and product portfolio disclosures to understand category mix and pricing ladders. Selected paid subscriptions were used only for company financials and structured news tracking, plus patent databases to sanity check ingredient innovation cycles. The sources listed here are illustrative, and many other public and paid references were also used for data collection, validation, and clarification during the work.
Primary Interviews and Surveys
Primary work was used to pressure test the category split and pricing logic that can vary across functional foods, beverages, and supplements. We spoke with manufacturers, distributors, retailers, and industry experts across major Asia-Pacific markets to confirm what is selling, how price points are moving, and where demand is shifting, for example toward vitamins, botanicals, and protein-based formats. Feedback was then used to adjust assumptions that could not be reliably inferred from public statistics alone, before the final totals were signed off.
Distribution of primary research fieldwork respondents
| Company type | Respondent position |
|---|---|
| Top tier: 27% | CXOs: 14% |
| Mid tier: 59% | Functional/Unit leaders: 26% |
| Smaller Players: 14% | Managers: 60% |
Market-Sizing & Forecasting
The core sizing starts with a top-down build where country demand pools are reconstructed from consumer health and wellness spending signals, category penetration, and observed price bands across the three included product families. Once the country totals are shaped, they are aggregated to the Asia-Pacific number, and then checked using selective bottom-up approximations like sampled category revenues from suppliers, channel checks, and an average selling price times volume sanity test.
Inputs that were used to keep the model realistic include population by age cohort, urbanization and income movement, supplement and fortified product penetration, category-level pricing ladders (mass versus premium), and the pace of e-commerce contribution in nutrition-led purchases. Where bottom-up reads were incomplete for smaller markets, gaps were handled through calibrated proxies using similar countries on income and modern trade mix, followed by an expert re-check.
For forecasting, scenario analysis was applied around key drivers that materially move nutraceutical demand in Asia-Pacific, and then a simple multivariate regression was used to keep growth tied to the same measurable indicators used in the base year. Forecast assumptions were kept consistent with what primary respondents described for pricing progression, category expansion, and regulatory tightening on claims and labeling.
Data Validation & Update Cycle
Outputs were validated through stepwise checks that compare results with independent signals, including trade flows, category growth narratives in public filings, and price movement direction from channel feedback. When a country or category showed an unusual jump, we revisited the underlying drivers, rechecked conversion logic, and re-contacted relevant interviewees if the variance could not be explained.
Before sign-off, the model and assumptions go through multiple analyst reviews so arithmetic, scope logic, and trend consistency are aligned. The report is refreshed annually, and interim updates are made when material events occur, such as major regulatory changes or sharp commodity-driven price resets. Right before delivery, a fresh validation pass is performed so the numbers reflect the latest available information.
Mordor Intelligence's Asia Pacific Nutraceutical Market Size Compared Against Other Published Estimates
Published market sizes for Asia-Pacific nutraceuticals can look far apart because each publisher chooses its own product scope, base year, and pricing logic. Differences also come from how countries are grouped, whether values are recorded at retail or at the manufacturer level, and how fast assumptions are updated when claims rules or consumer sentiment change.
Some estimates expand the scope beyond consumer nutraceuticals by folding in adjacent areas like personal care and animal nutrition, which lifts the total even if the core consumer categories are similar. In Mordor Intelligence, the count is limited to functional foods, functional beverages, and dietary supplements only, and totals are rechecked using country demand indicators and interview-led price band validation so the sum stays consistent with observed consumption patterns.
Benchmark comparison
| Source | Market Size | Gaps in Research Methodology |
|---|---|---|
| Mordor Intelligence | USD 116.32 B (2025) | |
| Industry Publisher A | USD 115.01 B (2025) | Uses a similar year but leans more on broad application tagging and country coverage lists, which can shift category mapping and the implied mix by market, thereby changing the total even when the headline scope appears close. |
| Industry Publisher B | USD 103.00 B (2025) | Includes additional type buckets such as pharmaceuticals and personal care, and the lower 2025 value suggests different pricing basis or a more conservative base-case setting for key countries, which pulls down the starting point. |
The spread across the three figures is mainly explained by how tightly the market is defined and how pricing and country mix are treated in the base year. By keeping the scope tied to consumer nutraceutical categories and then validating pricing bands and penetration with field feedback, the final number stays traceable to clear inputs and repeatable checks.


Key Questions Answered in the Report
How large will the Asia-Pacific nutraceutical market be by 2031?
It is projected to reach USD 182.65 billion, expanding from USD 116.32 billion in 2025 to USD 125.41 billion in 2026 at a 7.81% CAGR.
Which product category leads spending in the region?
Functional foods hold the top spot, accounting for 43.10% of 2025 revenue.
What is the fastest-growing distribution channel?
Online retail is forecast to grow at an 8.59% CAGR between 2026-2031, outpacing all other channels.
Why is India considered the most attractive high-growth geography?
Regulatory modernization, rising disposable income, and an 8.31% CAGR position India for the strongest expansion through 2031.
Page last updated on:





