
Asia-Pacific Less-than-Container-Load (LCL) Market Size and Share
Market Overview
| Study Period | 2020 - 2031 |
|---|---|
| Forecast Data Period | 2026 - 2031 |
| Base Year Market Size (2025) | USD 44.38 Billion |
| Market Size (2026) | USD 47.44 Billion |
| Market Size (2031) | USD 66.28 Billion |
| Growth Rate (2026 - 2031) | 6.92 % |
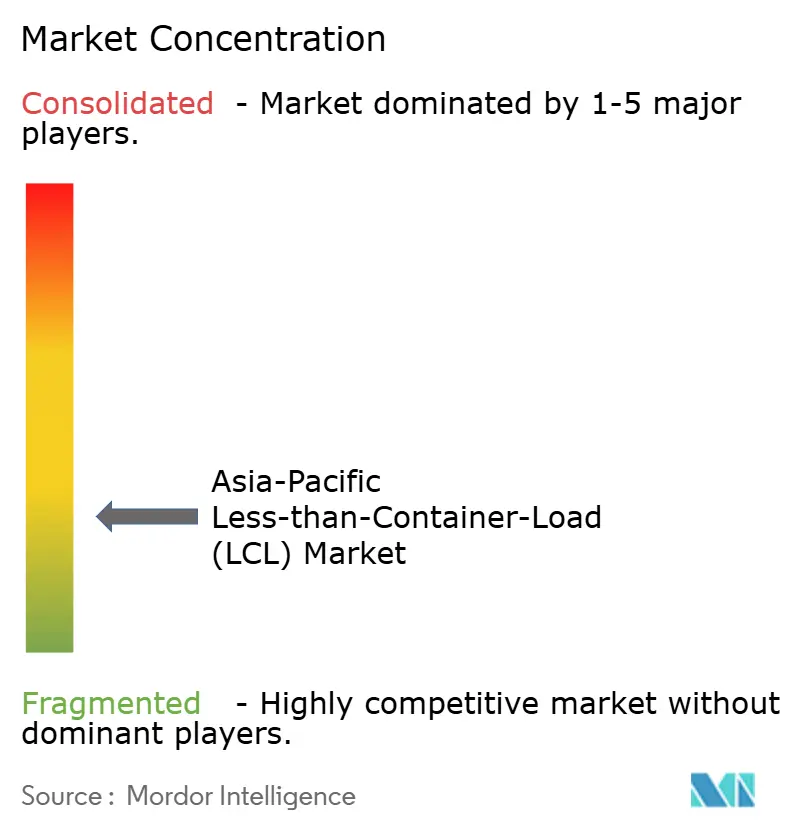
| Market Concentration | Low |
Major Players *Disclaimer: Major Players sorted in no particular order Image © Mordor Intelligence. Reuse requires attribution under CC BY 4.0. | |
Asia-Pacific Less-than-Container-Load (LCL) Market Analysis by Mordor Intelligence
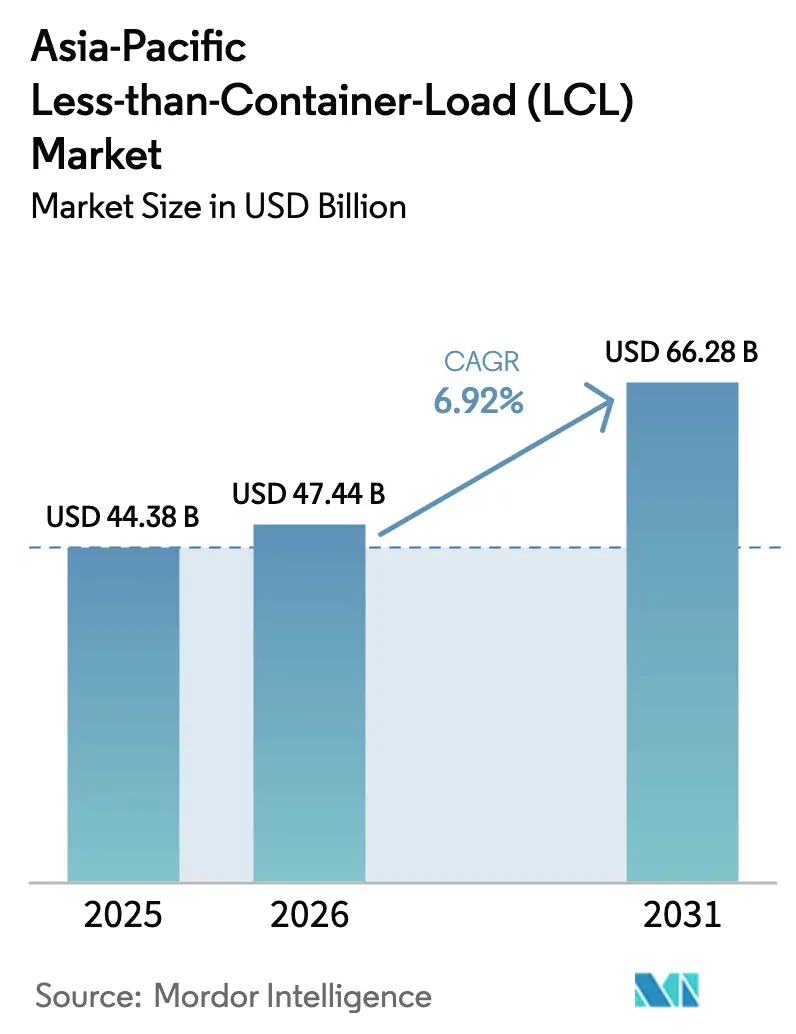
The Asia-Pacific Less-than-Container-Load Market size was valued at USD 44.38 billion in 2025 and estimated to grow from USD 47.44 billion in 2026 to reach USD 66.28 billion by 2031, at a CAGR of 6.92% during the forecast period (2026-2031).
The explosive rise of cross-border e-commerce buoys demand, the cost advantage of LCL over air freight for small and medium shippers, and steadily widening regional free-trade frameworks. Consolidation services dominate because cargo aggregation reduces per-unit shipping costs while providing schedule flexibility. Technology adoption—especially real-time booking tools—improves shipment visibility, lowers transaction costs, and encourages first-time users to shift from air to ocean. Manufacturing diversification beyond China continues to redraw trade corridors and spur new LCL gateways in India, Vietnam, and Indonesia as companies pursue supply-chain resilience. Volatile ocean freight rates and recurring port congestion remain key risks, but infrastructure upgrades and regional trade pacts counterbalance these headwinds.
Key Report Takeaways
- By service type, consolidation services held 64.45% of the Asia-Pacific Less-than-Container-Load market share in 2025, whereas de-consolidation and distribution are expected to post a 4.21% CAGR from 2026 to 2031
- By destination, international routes generated 60.40% of 2025 volume, while domestic services are forecast to register a 4.66% CAGR to 2031. Meanwhile, domestic routes are projected to grow at a faster 4.66% CAGR through 2031.
- By nature of business, freight forwarding accounted for 92.40% share of the Asia-Pacific Less-than-Container-Load market size in 2025; NVOCCs pushing their CAGR to 5.32% through 2031.
- By end user, retail & e-commerce held 35.25% of the 2025 volume. Yet, healthcare & pharmaceuticals are projected to grow at a 6.05% CAGR through 2031.
- By country, China retained 39.60% of 2025 regional value, but India is set to record the fastest expansion at a 5.12% CAGR until 2031.
Note: Market size and forecast figures in this report are generated using Mordor Intelligence’s proprietary estimation framework, updated with the latest available data and insights as of 2026.
Market Trends and Insights
Drivers Impact Analysis of Asia-Pacific Less-than-Container-Load (LCL) Market*
| Driver | (~) % Impact on CAGR Forecast | Geographic Relevance | Impact Timeline |
|---|---|---|---|
| E-commerce boom & cross-border parcel trade | +2.1% | China, India, Southeast Asia | Medium term (2-4 years) |
| Supply-chain diversification of Asia-Pacific manufacturing | +1.8% | China, India, Vietnam, Indonesia | Long term (≥ 4 years) |
| Cost-efficiency of LCL over air freight for SMEs | +1.3% | Southeast Asia, emerging markets | Short term (≤ 2 years) |
| Port infrastructure expansion & FTAs | +1.0% | India, Vietnam, Indonesia | Long term (≥ 4 years) |
| Digital freight platforms with LCL spot rates | +0.9% | Singapore, Hong Kong, regional hubs | Medium term (2-4 years) |
| Green-shipping initiatives and load optimisation | +0.6% | Developed Asia-Pacific markets | Long term (≥ 4 years) |
| Source: Mordor Intelligence | |||
E-commerce boom & cross-border parcel trade
Retail e-commerce sales in Southeast Asia are expected to hit USD 193 billion by 2028, equal to 17.4% of total retail spend[1]Staff Reporters, “E-commerce Sales in APAC to Hit $3.2 Trillion by 2028,” CampaignAsia.com. Rising online orders require smaller, more frequent shipments that suit LCL economics. The Philippines and Vietnam each anticipate online-retail CAGRs above 20%, creating constant demand spikes that traditional full-container contracts cannot match. RCEP customs simplification lowers transaction costs, speeding up small-batch clearances and pushing merchants toward regional inventory hubs. Omnichannel models mean inventory must be replenished across multiple markets simultaneously, reinforcing LCL’s role in synchronized stock flows. As marketplaces promote same-week delivery promises, shippers prioritize flexible sailings over absolute rate minimization.
Supply-chain diversification of Asia-Pacific manufacturing
Foreign direct investment began shifting toward Southeast Asia during 2024 as firms executed “China + 1” strategies. Smaller production footprints scattered across India, Vietnam, and Indonesia require multi-origin pick-ups for final assembly or direct export, thereby elevating LCL volumes. Japanese electronics groups moved auxiliary lines to Thailand and the Philippines, contracting specialist consolidators to synchronize outbound flows. The region needs an additional USD 60 billion in logistics assets to handle this dispersed output, further magnifying consolidation demand. Heightened geopolitical tension accelerates relocation timelines, making agile LCL nodes attractive stopgaps while multi-country plants scale. As buyers diversify suppliers, consolidation centers emerge in secondary ports, shortening inland haulage and improving turnaround.
Cost-efficiency of LCL over air freight for SMEs
A 2025 C.H. Robinson poll shows 75% of LCL users plan to increase reliance on ocean consolidation because it cuts freight spend by up to 80% versus air on non-urgent lanes[2]Greg Scott, “The Role of LCL Shipping in the Post-Pandemic World,” SupplyChainBrain.com. Carriers report on-time performance exceeding 90% on redesigned East–West loops, narrowing perceived service gaps with air. Digital booking portals slash paperwork and allow instant comparison between LCL and air quotes, making mode shift straightforward for resource-constrained exporters. Air-cargo rates have risen due to persistent capacity constraints, widening the savings window in favor of LCL. SMEs leverage LCL to hold lower inventory without committing to full containers, improving working-capital cycles.
Digital freight platforms offering LCL spot rates
Ninety-nine percent of Ocean Network Express bookings now flow through digital channels. Real-time visibility, spot pricing, and automated documentation democratize access for first-time exporters. Indonesia’s National Logistics Ecosystem spans 264 ports and 6 airports, linking customs, shipping lines, and truckers on one interface and reducing average clearance times by 17%. AI-driven load-combining engines match shipments by size, haz-clas,s and temperature, minimizing empty slots and raising vessel utilization. Blockchain pilots trim days from bill-of-lading issuance while cutting fraud risk. Digitalization also streamlines payment processing, reassuring credit-sensitive SME shippers.
Restraints Impact Analysis of Asia-Pacific Less-than-Container-Load (LCL) Market*
| Restraint | (~) % Impact on CAGR Forecast | Geographic Relevance | Impact Timeline |
|---|---|---|---|
| Port congestion & capacity constraints | -1.4% | Singapore, Shanghai, regional trans-shipment hubs | Short term (≤ 2 years) |
| Volatility in ocean-freight rates | -0.8% | Asia-US, Asia-Europe corridors | Medium term (2-4 years) |
| Limited cold-chain LCL infrastructure | -0.5% | Pharmaceutical and food lanes | Medium term (2-4 years) |
| Emerging ESG compliance burdens | -0.3% | Developed Asia-Pacific economies | Long term (≥ 4 years) |
| Source: Mordor Intelligence | |||
Port congestion & capacity constraints
Singapore and Colombo experienced extended vessel waits after Red Sea diversions in early 2025[3]Keri Allan, “How to Solve Growing Port Congestion,” ship.nridigital.com. Berth shortages ripple into feeder schedules, delaying container de-stuffing deadlines that underpin LCL cut-off times. Feeder operators imposed congestion surcharges that directly lift LCL unit costs. Labor shortages and limited night-gate hours further restrict throughput, especially for temperature-sensitive cargo needing priority handling. Automation projects promise capacity relief, but near-term mismatches between container arrivals and yard slots will continue disrupting LCL consolidation windows. Stakeholders advocate for better berth-allocation algorithms and data-sharing to smooth peaks.
Volatility in ocean-freight rates
Asia–US West Coast spot prices fell 26.57% in February 2025 alone[4]Peter Stallion, “FBX Index March 2025: Volatility Hits Container Spot Rates,” balticexchange.com. Carriers responded with blank sailings, withdrawing 75,700 TEU in one month, which destabilized sailing schedules relied on by consolidators. Some forwarders introduced variable-fuel surcharges and two-tier contracts that pass through extraordinary rate changes, complicating budgeting for SMEs. Potential U.S. import tariffs on Chinese-built vessels would add up to USD 1.5 million per ship, creating incremental cost pressure. Dissolution of mega-alliances raises uncertainty over long-term capacity, fuelling sharper price swings.
*Our forecasts treat driver/restraint impacts as directional, not additive. The impact forecasts reflect baseline growth, mix effects, and variable interactions.
Asia-Pacific Less-than-Container-Load (LCL) Market Segment Analysis
By Service Type:
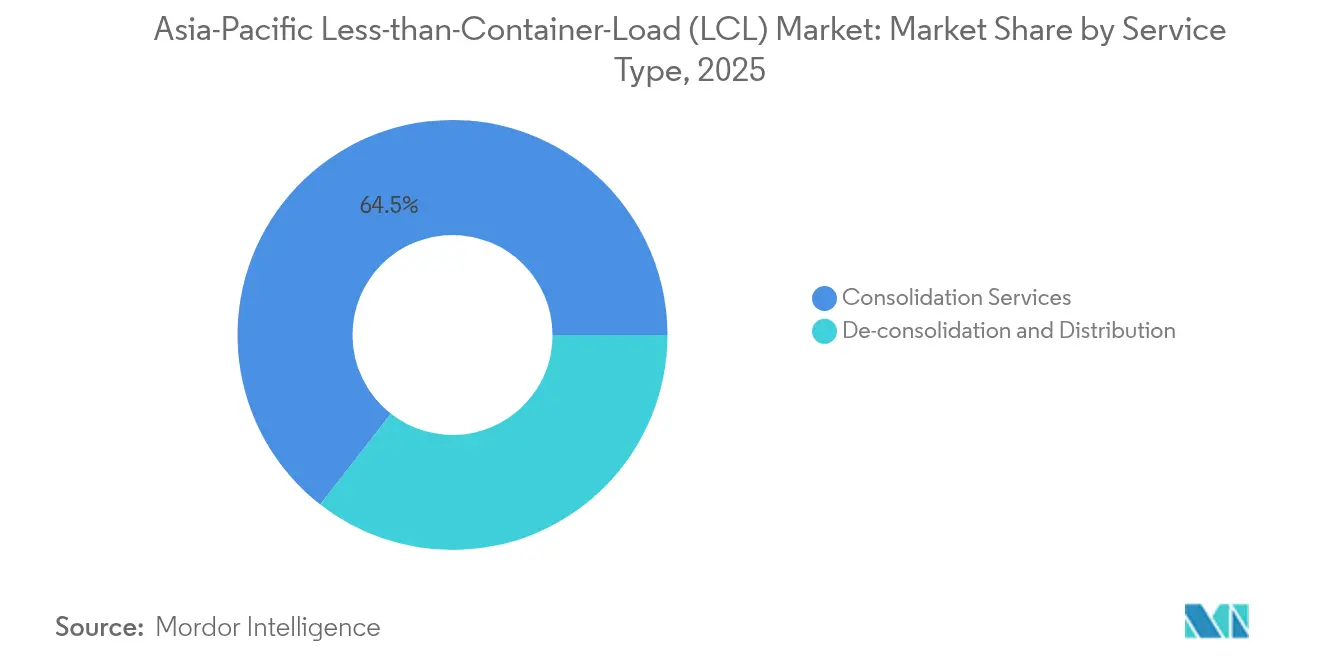
Consolidation Leads Efficient RoutingConsolidation services commanded 64.45% of 2025 revenue. Their dominance stems from the Asia-Pacific Less-than-Container-Load market economics in which cargo aggregation into shared containers drives lower per-unit costs and faster sailing frequency. Maersk’s Shanghai gateway with more than 200 direct lanes evidences the scale required to sustain daily consolidations. De-consolidation and distribution, though smaller, post a 4.21% CAGR to 2031 as retailers seek destination-side break-bulk for rapid e-commerce fulfillment. Integrated providers bundle in-country distribution with upstream consolidation to secure door-to-door contracts.
Demand for consolidation services rises with each additional omnichannel stock-point merchant set up across Asia. The Asia-Pacific Less-than-Container-Load market responds by opening new hub-and-spoke facilities in Penang, Cebu, and Surabaya. De-consolidation growth also mirrors the adoption of bonded e-commerce warehouses, where shipment splitting, labeling, and returns handling occur inside free-trade zones. Value-added distribution tasks, such as kitting or light assembly, allow consolidators to move up the service ladder, capturing higher margins.



By Destination:
International Dominance with Domestic MomentumInternational shipments generated 60.40% of the 2025 value, illustrating the export-oriented nature of many Asian production centers. The Asia-Pacific Less-than-Container-Load market size tied to overseas routes remains anchored by North American and European consumption cycles. Nevertheless, domestic LCL lanes are expected to post a faster 4.66% CAGR (2026-2031) as intra-Asia sourcing spreads. RCEP’s common rule of origin is forecast to add USD 90 billion to regional trade and feed domestic consolidation flows.
Domestic LCL expansion pairs with rising middle-class demand for imported components assembled locally. This trend supports multi-country production chains in electronics and automotive, triggering back-and-forth movements of semi-finished goods. Consolidators refine trucking alliances for first-mile pick-ups to ensure container stuffing deadlines remain intact when origin points multiply. Forwarders also renegotiate depot leases in land-constrained metro areas to shorten drayage.
By Nature of Business:
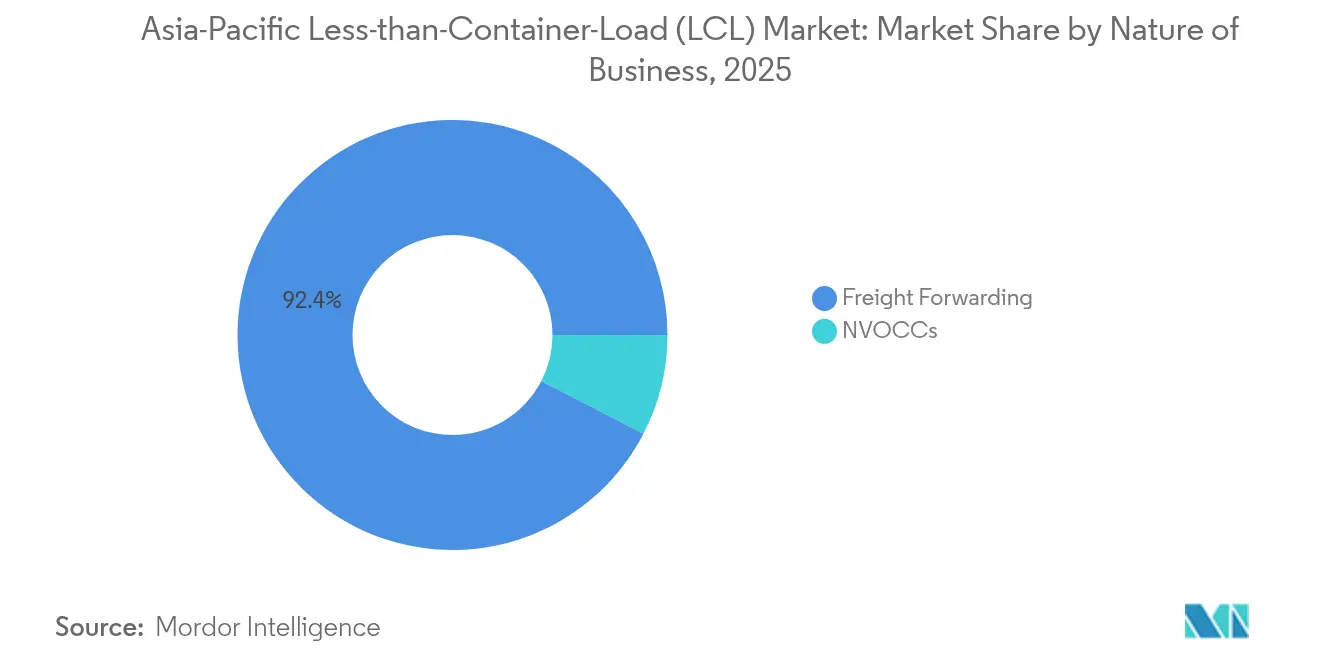
Freight Forwarders Retain CommandFreight forwarders handled 92.40% of 2025 volume, underscoring the relationship-based complexity of Asia-Pacific trade lanes. The Asia-Pacific Less-than-Container-Load market depends on forwarders to interpret diverse customs rules, arrange multimodal combinations, and secure cargo insurance. Digitalization allows some NVOCCs to win share, pushing their CAGR to 5.32% through 2031, but forwarders continue to scale technology investments to defend their turf.
Global forwarders court SME exporters through self-service portals while still providing human expertise for escalations. Meanwhile, several NVOCCs adopt dynamic routing algorithms that bypass congested hubs. Competitive pressure pushes both models to integrate carbon-reporting dashboards, a growing tender requirement. As importers demand landed-cost visibility, forwarders expand duty-and-tax advisory, reinforcing their value proposition beyond line-haul execution.
By End User:
Healthcare Logistics AcceleratesRetail & e-commerce generated 35.25% of 2025 spend as online orders proliferated. Yet healthcare & pharmaceuticals now hold the fastest lane, with a 6.05% CAGR (2026-2031) supported by DHL’s EUR 500 million (USD 520 million) regional cold-chain expansion. The Asia-Pacific Less-than-Container-Load market share of temperature-controlled lanes will climb as biotech manufacturing clusters emerge in South Korea, Singapore, and India. Manufacturing and automotive continue to rely on LCL for components with short lead-time tolerances.
Pharma shippers demand GDP-certified hubs, real-time temperature telemetry, and validated packaging. Consolidators respond by adding reefer consolidation cells and training staff in cold-chain SOPs. E-commerce returns create new backhaul loads, improving container utilization. Agriculture and forestry rely on LCL to move specialty inputs such as fertilizer additives or seedlings to island economies, keeping niche volumes steady.
Geography Analysis
China Less-than-Container-Load (LCL) Market
China held 39.60% of the 2025 value, leveraging extensive port infrastructure and digital freight ecosystems. The Asia-Pacific Less-than-Container-Load market continues to treat Shanghai, Ningbo, and Shenzhen as primary load centers. Rising labor costs and compliance scrutiny prompt some exporters to shift heavy, labor-intensive processing elsewhere, but high-tech manufacturing persists, sustaining outbound consolidation demand. Investment in smart-port automation raises throughput efficiency, partially offsetting congestion spikes.
India Less-than-Container-Load (LCL) Market
India is expected to record the highest expansion at a 5.12% CAGR (2026-2031). The National Logistics Policy aims to trim logistics cost-to-GDP from 14% to 8%, supporting corridor developments such as the Dedicated Freight Corridor and inland multimodal parks. Unified Logistics Interface Platform digitizes documentation, reducing clearance times. Inland container depots near Jaipur and Indore enable hinterland SMEs to access LCL gateways without long drays to coastal ports, broadening market reach.
Regulatory Landscape
Asia-Pacific LCL activity is shaped by a blend of trade facilitation frameworks and country-level customs and maritime oversight. Regionally, RCEP provides common ground on standards, technical regulations, and conformity assessment procedures across member economies, which supports multi-country sourcing and intra-Asia LCL routings. In parallel, APEC trade ministers adopted the Suzhou Declaration (May 27, 2026) to establish a cross-border electronic bill of lading (eBL) technical interoperability framework, aligning with the UNESCAP Framework Agreement on Facilitation of Cross-border Paperless Trade and reinforcing the policy push toward paperless trade lanes.
At the national level, compliance requirements continue to evolve in ways that affect documentation, clearance, and charge pass-through for LCL shipments. Vietnam implemented legal reforms effective July 1, 2026 (including the Tax Administration Law 2025 and Circular 31/2026/TT-BCT on product traceability), which raises the importance of accurate data capture and traceability-linked documentation for import-export flows that feed consolidation and deconsolidation nodes. In the Philippines, the Bureau of Customs has reviewed a Joint Administrative Order aimed at regulating charges by foreign shipping lines under the Customs Modernization and Tariff Act (CMTA), a development that can affect the landed-cost stack for LCL moves and the fee transparency required in forwarder quotations.
Value Chain Analysis
The Asia-Pacific LCL value chain begins with SME exporters, manufacturers, and e-commerce sellers booking small-batch cargo through freight forwarders and NVOCC-led consolidators, then moving shipments via first-mile trucking to container freight stations (CFS) for consolidation, documentation, and customs processing. Ocean carriers and feeder operators provide the line-haul and transshipment connectivity into major hubs, including gateways such as Shanghai that support high-frequency LCL cut-offs, followed by destination-side CFS deconsolidation and last-mile distribution into retail, industrial, and healthcare networks. Digital booking and documentation have become part of execution, with carriers and forwarders increasingly routing bookings, visibility events, and document exchange through platform workflows rather than manual email-based processes.
Control points with rising strategic value include customs and regulatory compliance capability, temperature-controlled handling, and the ability to offer multimodal alternates when port congestion or sailing disruptions compress LCL cut-off windows. Large logistics groups are also pursuing vertical integration across road, air, and ocean legs to improve schedule control and reduce reliance on spot-market volatility. Investments in cold-chain and clean-room adjacent facilities support higher-value LCL flows in pharmaceuticals and electronics. As documentation requirements evolve, notably in Vietnam and the Philippines, forwarders and consolidators that can standardize data, automate filings, and manage surcharge pass-through gain an operating advantage in retaining SME customers and securing contract-based volumes.
Competitive Landscape
The Asia-Pacific Less-than-Container-Load market exhibits moderate fragmentation. ECU Worldwide, Shipco, Vanguard Logistics, and Rhenus Logistics dominate pure consolidation, each operating proprietary CFS (container freight station) networks in more than 15 regional ports. Integrated giants—DHL Global Forwarding, Kuehne + Nagel, and DSV—leverage end-to-end offerings, coupling LCL with air charter and contract logistics. The top five players control roughly 32% of total throughput, leaving ample share for regional specialists.
Technology adoption shapes competitive edges. Ocean Network Express attains 99% digital booking penetration, shortening booking windows from two days to two hours. Maersk embeds predictive ETAs into its Shanghai gateway, giving customers auto-alerts on cut-off shifts. Vanguard pilots blockchain bills of lading on Hong Kong–Los Angeles lanes, trimming documentation time by 38%. Sustainability also differentiates providers: ITOCHU pledges net-zero by 2040 and tests bio-fuel blends on intra-Asia shuttles.
Mergers and partnerships accelerate scale. DSV’s EUR 14.3 billion (USD 14.9 billion) takeover of Schenker doubles its global footprint, adding crucial Asian CFS assets and nearly 160,000 staff across 90 countries. Asian carriers Sinotrans and TS Lines launch a Mexico service, widening LCL routing choices and intensifying margin competition on trans-Pacific lanes. White-space remains in pharma-grade and high-value electronics consolidation where qualified CFS capacity is undersupplied, offering room for niche entrants.
Asia-Pacific Less-than-Container-Load (LCL) Industry Leaders
ECU Worldwide (Part of All Cargo Logistics)
Shipco
Vanguard Logistics
Rhenus Logistics
Kuehne + Nagel
- *Disclaimer: Major Players sorted in no particular order
Asia-Pacific Less-than-Container-Load (LCL) Market Companies Covered in this Report
- ECU Worldwide (Part of All Cargo Logistics)
- Shipco
- Vanguard Logistics
- Rhenus Logistics
- Kuehne + Nagel
- DHL Global Forwarding
- DSV
- CEVA Logistics
- Rohlig Logistics
- GEODIS
- Gulf Agency Company (GAC)
- Kerry Logistics Network
- Sinotrans
- Nippon Express
- CJ Logistics
- JAS Worldwide
- APL Logistics
- Dimerco Express Group
- Yusen Logistics (Part of NYK Line)
- Toll Group
Read Analysis of Asia-Pacific Less-than-Container-Load (LCL) Companies

Market Opportunities and Future Outlook
A key opportunity area is scaling paperless trade enablement for LCL, where high document intensity and frequent shipper onboarding create friction costs. The APEC Suzhou Declaration (May 2026) on cross-border eBL technical interoperability, alongside the UNESCAP paperless trade framework, supports investment in interoperable eBL workflows, automated document checking, and digital release processes that shorten booking-to-gate cycles and reduce errors that trigger holds at CFS and ports. Providers that translate these regional initiatives into lane-level execution, by integrating forwarder portals, carrier systems, and customs interfaces, can differentiate on speed and exception management rather than only on buy rates.
Another whitespace is capacity and capability development for high-value, compliance-intensive LCL verticals and emerging origin points created by manufacturing diversification beyond China. Demand signals include DHL Groups EUR 500 million Asia-Pacific life-sciences logistics expansion announced in April 2025, which highlights active investment in GDP-capable infrastructure and reefer capacity that can be leveraged for temperature-sensitive LCL programs. Vietnam-focused compliance changes effective July 1, 2026, covering tax administration and product traceability rules, also reinforce the case for consolidators that can bundle traceability-ready documentation, controlled handling, and predictable distribution in key Southeast Asian gateways. Multimodal network build-outs by large providers, including greater own-controlled connectivity in time-sensitive air freight lanes, open hybrid products (air-ocean, ocean-air, and truck-ocean combinations) that improve resilience when congestion and blank sailings disrupt standard LCL schedules.
Recent Industry Developments in Asia-Pacific Less-than-Container-Load (LCL) Market
- July 2026: Expanded Vietnam coverage with direct LCL services from Haiphong and Ho Chi Minh City to Jebel Ali. The launch expands Vanguard Logistics APAC network and improves visibility and capacity on key corridors to the Middle East and Africa. The expansion strengthens regional connectivity to Middle East and Africa and enhances service levels for APAC exporters relying on Vietnam as a sourcing hub.
- July 2026: Launched direct Busan-to-Koper service connecting Asia with Central and Eastern Europe. The new route creates a direct Asia Europe LCL linkage that broadens routing options for shippers. Diversifies routing options for APAC exporters to Europe and may influence margins and rate dynamics on trans-continental lanes.
- June 2026: Opened new office in Piraeus, Greece to serve as a local gateway for regional forwarding community. The gateway expansion strengthens in-region consolidation and access to European markets. It may shift origin-destination dynamics for APAC-origin shipments routed via Europe through enhanced local presence.


Asia-Pacific Less-than-Container-Load (LCL) Market Report Scope and Research Methodology
Market Definition and Coverage
For this study, the market is defined as revenue earned from ocean freight less-than-container-load (LCL) services in Asia-Pacific, where multiple shippers share a container and the shipment is moved through an origin and destination handling network.
Scope exclusions: Full-container-load (FCL) moves, pure air or road freight services, and non-freight charges that are not tied to LCL handling or transport are excluded.
Segments Covered in This Report
- By Service Type
- Consolidation Services
- De-consolidation & Distribution
- By Destination
- Domestic
- International
- By Nature of Business
- Freight Forwarding
- NVOCCs
- By End User
- Manufacturing and Automotive
- Retail & E-commerce
- Healthcare & Pharmaceuticals
- Agriculture & Forestry
- Other End Users
- By Country
- China
- India
- Indonesia
- Japan
- Malaysia
- Thailand
- Vietnam
- Australia
- Rest of Asia-Pacific
Data Sources, Market Sizing, and Validation
Desk Research
Desk research was used to map the trade lanes and understand what typically drives LCL demand in the region, before any modeling assumptions were set. We relied mainly on public trade and port indicators to build a realistic demand view, then linked those signals to LCL service activity.
Common inputs included official and non-paywalled sources such as UN Comtrade trade statistics, WTO trade outlook updates, UNCTAD maritime transport publications, port authority throughput releases across major Asia-Pacific gateways, and OECD macro and industry data series. We also used company filings and investor presentations, customs and freight news coverage, and in-house subscriptions that support company financials, shipment-level import and export checks, and tender and contract tracking, mainly to validate direction and pricing logic. The sources listed here are illustrative, and many other public documents and data points were also reviewed to fill gaps and cross-check assumptions.
Primary Interviews and Surveys
Primary work focused on interviews and structured surveys with LCL operators, freight forwarding teams, consolidators, and large shippers that regularly buy LCL space. Coverage was spread across key trading markets in Asia-Pacific so the model could be tuned for differences in lane mix, port congestion patterns, and typical shipment profiles, and then rechecked against what respondents are seeing in current contracts and spot buying.
Distribution of primary research fieldwork respondents
| Company type | Respondent position |
|---|---|
| Top tier: 27% | CXOs: 12% |
| Mid tier: 59% | Functional/Unit leaders: 28% |
| Smaller Players: 14% | Managers: 60% |
Market-Sizing & Forecasting
Sizing starts from a top-down reconstruction of the addressable LCL demand pool using Asia-Pacific seaborne trade and port activity as base signals, which are then filtered through LCL-typical shipment behavior. To keep this grounded, we corroborate totals using selective bottom-up checks, such as sampled lane-level volumes multiplied by typical LCL pricing ranges, plus channel checks on consolidation activity.
Practical inputs that shaped the model include containerized trade growth by country, port throughput and dwell-time signals, the share of LCL-friendly commodities in exports and imports, average shipment size ranges that push shippers toward consolidation, and spot versus contract rate direction for common intra-Asia and Asia to long-haul lanes. Where direct values were not consistently observable for smaller corridors, gaps were handled using proxy lanes with similar trade structure and then adjusted using primary feedback on relative pricing and handling intensity.
Forecasting uses scenario-based analysis supported by trend inputs from respondents, followed by exponential smoothing on key demand indicators so short-term swings do not overstate the long-run path. The final forecast is then checked to ensure it remains consistent with expected trade recovery, capacity additions, and known seasonality tied to peak shipping months.
Data Validation & Update Cycle
Outputs are validated through multiple checks before sign-off, starting with consistency tests across trade growth, port throughput, and implied LCL penetration. Large variances are flagged, and the underlying inputs are revisited, followed by a second pass where assumptions such as rate progression and handling intensity are checked for reasonableness.
If a major anomaly shows up, like a sharp shift in rate direction or an unexpected trade contraction, respondents are re-contacted to confirm whether the change is structural or temporary. Reports are refreshed annually, and interim updates are made when material events occur, such as disruptive regulatory changes, major port disruptions, or sustained freight rate resets. Before delivery, an analyst completes a fresh review so clients receive the most current view available.
Mordor Intelligence's Asia Pacific Less Than Container Load Lcl Market Sizing Compared With Other Published Estimates
Published values for Asia-Pacific LCL can differ because studies do not always count the same service scope, geography cut, or the timing of rate assumptions, and those choices change the revenue pool quickly. Differences also come from how trade growth is converted into LCL demand, and whether spot pricing spikes are treated as a new normal.
Some published figures fold in the wider sea freight forwarding revenue pool, or they treat LCL as any shared-container activity across mixed modes and value-added services. In Mordor Intelligence, the value is limited to ocean LCL service revenue within Asia-Pacific, and the pricing curve is refreshed using lane-level reality checks so temporary rate shocks do not permanently inflate the base year.
Benchmark comparison
| Source | Market Size | Gaps in Research Methodology |
|---|---|---|
| Mordor Intelligence | USD 44.38 B (2025) | |
| Trade Journal A | USD 45.80 B (2025) | Uses a share-of-global approach taken from a cited global total, and it is not clear if the regional split is reconciled to Asia-Pacific trade mix, lane concentration, or contract-versus-spot weighting. |
| Regional Consultancy B | USD 41.20 B (2024) | Anchors the estimate to a prior-year rate environment and may undercount destination handling and deconsolidation revenues, which can depress totals when port and warehouse activity stays elevated. |
The spread in values mainly comes from whether LCL is counted as a tight ocean-only service set, or as a broader forwarding bucket that blends extra services and mixed-mode moves. By keeping inputs tied to observable trade and port signals, and then pressure-testing pricing and handling assumptions through interviews, the estimate stays traceable and repeatable for planning.


Key Questions Answered in the Report
What is the 2026 value of the Asia-Pacific Less-than-Container-Load market?
It is USD 47.44 billion.
How fast is regional LCL demand expected to grow through 2031?
The forecast compound annual growth rate is 6.92%.
Which service type currently dominates regional revenue?
Consolidation services command 64.45% of 2025 value.
Which end-user segment is growing the quickest?
Healthcare & pharmaceuticals is projected to expand at a 6.05% CAGR to 2031.
Why are SMEs shifting shipments from air to LCL?
LCL can cut freight costs by up to 80% on non-urgent routes while maintaining satisfactory transit times.
Page last updated on:


 Your data is secure and never sold or shared.


