Market Overview
| Study Period | 2018 - 2031 |
|---|---|
| Forecast Data Period | 2026 - 2031 |
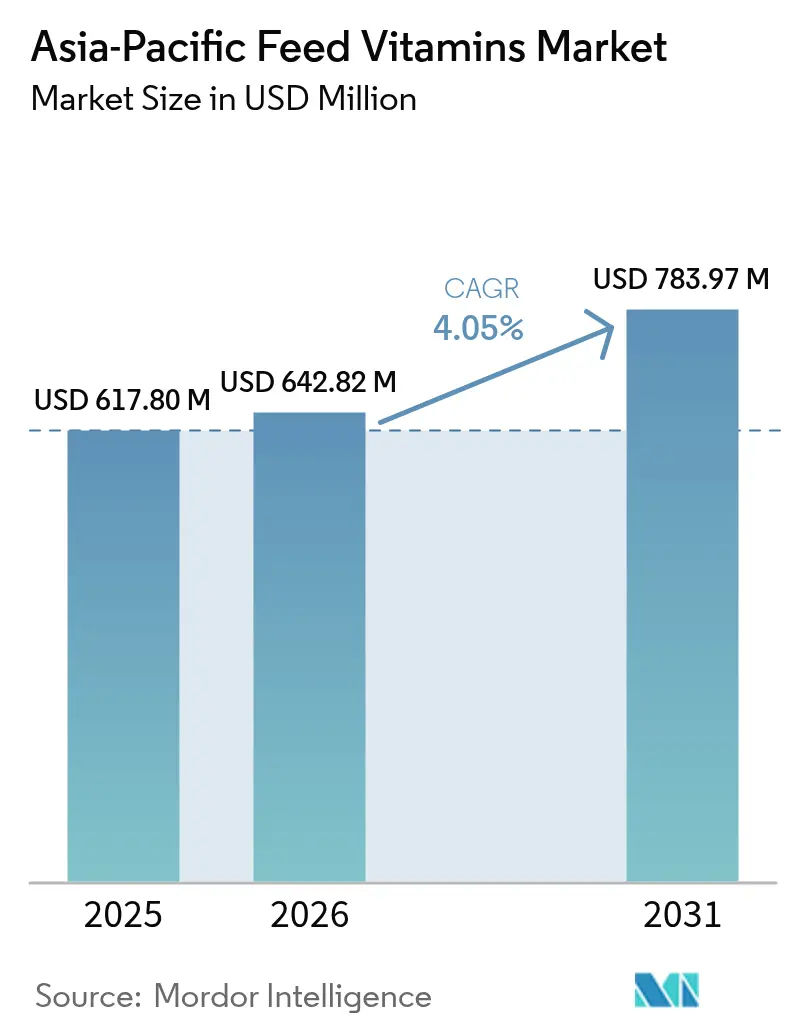
| Base Year Market Size (2025) | USD 617.8 Million |
| Market Size (2026) | USD 642.82 Million |
| Market Size (2031) | USD 783.97 Million |
| Growth Rate (2026 - 2031) | 4.05% CAGR |
| Market Concentration | Medium |
Major Players *Disclaimer: Major Players sorted in no particular order Image © Mordor Intelligence. Reuse requires attribution under CC BY 4.0. | |
Asia-Pacific Feed Vitamins Market Analysis by Mordor Intelligence
The Asia-Pacific feed vitamins market size in 2026 is estimated at USD 642.82 million, growing from 2025 value of USD 617.8 million with 2031 projections showing USD 783.97 million, growing at 4.05% CAGR over 2026-2031. Growth flows from rapid livestock industrialization, stringent antibiotic-free mandates, and expanding aquaculture capacity that collectively increase micronutrient intensity per metric ton of feed. Precision microencapsulation, rumen-protected delivery, and premix contracting shield buyers from price volatility while lifting supplier differentiation. Supply disruptions notably the 2024 fire at BASF’s Ludwigshafen site, temporarily tightened Vitamin A and E availability, prompting integrators to diversify sourcing and lock in long-term agreements. Carbon-footprint labeling and pathogen-immunity supplementation add fresh tailwinds by rewarding traceable and functional vitamin solutions that command premium pricing in key export economies.
Key Report Takeaways
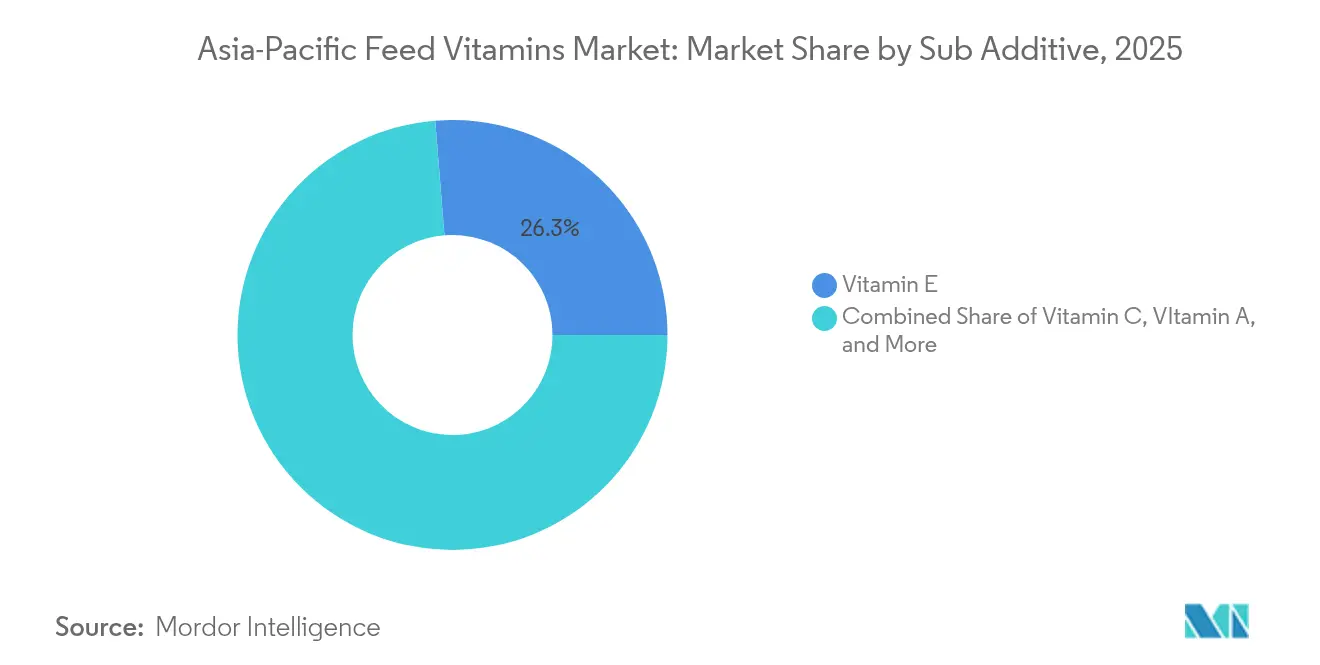
- By sub-additive, Vitamin E led with 26.28% revenue share in 2025, while Vitamin C is forecast to accelerate at a 4.32% CAGR to 2031.
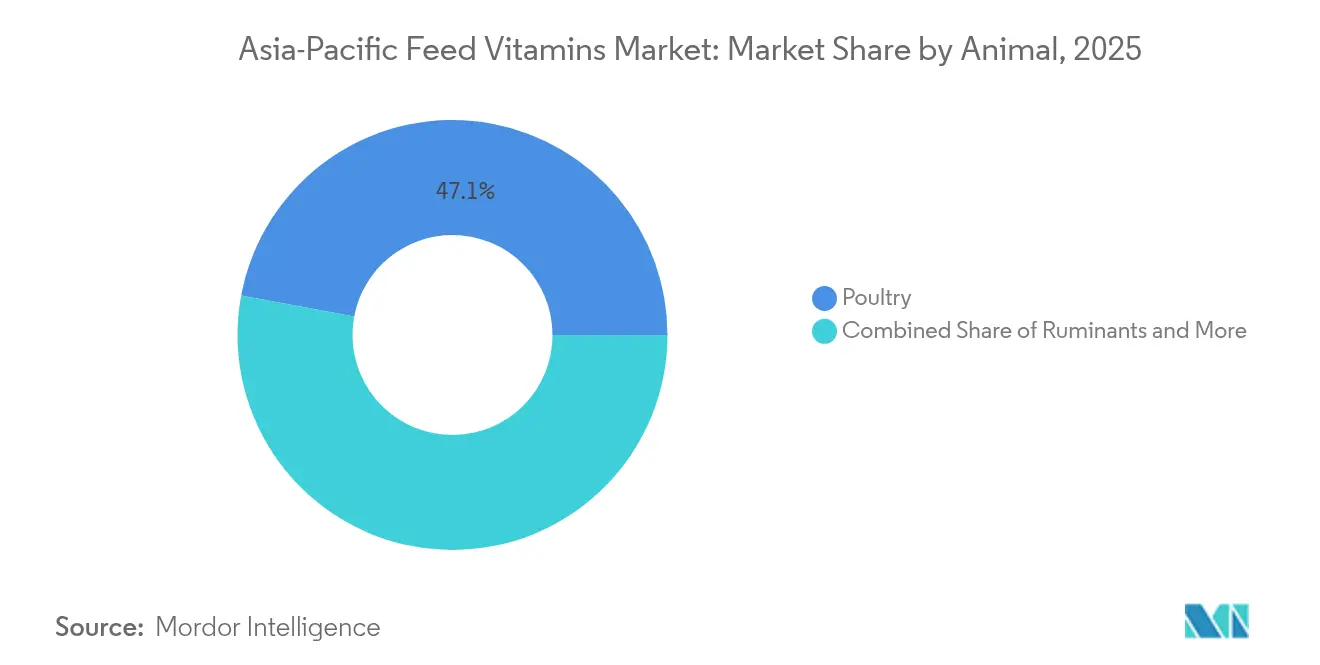
- By animal segment, poultry captured 47.05% of the Asia-Pacific feed vitamins market share in 2025, whereas the “Other Animals” category is expanding at 4.86% CAGR through 2031.
- By geography, China dominated with a 43.62% share in 2025, yet Thailand is projected to register the fastest 5.05% CAGR to 2031.
Note: Market size and forecast figures in this report are generated using Mordor Intelligence’s proprietary estimation framework, updated with the latest available data and insights as of 2026.
Asia-Pacific Feed Vitamins Market Trends and Insights
Drivers Impact Analysis*
| Driver | (~) % Impact on CAGR Forecast | Geographic Relevance | Impact Timeline |
|---|---|---|---|
| Rising poultry industrialization | +0.8% | China, India, Thailand, and Vietnam | Medium term (2-4 years) |
| Aquaculture intensification and functional diets | +0.7% | China, Indonesia, Vietnam, and Thailand | Long term (≥ 4 years) |
| Antibiotic-free production regulations | +0.6% | Australia and Japan | Short term (≤ 2 years) |
| Price volatility hedge via premix contracts | +0.4% | Core Asia-Pacific | Short term (≤ 2 years) |
| Pathogen-triggered immunity supplementation | +0.5% | Aquaculture-heavy economies | Medium term (2-4 years) |
| Carbon-footprint labeling on animal protein | +0.3% | Australia, Japan, South Korea | Long term (≥ 4 years) |
| Source: Mordor Intelligence | |||
Rising poultry industrialization
Industrial broiler complexes across Asia, led by India formalize feed protocols that embed vitamin premixes as standard practice.[1]Source: Ricky Thaper, “India’s poultry sector,” The Poultry Site, thepoultrysite.com Commercial growers adopt automated feeding that meters micro-ingredients precisely, lifting per-bird vitamin uptake and ensuring compliance with corporate sustainability audits. China’s white-feather broiler expansion and Vietnam’s chicken flock intensify oxidative stress, further elevating Vitamin E inclusion. Concentrated ownership of processing plants raises the bargaining power of integrators, so suppliers offering assured quality and traceability win multiyear supply slots. Genetic lines with faster growth curves continue to push vitamin density even higher over the coming production cycles.
Aquaculture intensification and functional diets
Dense culture magnifies oxidative damage and immunological stress, boosting demand for Vitamin C and E in functional diets. Controlled-release coatings preserve vitamin potency in water, allowing precise intake by shrimp and finfish. Trials reveal that plant-based carriers enhance bio-availability, steering formulators toward hybrid natural-synthetic blends. China’s shrimp production underscores the scale effect, making aquatic vitamins a high-volume growth node within the Asia-Pacific feed vitamins market.
Antibiotic-free production regulations
Australia and Japan now restrict prophylactic antibiotic use, compelling livestock integrators to fortify rations with immune-supporting vitamins. Vitamin A strengthens epithelial barriers, while B-complexes aid metabolic resilience under biosecurity stress. Branded vitamin solutions gain traction because certification bodies require documented nutrient programs. Multinationals harmonize procurement across regions, propagating antibiotic-free standards into emerging markets faster than local legislation alone.
Pathogen-triggered immunity supplementation
High-density aquaculture faces episodic viral and bacterial outbreaks that spark rapid increases in vitamin inclusion rates. Diagnostic tools, such as DSM-Firmenich’s Verax platform, enable producers to raise vitamin dosing in real time, creating premium niches for responsive suppliers. Seasonal pathogen maps help mills schedule inventory and avoid emergency spot buys, smoothing revenue for vitamin manufacturers.
Restraints Impact Analysis*
| Restraint | (~) % Impact on CAGR Forecast | Geographic Relevance | Impact Timeline |
|---|---|---|---|
| Vitamin A and E supply shocks (plant outages) | -0.6% | Global import-dependent markets | Short term (≤ 2 years) |
| Tariff and geopolitics–driven price swings | -0.4% | China-centric supply chains | Medium term (2-4 years) |
| Tightened maximum-residue limits (MRLs) | -0.3% | Australia, Thailand, and Vietnam | Medium term (2-4 years) |
| Growing popularity of single-step multifunctional additives reducing standalone vitamin demand | -0.5% | Japan, South Korea, and Australia | Long term (≥ 4 years) |
| Source: Mordor Intelligence | |||
Vitamin A and E supply shocks (plant outages)
The 2024 BASF fire removed critical global capacity, triggering force majeure clauses that ripple through the Asia-Pacific feed vitamins market. Limited alternate plants extend shortages into 2025, forcing reformulations or higher-cost substitutes. Buyers diversify suppliers, eroding incumbents’ volumes and compressing margins. Recovery entails complex chemical syntheses that cannot be restarted quickly, leaving a supply gap that tempers near-term market expansion.
Growing popularity of single-step multifunctional additives reducing standalone vitamin demand
Encapsulation advances blend vitamins with probiotics and enzymes, allowing mills to cut standalone vitamin lines and lower warehouse complexity. Smaller vitamin specialists risk obsolescence unless they partner or innovate. Integrated solutions shift negotiating leverage toward developers of multifunctional platforms, siphoning potential growth points away from conventional vitamin volumes within the Asia-Pacific feed vitamins market.
*Our forecasts treat driver/restraint impacts as directional, not additive. The impact forecasts reflect baseline growth, mix effects, and variable interactions.
Segment Analysis
By Sub-Additive: Vitamin E Leads Despite C’s Rapid Ascent
The Vitamin E sub-category accounted for 26.28% of the Asia-Pacific feed vitamins market size in 2025, underscoring its central role in oxidative stress management across intensive livestock systems. Robust inclusion rates in poultry and aquaculture assure volume stability even when prices fluctuate. Regulatory limits on synthetic antioxidants further protect vitamin E uptake, positioning it as a natural shelf-life stabilizer in finished feeds.
Vitamin C, while presently smaller, is advancing at a 4.32% CAGR, the fastest among sub-additives, propelled by high-density shrimp and finfish operations seeking stress resilience and collagen synthesis. Precision microencapsulation improves Vitamin C water stability, unlocking value in aquatic rations where uncoated forms leach rapidly. Vitamin B Complex finds traction in phased-feeding programs that adjust metabolic co-factors by growth stage, allowing nutritionists to fine-tune cost and performance. Specialty vitamins like biotin and choline populate premium pet and horse feeds, offering margin-rich pockets that innovative suppliers exploit to expand their Asia-Pacific feed vitamins industry footprint.


By Animal: Poultry Dominance Amid Emerging Opportunities
Poultry maintained 47.05% of the Asia-Pacific feed vitamins market share in 2025, anchored by integrated broiler chains using standard premix protocols. Genetics demanding faster weight gain elevate vitamin density, sustaining volume even as per-bird feed conversion improves. Feedmills serving layers prioritize Vitamin D and E to reinforce eggshell quality and oxidative stability, adding steady base demand.
The “Other Animals” aggregate companion pets, equines, and specialty livestock charts a 4.86% CAGR through 2031, the swiftest across species cohorts. Pet nutrition’s humanization trend supports premium pricing for chewable or liquid vitamins positioned for joint health or immunity. Aquaculture, though smaller in overall value, posts robust unit gains from expanded pond acreage and government production targets. Ruminants turn to rumen-protected Vitamin B and A to bypass microbial degradation, reflecting higher technology thresholds that reward innovators within the Asia-Pacific feed vitamins market.
Geography Analysis
China controlled 43.62% of regional revenues in 2025, pairing vast domestic consumption with an export-ready vitamin manufacturing base that benefits from economies of scale. Ongoing consultations on additive import regulations may alter access terms for foreign suppliers, yet intellectual property enforcement is improving, as seen in DSM-Firmenich’s 25-hydroxyvitamin D₃ patent actions, creating a more predictable business climate. Supply chain concentration: 75% of key nutritional intermediates remain China-sourced, and still pose geopolitical and logistics risk.
Thailand advances at a 5.05% CAGR, catalyzed by export-oriented poultry and shrimp ventures that demand traceable, premium vitamin inputs. Regulatory harmonization with Codex Alimentarius reduces non-tariff barriers for multinationals, while local players team with global peers, witnessing Cargill’s alliances to access technical know-how. Updated labeling rules, effective 2026, necessitate rapid reformulation of premixes to ensure compliance.
India brings a large poultry base output, yet vitamin penetration remains below developed-market norms, offering a sizeable volume uplift as industrial growers adopt precision feed practices. Indonesia, buoyed by public and private investment, scales shrimp ponds and drives aquatic vitamin uptake. Vietnam’s livestock shift from backyard to contract farming injects professional feed formulation and quality controls, pushing vitamin volumes upward. Japan and South Korea champion low-carbon credentials, paving the way for sustained premium vitamin imports despite modest feed tonnage, reinforcing diversified demand pillars across the Asia-Pacific feed vitamins market.
Competitive Landscape
Moderate concentration defines the playing field as the top five suppliers capture a major percentage of regional turnover, leaving headroom for specialists and regional champions. DSM-Firmenich leads by leveraging vertical integration from synthesis to digital nutrition services such as Sustell carbon analysis and Verax diagnostics.
Adisseo follows broadened by its Calysta FeedKind joint venture that inserts single-cell protein adjacency and deepens customer stickiness. BASF’s modest stake took a short-term hit after the Ludwigshafen disruption, prompting buyers to trial products from Camlin Fine Sciences and regional Chinese producers.
Barentz’s 2025 acquisition of Fengli Group strengthens distribution reach and formulation capabilities in mainland China, addressing a crucial gap for Western suppliers aiming for last-mile service. Competitive vectors now tilt toward supply assurance, digital formulation support, and sustainability credentials rather than price alone, enabling differentiated offerings to command loyalty in the Asia-Pacific feed vitamins market.
Asia-Pacific Feed Vitamins Industry Leaders
DSM–Firmenich
Adisseo (BlueStar)
BASF
Cargill, Incorporated.
Lonza Group Ltd.
- *Disclaimer: Major Players sorted in no particular order

Recent Industry Developments
- October 2025: BASF is evaluating strategic options for its feed enzymes business while maintaining its focus on core nutrition segments. The company continues to invest in feed vitamins and carotenoids to ensure market stability in the Asia-Pacific animal nutrition sector.
- August 2025: DSM-Firmenich established a new manufacturing facility in Jadcherla, India, for the production of feed vitamins. The facility enhances India's domestic supply chain for animal nutrition products while supporting market expansion in South and Southeast Asia.
- July 2024: BASF’s Ludwigshafen explosion curtailed global Vitamin A and E supply, driving 30-60% price spikes, including in the Asia-Pacific region.


Asia-Pacific Feed Vitamins Market Report Scope
Vitamin A, Vitamin B, Vitamin C, Vitamin E are covered as segments by Sub Additive. Aquaculture, Poultry, Ruminants, Swine are covered as segments by Animal. Australia, China, India, Indonesia, Japan, Philippines, South Korea, Thailand, Vietnam are covered as segments by Country.By Sub-Additive
| Vitamin A |
| Vitamin B |
| Vitamin C |
| Vitamin E |
| Other Vitamins |
By Animal
| Aquaculture | Fish |
| Shrimp | |
| Other Aquaculture Species | |
| Poultry | Broiler |
| Layer | |
| Other Poultry Birds | |
| Ruminants | Beef Cattle |
| Dairy Cattle | |
| Other Ruminants | |
| Swine | |
| Other Animals |
By Geography
| Australia |
| China |
| India |
| Indonesia |
| Japan |
| Philippines |
| South Korea |
| Thailand |
| Vietnam |
| Rest of Asia-Pacific |
| By Sub-Additive | Vitamin A | |
| Vitamin B | ||
| Vitamin C | ||
| Vitamin E | ||
| Other Vitamins | ||
| By Animal | Aquaculture | Fish |
| Shrimp | ||
| Other Aquaculture Species | ||
| Poultry | Broiler | |
| Layer | ||
| Other Poultry Birds | ||
| Ruminants | Beef Cattle | |
| Dairy Cattle | ||
| Other Ruminants | ||
| Swine | ||
| Other Animals | ||
| By Geography | Australia | |
| China | ||
| India | ||
| Indonesia | ||
| Japan | ||
| Philippines | ||
| South Korea | ||
| Thailand | ||
| Vietnam | ||
| Rest of Asia-Pacific | ||


Market Definition
- FUNCTIONS - For the study, feed additives are considered to be commercially manufactured products that are used to enhance characteristics such as weight gain, feed conversion ratio, and feed intake when fed in appropriate proportions.
- RESELLERS - Companies engaged in reselling feed additives without value addition have been excluded from the market scope, to avoid double counting.
- END CONSUMERS - Compound feed manufacturers are considered to be end-consumers in the market studied. The scope excludes farmers buying feed additives to be used directly as supplements or premixes.
- INTERNAL COMPANY CONSUMPTION - Companies engaged in the production of compound feed as well as the manufacturing of feed additives are part of the study. However, while estimating the market sizes, the internal consumption of feed additives by such companies has been excluded.
| Keyword | Definition |
|---|---|
| Feed additives | Feed additives are products used in animal nutrition for purposes of improving the quality of feed and the quality of food from animal origin, or to improve the animals’ performance and health. |
| Probiotics | Probiotics are microorganisms introduced into the body for their beneficial qualities. (It maintains or restores beneficial bacteria to the gut). |
| Antibiotics | Antibiotic is a drug that is specifically used to inhibit the growth of bacteria. |
| Prebiotics | A non-digestible food ingredient that promotes the growth of beneficial microorganisms in the intestines. |
| Antioxidants | Antioxidants are compounds that inhibit oxidation, a chemical reaction that produces free radicals. |
| Phytogenics | Phytogenics are a group of natural and non-antibiotic growth promoters derived from herbs, spices, essential oils, and oleoresins. |
| Vitamins | Vitamins are organic compounds, which are required for normal growth and maintenance of the body. |
| Metabolism | A chemical process that occurs within a living organism in order to maintain life. |
| Amino acids | Amino acids are the building blocks of proteins and play an important role in metabolic pathways. |
| Enzymes | Enzyme is a substance that acts as a catalyst to bring about a specific biochemical reaction. |
| Anti-microbial resistance | The ability of a microorganism to resist the effects of an antimicrobial agent. |
| Anti-microbial | Destroying or inhibiting the growth of microorganisms. |
| Osmotic balance | It is a process of maintaining salt and water balance across membranes within the body's fluids. |
| Bacteriocin | Bacteriocins are the toxins produced by bacteria to inhibit the growth of similar or closely related bacterial strains. |
| Biohydrogenation | It is a process that occurs in the rumen of an animal in which bacteria convert unsaturated fatty acids (USFA) to saturated fatty acids (SFA). |
| Oxidative rancidity | It is a reaction of fatty acids with oxygen, which generally causes unpleasant odors in animals. To prevent these, antioxidants were added. |
| Mycotoxicosis | Any condition or disease caused by fungal toxins, mainly due to contamination of animal feed with mycotoxins. |
| Mycotoxins | Mycotoxins are toxin compounds that are naturally produced by certain types of molds (fungi). |
| Feed Probiotics | Microbial feed supplements positively affect gastrointestinal microbial balance. |
| Probiotic yeast | Feed yeast (single-cell fungi) and other fungi used as probiotics. |
| Feed enzymes | They are used to supplement digestive enzymes in an animal’s stomach to break down food. Enzymes also ensure that meat and egg production is improved. |
| Mycotoxin detoxifiers | They are used to prevent fungal growth and to stop any harmful mold from being absorbed in the gut and blood. |
| Feed antibiotics | They are used both for the prevention and treatment of diseases but also for rapid growth and development. |
| Feed antioxidants | They are used to protect the deterioration of other feed nutrients in the feed such as fats, vitamins, pigments, and flavoring agents, thus providing nutrient security to the animals. |
| Feed phytogenics | Phytogenics are natural substances, added to livestock feed to promote growth, aid in digestion, and act as anti-microbial agents. |
| Feed vitamins | They are used to maintain the normal physiological function and normal growth and development of animals. |
| Feed flavors and sweetners | These flavors and sweeteners help to mask tastes and odors during changes in additives or medications and make them ideal for animal diets undergoing transition. |
| Feed acidifiers | Animal feed acidifiers are organic acids incorporated into the feed for nutritional or preservative purposes. Acidifiers enhance congestion and microbiological balance in the alimentary and digestive tracts of livestock. |
| Feed minerals | Feed minerals play an important role in the regular dietary requirements of animal feed. |
| Feed binders | Feed binders are the binding agents used in the manufacture of safe animal feed products. It enhances the taste of food and prolongs the storage period of the feed. |
| Key Terms | Abbreviation |
| LSDV | Lumpy Skin Disease Virus |
| ASF | African Swine Fever |
| GPA | Growth Promoter Antibiotics |
| NSP | Non-Starch Polysaccharides |
| PUFA | Polyunsaturated Fatty Acid |
| Afs | Aflatoxins |
| AGP | Antibiotic Growth Promoters |
| FAO | The Food And Agriculture Organization of the United Nations |
| USDA | The United States Department of Agriculture |


Research Methodology
Mordor Intelligence follows a four-step methodology in all our reports.
- Step-1: IDENTIFY KEY VARIABLES: In order to build a robust forecasting methodology, the variables and factors identified in Step-1 are tested against available historical market numbers. Through an iterative process, the variables required for market forecast are set and the model is built on the basis of these variables.
- Step-2: Build a Market Model: Market-size estimations for the forecast years are in nominal terms. Inflation is not a part of the pricing, and the average selling price (ASP) is kept constant throughout the forecast period.
- Step-3: Validate and Finalize: In this important step, all market numbers, variables and analyst calls are validated through an extensive network of primary research experts from the market studied. The respondents are selected across levels and functions to generate a holistic picture of the market studied.
- Step-4: Research Outputs: Syndicated Reports, Custom Consulting Assignments, Databases & Subscription Platforms


