Market Overview
| Study Period | 2017 - 2030 |
|---|---|
| Forecast Data Period | 2025 - 2030 |
| Historical Data Period | 2017 - 2023 |
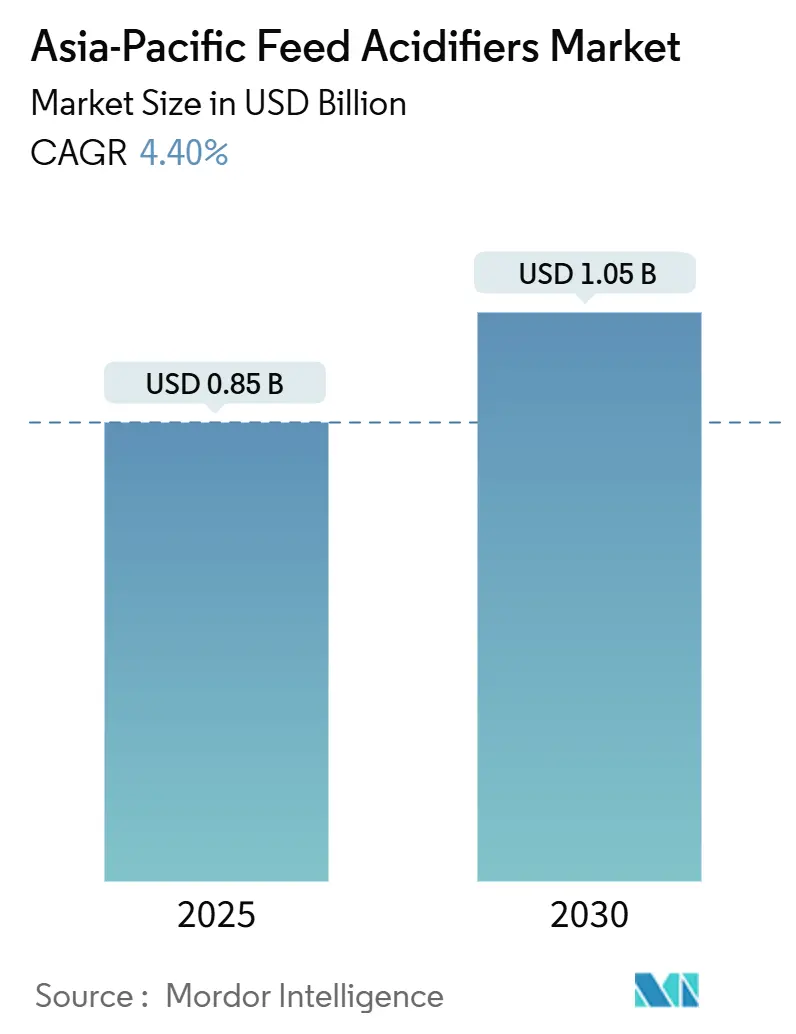
| Market Size (2025) | USD 0.85 Billion |
| Market Size (2030) | USD 1.05 Billion |
| Growth Rate (2025 - 2030) | 4.40% CAGR |
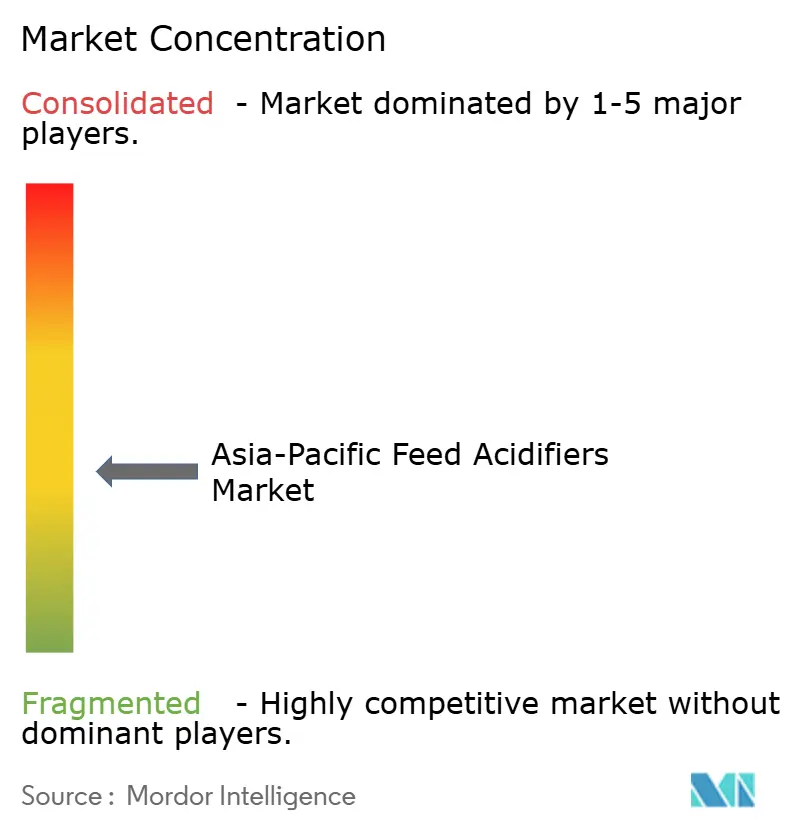
| Market Concentration | Medium |
Major Players*Disclaimer: Major Players sorted in no particular order Image © Mordor Intelligence. Reuse requires attribution under CC BY 4.0. | |
Asia-Pacific Feed Acidifiers Market Analysis by Mordor Intelligence
The Asia-Pacific feed acidifiers market size stands at USD 851.7 million in 2025 and is projected to advance at a 4.4% CAGR to reach USD 1,056.5 million by 2030. This momentum follows sweeping antibiotic-growth-promoter bans that have removed pharmacological products from livestock diets and installed organic acid blends as the default performance enhancers. Structural demand is also anchored in the region’s fast-growing compound-feed output, which supplies expanding commercial poultry and aquaculture sectors. Chinese feed manufacturers capitalize on domestic organic acid capacity to manage costs, while Indonesian producers absorb technology transfers that improve pelleting heat stability. At the same time, microencapsulation breakthroughs have lowered inclusion rates and widened the application spectrum, creating additional headroom for the Asia-Pacific feed acidifiers market to upscale. Carbon-footprint analyses showing up to 18% lower greenhouse-gas intensity than antibiotics now influence purchasing policies among multinational processors, converting sustainability requirements into tangible additive demand.
Key Report Takeaways
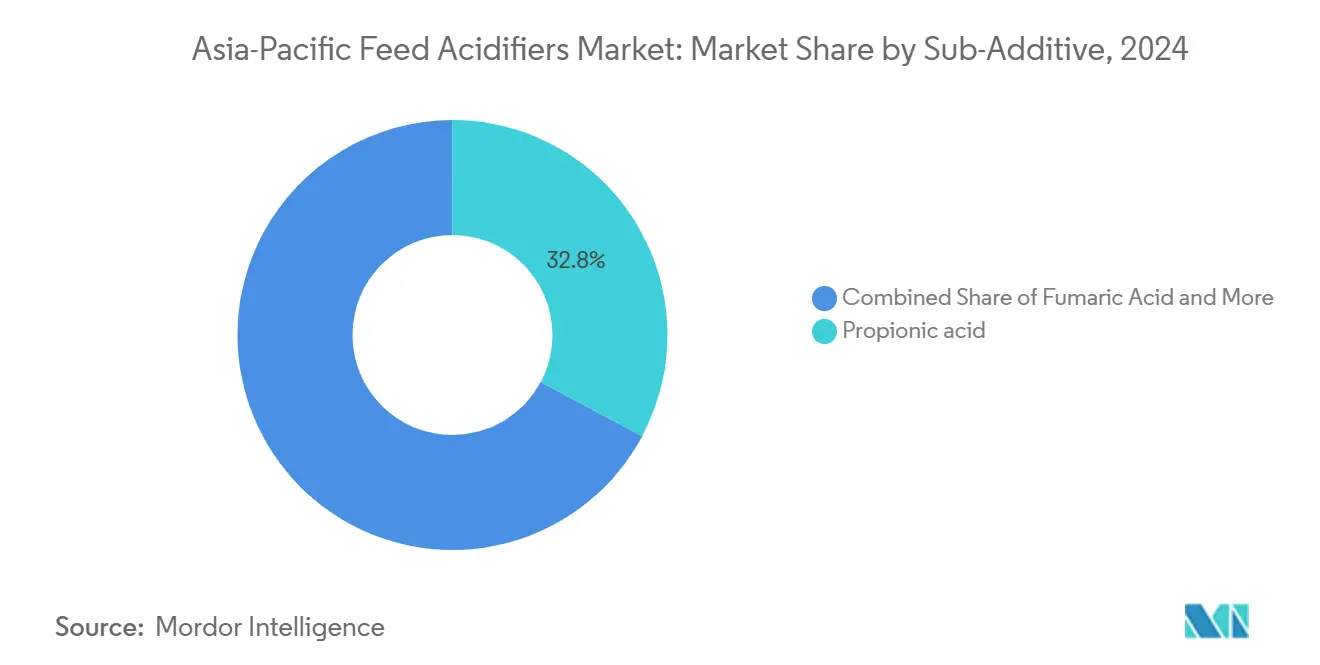
- By sub-additive, propionic acid led with 32.8% of the Asia-Pacific feed acidifiers market share in 2024, whereas fumaric acid posted the fastest 4.5% CAGR through 2030.
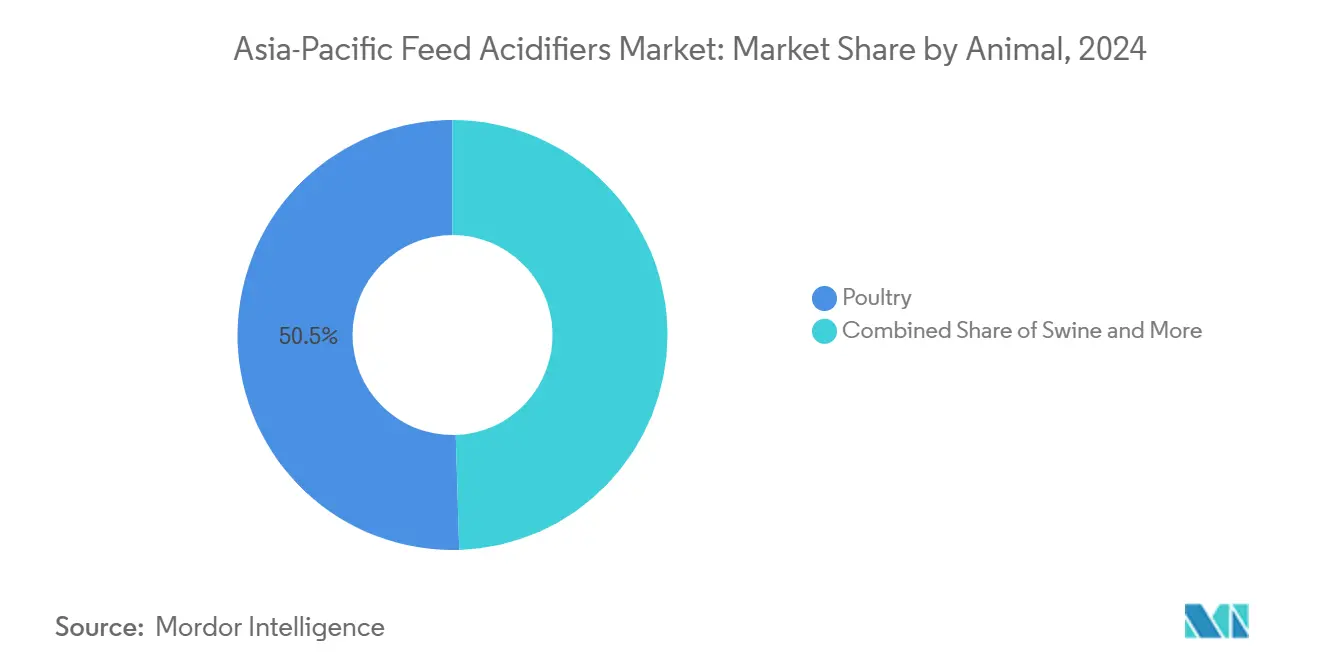
- By animal category, poultry commanded 50.5% of the Asia-Pacific feed acidifiers market share in 2024, which is forecasted to expand at a 4.9% CAGR to 2030.
- By geography, China contributed 44.2% market share to the Asia-Pacific feed acidifiers market in 2024, and Indonesia is projected to register the fastest 5.1% CAGR during the forecast period.
Asia-Pacific Feed Acidifiers Market Trends and Insights
Drivers Impact Analysis*
| Driver | (~) % Impact on CAGR Forecast | Geographic Relevance | Impact Timeline |
|---|---|---|---|
| Antibiotic growth promoters (agps) bans across key livestock producers | +1.8% | China, India, Indonesia, and Thailand | Long term (≥ 4 years) |
| Demand for meat and eggs free from residues | +1.2% | Japan, and South Korea premium channels | Medium term (2-4 years) |
| Production of compound feed sees an upward trend | +0.9% | China, India, Vietnam, and Philippines | Long term (≥ 4 years) |
| Cost-effectiveness in comparison to zinc oxide | +0.5% | Core Asia-Pacific and emerging neighbors | Short term (≤ 2 years) |
| Microencapsulation boosts heat stability | +0.4% | Region-wide pelleted-feed manufacturing hubs | Medium term (2-4 years) |
| Reduced carbon footprint in comparison to antibiotics | +0.3% | Multinational processor supply chains | Long term (≥ 4 years) |
| Source: Mordor Intelligence | |||
Antibiotic Growth Promoters (AGPs) Bans Across Key Livestock Producers
National regulators eliminated colistin and other medically important antibiotics from livestock diets in 2024, thereby cementing organic acid inclusion as non-negotiable in feed formulations. Compliance frameworks require residue-free documentation, so feed-millers have integrated propionic and lactic blends as permanent inputs rather than short-term substitutes. Thailand’s aquaculture sector already reports a 25% reduction in antibiotic use following voluntary acidifier adoption, proving that regulatory momentum translates directly into consumption volume. Because these bans also cover therapeutic indications, livestock integrators have no fallback, which entrenches growth prospects for the Asia-Pacific feed acidifiers market. Government oversight reinforces the trend by accelerating additive registrations that carry Generally Recognized as Safe status. [1]Source: USDA Foreign Agricultural Service, “Livestock and Products Annual Report,” USDA.GOV
Demand For Meat And Eggs Free From Residues
Japanese and South Korean retailers now pay 15% to 25% more for certified antibiotic-free pork and poultry. This premium compensates growers for higher additive costs and incentivizes consistent acidifier usage throughout the value chain. Export-oriented producers in Vietnam and Thailand replicate the model to secure European Union and North American orders, turning consumer willingness to pay into durable demand for acidifiers. The premium segment also shields nutritionists from commodity price swings, which stabilizes order volumes for suppliers targeting the Asia-Pacific feed acidifiers market. Corporate sustainability agendas extend the practice beyond high-end niches, embedding residue-free requirements into mainstream product lines.
Production Of Compound Feed Sees An Upward Trend
Asia-Pacific compound-feed capacity outpaces livestock population growth, reaching 260 million metric tons in China alone during 2024. Organized feed mills require precise dosing, so every new ton of pelleted feed creates predictable additive pull-through. India’s commercial feed output rises 12% annually, converting mixed-farming zones into contract-feed customers who standardize acidifier inclusion. Vietnam’s feed volumes have doubled since 2020, fueled by commercial aquaculture diets that depend on pH regulators for digestive efficiency. Large production batches allow ingredient suppliers to lock in multiyear contracts, thus derisking capital expenditure in new encapsulation lines dedicated to the Asia-Pacific feed acidifiers market.
Cost-Effectiveness In Comparison To Zinc Oxide
Regulations capping heavy-metal discharge make zinc-oxide pharmacological doses unsustainable, particularly in swine diets. Fumaric acid delivers comparable post-weaning performance at lower inclusion costs, which improves profit margins during volatile hog cycles. Chinese producers benefit from lower raw-material outlays, while Southeast Asian integrators favor acidifiers to comply with export market residue thresholds. As more feed-formulation software integrates acidifier cost data, nutritionists recognize that blend strategies are margin-accretive even when propionic prices spike. This comparative economics keeps the Asia-Pacific feed acidifiers market resilient under raw-material volatility scenarios.
Restraints Impact Analysis*
| Restraint | (~) % Impact on CAGR Forecast | Geographic Relevance | Impact Timeline |
|---|---|---|---|
| Prices of organic acids experience volatility | -0.8% | China supply hubs, import-dependent markets | Short term (≤ 2 years) |
| Feed-mill equipment faces corrosive challenges | -0.4% | Humid tropical manufacturing clusters | Medium term (2-4 years) |
| Disruptions in logistics and supply chains | -0.3% | Cross-border maritime corridors | Short term (≤ 2 years) |
| Registration processes face complications in multiple countries | -0.2% | Emerging South Asian jurisdictions | Medium term (2-4 years) |
| Source: Mordor Intelligence | |||
Prices Of Organic Acids Experience Volatility
Propionic acid prices fluctuated 15% to 20% in 2024 after energy cost shocks hit Chinese chemical hubs, complicating formulation budgets for feed producers. Fumaric acid showed similar volatility when European producers curtailed output, prompting sudden spot-market premiums in Asia. Currency shifts add a second layer of uncertainty, especially for Indonesian and Philippine importers buying in USD. Nutritionists sometimes cut inclusion rates during price spikes, which introduces performance variability that erodes end-buyer confidence. Although long-term contracts help smooth costs, persistent volatility trims 0.8 percentage points from the Asia-Pacific feed acidifiers market CAGR base case.
Feed-Mill Equipment Faces Corrosive Challenges
Organic acids attack mild-steel surfaces, forcing feed-mill operators to invest in stainless steel mixers, conveyors, and storage bins that cost 20% more than standard equipment. Even with corrosion inhibitors, annual maintenance budgets rise because tropical humidity accelerates metal fatigue. Small mills delay additive programs until they can recertify plant infrastructure, slowing penetration in price-sensitive segments. The added cost lowers near-term adoption rates, shaving 0.4% points from forecast CAGR for the Asia-Pacific feed acidifiers market. [2]Source: Feed and Grain, “Corrosion Protection in Feed Mills,” FEEDANDGRAIN.COM
*Our forecasts treat driver/restraint impacts as directional, not additive. The impact forecasts reflect baseline growth, mix effects, and variable interactions.
Segment Analysis
By Sub-Additive: Propionic Acid Anchors Revenue while Fumaric Accelerates
Propionic acid contributed 32.8% of Asia-Pacific feed acidifiers market share in 2024, while fumaric acid, which is projected to record a 4.5% CAGR to 2030, owing to its proven antimicrobial spectrum and ready availability from China’s petrochemical complexes. The segment benefits from high familiarity among nutritionists who rely on its mold-inhibition profile to protect feed in humid stores. The superior heat stability of fumaric acid allows seamless inclusion in steam-pelleted diets, reducing nutrient degradation and supporting higher gut-pH modulation in piglets.
Lactic acid retains a stable niche in aquaculture because it buffers pond-water pH and enhances gastrointestinal health in juvenile fish. Formic, citric, and multi-acid blends target cost-sensitive layers or specialty swine diets where specific pathogen challenges dictate formulation. Overall, continuous patent activity in esterified acids and encapsulated beads indicates active competition that could redistribute Asia-Pacific feed acidifiers market size across sub-additives over the forecast horizon.
Manufacturers deploy differentiation strategies oriented around synergistic blends and targeted release profiles. Kemin’s FORMYL, launched in 2024, exemplifies multiaxial innovation by integrating propionic and formic acids within a choline propionate matrix that maintains potency beyond 85 °C processing temperatures. DSM allocates USD 25 million into microencapsulation R&D facilities in Singapore and China to refine bead porosity and minimize inclusion costs.


By Animal: Poultry Sets the Pace
Poultry diets absorbed 50.5% of Asia-Pacific feed acidifiers market size in 2024, and are also the fastest growing segment with 4.9% CAGR as broiler integrators standardized organic acid blends to comply with zero-antibiotic label claims and to mitigate necrotic-enteritis risk in high-density houses. Broiler growers value rapid performance feedback, so acidifier benefits such as improved feed-conversion ratios manifest within weeks, validating inclusion economics. Layer producers adopt acidifiers to secure shell-quality consistency, extending flock productive life amid fluctuating corn quality. Swine producers deploy fumaric-rich blends to replace pharmacological zinc oxide, while ruminant adoption remains incremental because forage buffers attenuate acidifier effect in the rumen.
The segment's prominence is particularly notable in China, which produces about 130 million metric tons of compound feed for poultry, representing a significant portion of the regional production. The high market share is further supported by the increasing awareness among poultry farmers about the benefits of feed acidifiers in improving feed conversion rates, reducing pathogen colonization, and enhancing overall bird health. The segment's growth is also bolstered by the rising demand for poultry meat and eggs across the region, particularly in developing countries like India and Vietnam.
Geography Analysis
China generated 44.2% of Asia-Pacific feed acidifiers market revenue in 2024, leveraging compound-feed output that eclipses 260 million metric tons and benefits from domestic organic-acid production capacity. Indonesia is projected to clock the fastest 5.1% CAGR through 2030 as the government executes its aquaculture strategic plan aimed at doubling shrimp exports. Feed-mill consolidation raises average plant capacities, opening the door for automated dosing equipment designed for acidifiers. Infrastructure scale enables suppliers to distribute bulk liquids via rail tankers, trimming logistics costs. Regulatory support reinforces this lead because the Ministry of Agriculture fast-tracks additive approvals that carry internationally recognized safety profiles. Chinese integrators apply acidifiers across poultry, swine, and aquaculture chains, ensuring balanced demand across species and shielding suppliers from single-segment risk.
In Indonesia, lower investment thresholds entice regional mid-tier suppliers to set up local warehouses, accelerating delivery times and reducing currency-hedge expenses. In addition, halal certification bodies now accept organic acids as permissible additives, removing a regulatory ambiguity that previously deterred adoption.
India’s trajectory aligns with commercial-feed industrialization, organized feed facilities expand 12% annually, converting backyard livestock holdings into contract growers who depend on formulated diets. The 2024 antibiotic ban enforced by the Food Safety Authority has triggered a wholesale switch to organic acids for both poultry and dairy lines. Although price sensitivity remains, state governments link animal-health subsidies to documented antibiotic-free production, spurring acidifier uptake even among smallholders.
Competitive Landscape
In the Asia-Pacific feed acidifiers market, the top five vendors command a combined revenue share of around 42%, indicating a moderate concentration level. Leading the pack is DSM Nutritional Products AG, owing to its integrated supply chain that spans from bulk organic acid production to having technical service teams strategically placed in major feed-manufacturing hubs. Following closely is Cargill Inc., which adeptly utilizes its internal feed mills and warehouse network to offer acidifiers in tandem with amino acids and enzymes. Completing the top tier are Kemin, Perstorp, and Novus, each boasting unique portfolios that highlight features like microencapsulation, sustainability, or formulations tailored to specific species.
At the forefront of innovation are advancements in multi-acid synergy and the engineering of delivery matrices. In 2024, DSM Nutritional Products AG made a significant move, investing USD 25 million in Singapore, with the goal of perfecting bead architecture for pelleted feed, especially those conditioned at temperatures exceeding 90 °C. Kemin Industries’ FORMYL stands as a testament to the commercial potential of microencapsulation, ingeniously merging propionic and formic acids into a singular heat-stable particle, effectively reducing corrosiveness. Meanwhile, Perstorp is pushing boundaries with glycerol-ester derivatives, achieving both diminished odor and enhanced water solubility tailored for shrimp feeds. Regional players, capitalizing on local manufacturing cost benefits, are making inroads with mid-tier clients. They offer private-label blends at competitive prices, prompting established players to bolster their market share through enhanced after-sales analytics and on-farm troubleshooting.
Strategic partnerships are becoming a favored strategy for scaling operations without the burden of significant capital investments. In May 2024, Yenher Group forged a joint venture with Fermentationexperts A/S, establishing acid-production capabilities in Malaysia, strategically targeting Southeast Asia's aquafeed centers.As these suppliers deepen their market foothold, they are setting themselves apart with digital offerings. Services like real-time tracking of ingredient inclusion and life-cycle analysis dashboards, which highlight carbon savings from acidifier usage, are becoming standard. Such value-added services not only elevate switching costs for clients but also strengthen the bond between suppliers and customers, leading to extended contracts that ensure revenue stability in the Asia-Pacific feed acidifiers landscape. [3]Source: Kemin Industries, “FORMYL Product Launch Announcement,” KEMIN.COM
Asia-Pacific Feed Acidifiers Industry Leaders
Adisseo
BASF SE
Cargill Inc.
DSM Nutritional Products AG
SHV (Nutreco NV)
- *Disclaimer: Major Players sorted in no particular order

Recent Industry Developments
- April 2025: Clariant launched a new production line for feed additives at its Cileungsi plant, situated close to Jakarta. This line will manufacture mycotoxin binders, such as Toxisorb™, catering to the burgeoning demand in Southeast Asia's animal feed market. This move not only enhances local supply but also bolsters food safety, addressing the rising demand for safe and affordable protein.
- October 2024: De Heus inaugurated its fifth feed production facility in Purwodadi, Central Java. This expansion boosts its capacity to 15,000 metric tons per month, underscoring the company's dedication to providing local farmers with sustainable, high-quality feed products enriched with integrated additives. This move further solidifies De Heus's commitment to Indonesia's livestock sector.
- September 2024: European Protein, Yenher Group has inaugurated a new plant in Malaysia with an investment of USD 18 million. This facility will focus on producing lactic acid-fermented plant proteins, positioning them as premium feed ingredients, rather than merely isolating organic acids in their purest form.


Asia-Pacific Feed Acidifiers Market Report Scope
Sub-Additive
| Fumaric Acid |
| Lactic Acid |
| Propionic Acid |
| Other Acidifiers |
Animal
| Aquaculture | By Sub Animal | Fish |
| Shrimp | ||
| Other Aquaculture Species | ||
| Poultry | By Sub Animal | Broiler |
| Layer | ||
| Other Poultry Birds | ||
| Ruminants | By Sub Animal | Beef Cattle |
| Dairy Cattle | ||
| Other Ruminants | ||
| Swine | ||
| Other Animals |
By Country
| Australia |
| China |
| India |
| Indonesia |
| Japan |
| Philippines |
| South Korea |
| Thailand |
| Vietnam |
| Rest of Asia-Pacific |
| Sub-Additive | Fumaric Acid | ||
| Lactic Acid | |||
| Propionic Acid | |||
| Other Acidifiers | |||
| Animal | Aquaculture | By Sub Animal | Fish |
| Shrimp | |||
| Other Aquaculture Species | |||
| Poultry | By Sub Animal | Broiler | |
| Layer | |||
| Other Poultry Birds | |||
| Ruminants | By Sub Animal | Beef Cattle | |
| Dairy Cattle | |||
| Other Ruminants | |||
| Swine | |||
| Other Animals | |||
| By Country | Australia | ||
| China | |||
| India | |||
| Indonesia | |||
| Japan | |||
| Philippines | |||
| South Korea | |||
| Thailand | |||
| Vietnam | |||
| Rest of Asia-Pacific | |||


Market Definition
- FUNCTIONS - For the study, feed additives are considered to be commercially manufactured products that are used to enhance characteristics such as weight gain, feed conversion ratio, and feed intake when fed in appropriate proportions.
- RESELLERS - Companies engaged in reselling feed additives without value addition have been excluded from the market scope, to avoid double counting.
- END CONSUMERS - Compound feed manufacturers are considered to be end-consumers in the market studied. The scope excludes farmers buying feed additives to be used directly as supplements or premixes.
- INTERNAL COMPANY CONSUMPTION - Companies engaged in the production of compound feed as well as the manufacturing of feed additives are part of the study. However, while estimating the market sizes, the internal consumption of feed additives by such companies has been excluded.
| Keyword | Definition |
|---|---|
| Feed additives | Feed additives are products used in animal nutrition for purposes of improving the quality of feed and the quality of food from animal origin, or to improve the animals’ performance and health. |
| Probiotics | Probiotics are microorganisms introduced into the body for their beneficial qualities. (It maintains or restores beneficial bacteria to the gut). |
| Antibiotics | Antibiotic is a drug that is specifically used to inhibit the growth of bacteria. |
| Prebiotics | A non-digestible food ingredient that promotes the growth of beneficial microorganisms in the intestines. |
| Antioxidants | Antioxidants are compounds that inhibit oxidation, a chemical reaction that produces free radicals. |
| Phytogenics | Phytogenics are a group of natural and non-antibiotic growth promoters derived from herbs, spices, essential oils, and oleoresins. |
| Vitamins | Vitamins are organic compounds, which are required for normal growth and maintenance of the body. |
| Metabolism | A chemical process that occurs within a living organism in order to maintain life. |
| Amino acids | Amino acids are the building blocks of proteins and play an important role in metabolic pathways. |
| Enzymes | Enzyme is a substance that acts as a catalyst to bring about a specific biochemical reaction. |
| Anti-microbial resistance | The ability of a microorganism to resist the effects of an antimicrobial agent. |
| Anti-microbial | Destroying or inhibiting the growth of microorganisms. |
| Osmotic balance | It is a process of maintaining salt and water balance across membranes within the body's fluids. |
| Bacteriocin | Bacteriocins are the toxins produced by bacteria to inhibit the growth of similar or closely related bacterial strains. |
| Biohydrogenation | It is a process that occurs in the rumen of an animal in which bacteria convert unsaturated fatty acids (USFA) to saturated fatty acids (SFA). |
| Oxidative rancidity | It is a reaction of fatty acids with oxygen, which generally causes unpleasant odors in animals. To prevent these, antioxidants were added. |
| Mycotoxicosis | Any condition or disease caused by fungal toxins, mainly due to contamination of animal feed with mycotoxins. |
| Mycotoxins | Mycotoxins are toxin compounds that are naturally produced by certain types of molds (fungi). |
| Feed Probiotics | Microbial feed supplements positively affect gastrointestinal microbial balance. |
| Probiotic yeast | Feed yeast (single-cell fungi) and other fungi used as probiotics. |
| Feed enzymes | They are used to supplement digestive enzymes in an animal’s stomach to break down food. Enzymes also ensure that meat and egg production is improved. |
| Mycotoxin detoxifiers | They are used to prevent fungal growth and to stop any harmful mold from being absorbed in the gut and blood. |
| Feed antibiotics | They are used both for the prevention and treatment of diseases but also for rapid growth and development. |
| Feed antioxidants | They are used to protect the deterioration of other feed nutrients in the feed such as fats, vitamins, pigments, and flavoring agents, thus providing nutrient security to the animals. |
| Feed phytogenics | Phytogenics are natural substances, added to livestock feed to promote growth, aid in digestion, and act as anti-microbial agents. |
| Feed vitamins | They are used to maintain the normal physiological function and normal growth and development of animals. |
| Feed flavors and sweetners | These flavors and sweeteners help to mask tastes and odors during changes in additives or medications and make them ideal for animal diets undergoing transition. |
| Feed acidifiers | Animal feed acidifiers are organic acids incorporated into the feed for nutritional or preservative purposes. Acidifiers enhance congestion and microbiological balance in the alimentary and digestive tracts of livestock. |
| Feed minerals | Feed minerals play an important role in the regular dietary requirements of animal feed. |
| Feed binders | Feed binders are the binding agents used in the manufacture of safe animal feed products. It enhances the taste of food and prolongs the storage period of the feed. |
| Key Terms | Abbreviation |
| LSDV | Lumpy Skin Disease Virus |
| ASF | African Swine Fever |
| GPA | Growth Promoter Antibiotics |
| NSP | Non-Starch Polysaccharides |
| PUFA | Polyunsaturated Fatty Acid |
| Afs | Aflatoxins |
| AGP | Antibiotic Growth Promoters |
| FAO | The Food And Agriculture Organization of the United Nations |
| USDA | The United States Department of Agriculture |


Research Methodology
Mordor Intelligence follows a four-step methodology in all our reports.
- Step-1: IDENTIFY KEY VARIABLES: In order to build a robust forecasting methodology, the variables and factors identified in Step-1 are tested against available historical market numbers. Through an iterative process, the variables required for market forecast are set and the model is built on the basis of these variables.
- Step-2: Build a Market Model: Market-size estimations for the forecast years are in nominal terms. Inflation is not a part of the pricing, and the average selling price (ASP) is kept constant throughout the forecast period.
- Step-3: Validate and Finalize: In this important step, all market numbers, variables and analyst calls are validated through an extensive network of primary research experts from the market studied. The respondents are selected across levels and functions to generate a holistic picture of the market studied.
- Step-4: Research Outputs: Syndicated Reports, Custom Consulting Assignments, Databases & Subscription Platforms


