Market Overview
| Study Period | 2018 - 2031 |
|---|---|
| Forecast Data Period | 2026 - 2031 |
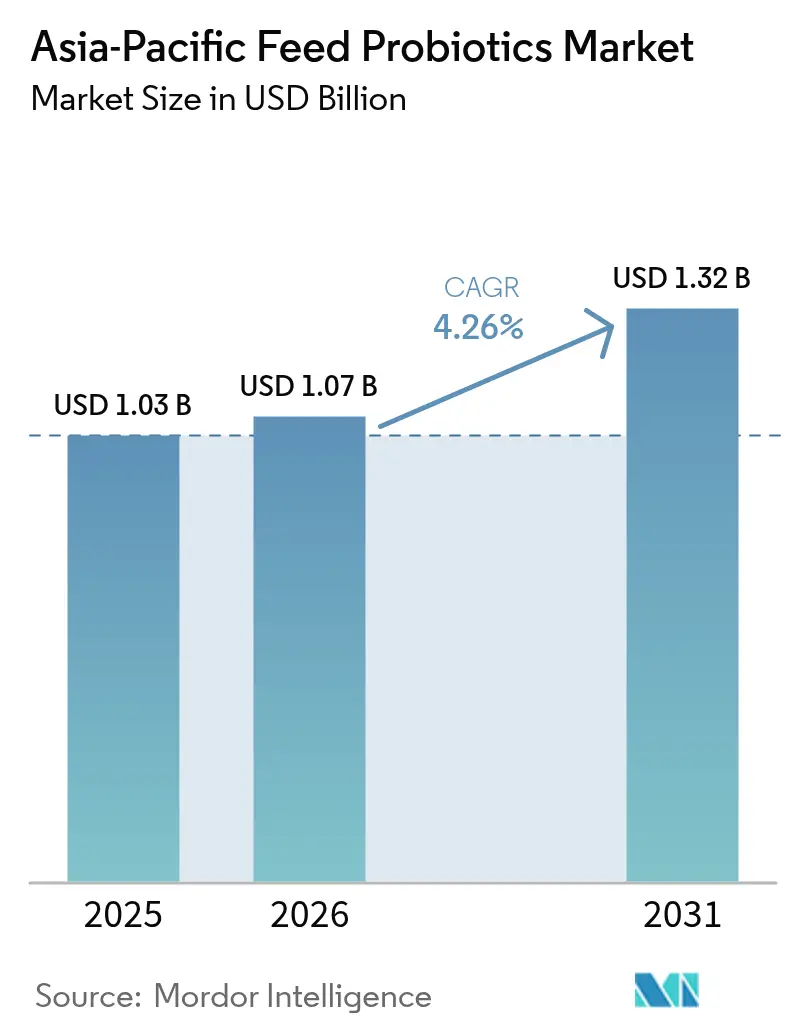
| Base Year Market Size (2025) | USD 1.03 Billion |
| Market Size (2026) | USD 1.07 Billion |
| Market Size (2031) | USD 1.32 Billion |
| Growth Rate (2026 - 2031) | 4.26% CAGR |
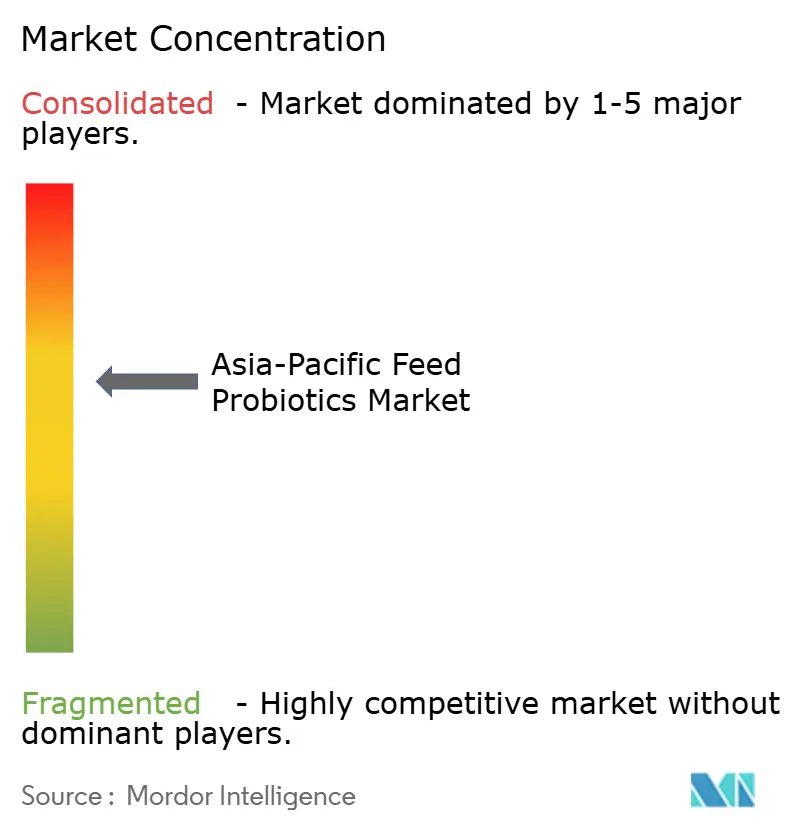
| Market Concentration | Medium |
Major Players *Disclaimer: Major Players sorted in no particular order Image © Mordor Intelligence. Reuse requires attribution under CC BY 4.0. | |
Asia-Pacific Feed Probiotics Market Analysis by Mordor Intelligence
Asia-Pacific feed probiotics market size in 2026 is estimated at USD 1.07 billion, growing from 2025 value of USD 1.03 billion with 2031 projections showing USD 1.32 billion, growing at 4.26% CAGR over 2026-2031. Growing consumer preference for antibiotic-free animal protein, stringent regional bans on antibiotic growth promoters, and falling precision-fermentation costs are accelerating the adoption of direct-fed microbials across poultry, aquaculture, and ruminant supply chains. Integrated producers in China, India, and Thailand are embedding probiotics directly into compound feeds to secure consistent dosing and to shorten withdrawal periods, while rapid intensification of aquaculture in Indonesia and Vietnam is spurring demand for water-stable formulations that remain viable in high-salinity environments. Suppliers that can prove strain performance in humid tropical logistics win share because spore-forming variants retain colony counts far better than conventional strains. Competitive dynamics favor multinationals that combine regional manufacturing footprints with global strain libraries, yet local champions still find room in indigenous species niches where multinational portfolios are thin.
Key Report Takeaways
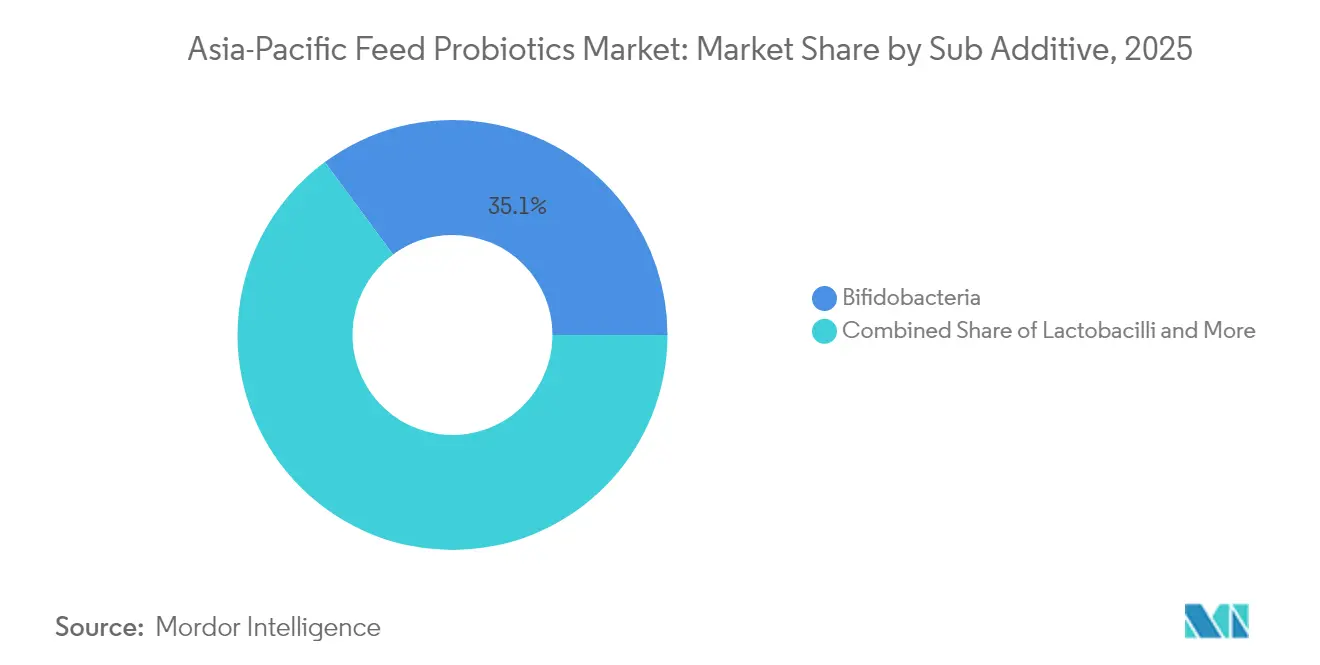
- By sub-additive category, Bifidobacteria captured 35.12% of the Asia-Pacific feed probiotics market share in 2025, whereas Streptococcus is projected to expand at a 4.11% CAGR through 2031.
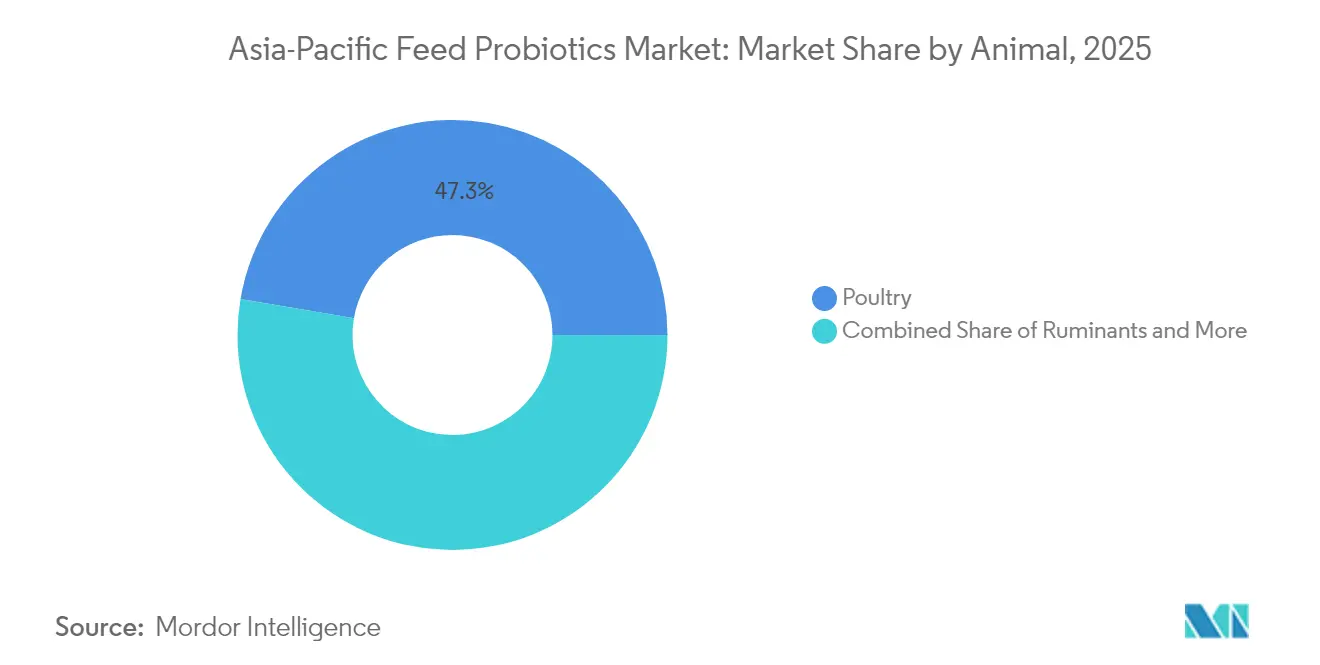
- By animal application, poultry held 47.32% of the Asia-Pacific feed probiotics market size in 2025, while aquaculture is forecast to grow at a 4.67% CAGR to 2031.
- By country, China led with 43.25% revenue share in 2025, whereas Japan is advancing at a 4.86% CAGR through 2031.
Note: Market size and forecast figures in this report are generated using Mordor Intelligence’s proprietary estimation framework, updated with the latest available data and insights as of 2026.
Asia-Pacific Feed Probiotics Market Trends and Insights
Drivers Impact Analysis*
| Driver | (~) % Impact on CAGR Forecast | Geographic Relevance | Impact Timeline |
|---|---|---|---|
| Antibiotic-Free Meat Demand Surge | +1.8% | China, Southeast Asia core markets | Short term (≤ 2 years) |
| Rapid Growth of Aquaculture in Southeast Asia | +2.1% | Indonesia, Thailand, Vietnam, Philippines | Medium term (2-4 years) |
| Large Poultry Integrators Adopting Direct-fed Microbials | +1.5% | China, India, and Thailand primary adoption | Short term (≤ 2 years) |
| Government Ban on Antibiotic growth promoters (AGPs) in China and Vietnam | +1.2% | China and Vietnam, spillover to the Asia-Pacific | Medium term (2-4 years) |
| Precision-fermentation Cost Declines | +0.9% | Regional manufacturing hubs | Long term (≥ 4 years) |
| On-farm Microbiome Analytics Adoption | +0.7% | Advanced markets: China, Japan, Australia | Long term (≥ 4 years) |
| Source: Mordor Intelligence | |||


Antibiotic-Free Meat Demand Surge
Consumer-driven antibiotic-free mandates from major quick-service restaurant chains and retail grocers are accelerating probiotic inclusion rates across Asia-Pacific livestock operations. McDonald's Asia-Pacific division expanded its antibiotic-free chicken sourcing to 12 additional markets in 2024, creating immediate demand for probiotic alternatives among contract suppliers. This retail pressure translates into premium pricing opportunities for producers who can demonstrate antibiotic-free credentials through third-party verification systems. The trend gains particular momentum in urban markets where consumer willingness to pay premiums for health-conscious protein sources reaches 15-25% above conventional alternatives. Regulatory compliance frameworks like China's National Food Safety Standard GB 31650 provide standardized pathways for probiotic validation in antibiotic-free production systems [1]Source: Ministry of Agriculture and Rural Affairs of the People’s Republic of China, “Feed Additive Regulations,” moa.gov.cn. The transition requires 6-12 month adjustment periods as livestock adapt to new feeding regimens, creating temporary supply constraints that benefit early adopters with established probiotic protocols.
Rapid Growth of Aquaculture in Southeast Asia
Southeast Asian aquaculture expansion drives specialized probiotic demand as intensive farming practices stress fish and shrimp immune systems beyond conventional management approaches. Indonesia's shrimp production capacity increased 22% in 2024, with new intensive farms requiring water-stable probiotic formulations that maintain colony viability in high-salinity environments. Thailand's tilapia sector demonstrates similar growth patterns, where probiotic adoption reduces mortality rates by 12-18% compared to antibiotic-dependent systems. The aquaculture segment benefits from species-specific probiotic strains that address unique digestive and immune challenges in marine environments[2]Source: Indonesian Ministry of Marine Affairs and Fisheries, “2024 Shrimp Aquaculture Statistics,” indonesiammaf.go.id. Vietnam's Mekong Delta region has emerged as a testing ground for next-generation aquaculture probiotics, with local research institutes collaborating on strain development programs. Regulatory frameworks remain fragmented across Asian markets, but harmonization efforts through the Asian+3 Field Crop Research and Development Program are establishing common standards for aquaculture probiotic approval processes.
Large Poultry Integrators Adopting Direct-fed Microbials
Vertical integration strategies among Asia-Pacific poultry producers create economies of scale that favor systematic probiotic adoption over ad-hoc supplementation approaches. CP Foods Thailand implemented company-wide probiotic protocols across 450 contract farms in 2024, standardizing multi-strain formulations that reduce feed conversion ratios by 3-5%. This integrator-led adoption model accelerates market penetration by eliminating individual farmer decision-making bottlenecks that typically slow new technology uptake. Chinese integrators like New Hope Group leverage their feed manufacturing capabilities to embed probiotics directly into compound feeds, ensuring consistent dosing and reducing handling complexity for farm operators. The integration approach also enables data collection on probiotic efficacy across diverse production environments, creating feedback loops that inform strain selection and dosing optimization. Integrator consolidation limits supplier diversity, as major players prefer long-term partnerships with established probiotic manufacturers who can guarantee consistent supply and technical support.
Government Ban on AGPs in China and Vietnam
Regulatory prohibition of antibiotic growth promoters creates mandatory substitution demand that fundamentally reshapes feed additive markets across Asia-Pacific's largest livestock economies. China's complete AGP (antibiotics as growth promoters) phase-out, finalized in 2020 but enforced more rigorously since 2024, eliminates low-cost growth enhancement options and forces producers toward probiotic alternatives. Vietnam's parallel restrictions, implemented through Circular 01/2024/TT-MARD, extend similar requirements to aquaculture operations where antibiotic resistance concerns have reached critical levels. These regulatory changes create captive demand for probiotic solutions, but also intensify price competition as producers seek cost-effective alternatives to banned substances. The transition period reveals infrastructure gaps in probiotic distribution networks, particularly in rural areas where cold-chain storage requirements challenge traditional feed supply systems. Enforcement mechanisms vary significantly between provinces and countries, creating compliance arbitrage opportunities that benefit producers in strictly regulated jurisdictions while disadvantaging those in markets with inconsistent oversight.
Restraints Impact Analysis*
| Restraint | (~) % Impact on CAGR Forecast | Geographic Relevance | Impact Timeline |
|---|---|---|---|
| High Product Price Differential vs. Antibiotics | -1.2% | Price-sensitive markets across Asia-Pacific | Short term (≤ 2 years) |
| Short Shelf-life in Humid Tropical Supply Chains | -0.8% | Southeast Asia, tropical regions | Medium term (2-4 years) |
| Inconsistent Regulatory Approval Process Across Asia-Pacific | -0.6% | Asia-Pacific markets, regulatory fragmentation | Long term (≥ 4 years) |
| Limited Clinical Validation in Indigenous Species | -0.4% | Local species applications | Long term (≥ 4 years) |
| Source: Mordor Intelligence | |||
High Product Price Differential vs. Antibiotics
Cost premiums of 2-3 times conventional antibiotic growth promoters create adoption barriers among price-sensitive livestock producers, particularly in markets where regulatory enforcement remains inconsistent. Small-scale poultry operations in rural Philippines and Indonesia continue using banned substances due to immediate cost advantages, despite long-term sustainability risks. This price differential becomes more pronounced during periods of feed ingredient inflation, when producers prioritize short-term cost control over long-term performance benefits. The gap is narrowing as antibiotic prices increase due to regulatory restrictions and probiotic costs decline through improved manufacturing efficiency. Premium pricing also reflects the value-added benefits of probiotic supplementation, including improved feed conversion, reduced mortality, and enhanced product quality that can justify higher input costs for commercially sophisticated operations.
Short Shelf-life in Humid Tropical Supply Chains
Tropical climate conditions across Southeast Asia reduce probiotic viability by 30-50% compared to temperate storage environments, creating efficacy concerns and product returns that discourage adoption. High humidity and temperature fluctuations during transportation and storage compromise colony counts, particularly for non-spore-forming strains that dominate current market offerings. Cold-chain infrastructure limitations in rural areas exacerbate these challenges, as many feed distributors lack refrigerated storage capabilities required for optimal probiotic preservation. Packaging innovations, including moisture-resistant barriers and desiccant systems, provide partial solutions but add 10-15% to product costs [3]Source: Applied and Environmental Microbiology, “Effect of Humidity on Probiotic Viability,” asm.org. The shelf-life challenge creates competitive advantages for spore-forming probiotic strains that demonstrate superior stability in harsh environmental conditions, though these products typically command premium pricing that limits adoption among cost-sensitive producers.
*Our forecasts treat driver/restraint impacts as directional, not additive. The impact forecasts reflect baseline growth, mix effects, and variable interactions.
Segment Analysis
By Sub Additive: Bifidobacteria Dominance Faces Specialized Competition
Bifidobacteria have emerged as both the dominant and fastest-growing segment in the Asia-Pacific feed probiotics market, holding approximately 35.12% market share by value in 2025. The segment's prominence can be attributed to its antimicrobial properties, which effectively inhibit the growth of harmful microorganisms in the gastrointestinal tract of animals.
Poultry birds represent the largest consumers of bifidobacteria in the region, with popular species including Bifidobacteria longum, Bifidobacteria breve, and Bifidobacteria infantis. The segment's growth is particularly strong in China, which accounts for a significant portion of the regional consumption due to its large livestock population. The segment is projected to maintain its leadership position with an estimated CAGR of around 4.32% through 2031, driven by an increasing livestock population, rising demand for meat and seafood, and growing awareness about the benefits of healthy animal diets in determining animal productivity.


By Animal: Poultry Segment holds largest share in Asia-Pacific feed probiotics market
The poultry segment dominates the Asia-Pacific animal feed probiotics market, commanding approximately 47.32% of the market share in 2025, with a 4.12% CAGR through 2031. This substantial market presence is primarily driven by the segment's extensive use of feed bacteria in both broiler and layer farming operations. The segment's prominence is attributed to the rising demand for poultry meat and eggs across the region, coupled with the expanding industrial poultry farms.
The effectiveness of probiotics in enhancing growth performance, improving feed conversion efficiency, and strengthening the immune system of poultry birds has made them an essential component in modern poultry farming. Within the poultry segment, broilers constitute the largest sub-segment, followed by layers, reflecting the region's robust meat production sector. The segment's growth is further supported by increasing awareness among farmers about the benefits of probiotics in maintaining gut health and improving overall bird performance.
Geography Analysis
China has established itself as the dominant force in the Asia-Pacific feed probiotics market, commanding approximately 43.25% of the total market value in 2025. The country's market leadership is primarily driven by its massive livestock population and substantial feed production capabilities. The presence of a large swine population has been a crucial factor in driving animal probiotics demand. The market is characterized by a strong preference for bifidobacteria and lactobacilli probiotics, which are extensively used in swine and poultry feed applications. The poultry segment represents the largest end-user sector, accounting for a significant portion of probiotics consumption, followed closely by the swine segment.
Japan's emergence as the fastest-growing market at 4.86% CAGR through 2031. The country's market is characterized by its sophisticated approach to animal nutrition and strong emphasis on quality feed additives. The poultry segment dominates the Japanese market, with a particular focus on broiler and layer farming operations. Japanese farmers have shown increasing preference for scientifically proven probiotic strains, particularly lactobacilli and bifidobacteria, which are valued for their ability to enhance feed efficiency and animal health. The country's strict regulatory framework and high standards for feed additives have fostered the development of high-quality probiotic products. The market has also benefited from ongoing research and development activities, leading to the introduction of innovative probiotic solutions. The increasing focus on reducing antibiotic usage in animal feed has further accelerated the adoption of probiotics as natural alternatives.
Southeast Asian markets including Indonesia, Thailand, Vietnam, and Philippines, demonstrate coordinated growth patterns driven by Asian regulatory harmonization efforts and cross-border technology transfer initiatives. Indonesia's aquaculture expansion creates specialized demand for marine-adapted probiotic strains, while Thailand's integrated poultry operations provide scale economies for systematic adoption programs. Vietnam's regulatory alignment with Chinese standards facilitates technology transfer and reduces approval complexity for multinational suppliers.
Competitive Landscape
The Asia-Pacific feed probiotics market exhibits moderate concentration, with the top players including DSM-Firmenich, Evonik Industries AG, Adisseo, Cargill Inc., and IFF(Danisco Animal Nutrition). The competitive dynamics favor companies with integrated fermentation capabilities and regulatory expertise across multiple jurisdictions, as product approval complexity increases with market sophistication.
Multinational players leverage global research and development resources to develop platform technologies that can be adapted for regional applications, while local champions like Guangdong VTR Bio-Tech and Qingdao Vland exploit cost advantages and indigenous species expertise to capture specialized segments. Strategic patterns reveal increasing focus on vertical integration and technology partnerships that combine strain development with application expertise. Companies pursue acquisition strategies to access complementary technologies or regional market presence, as demonstrated by DSM's Biomin integration and Novonesis's formation through the Chr. Hansen-Novozymes merger.
Opportunities exist in specialized applications like indigenous aquaculture species and traditional livestock breeds that require customized strain development. Emerging disruptors leverage precision fermentation technologies and data analytics to develop evidence-based dosing protocols that improve efficacy while reducing costs. Technology adoption patterns favor companies that can demonstrate measurable performance benefits through on-farm trials and third-party validation studies, creating competitive advantages for suppliers with robust technical support capabilities.
Asia-Pacific Feed Probiotics Industry Leaders
Adisseo
Cargill Inc.
Evonik Industries AG
IFF(Danisco Animal Nutrition)
DSM-Firmenich
- *Disclaimer: Major Players sorted in no particular order

Recent Industry Developments
- September 2022: The partnership between Evonik and BASF allowed Evonik certain non-exclusive licensing rights to OpteinicsTM, a digital solution to improve comprehension and reduce the environmental impact of the animal protein and feed industries.
- July 2022: Kemin Industries has introduced Enterosure probiotic products to control the growth of pathogenic bacteria in poultry and livestock.
- January 2022: Orffa has expanded its presence in South Korea and Turkey to provide new and science-based specialty feed solutions to the animal feed industry.


Asia-Pacific Feed Probiotics Market Report Scope
Bifidobacteria, Enterococcus, Lactobacilli, Pediococcus, Streptococcus are covered as segments by Sub Additive. Aquaculture, Poultry, Ruminants, Swine are covered as segments by Animal. Australia, China, India, Indonesia, Japan, Philippines, South Korea, Thailand, Vietnam are covered as segments by Country.Sub Additive
| Bifidobacteria |
| Enterococcus |
| Lactobacilli |
| Pediococcus |
| Streptococcus |
| Other Probiotics |
By Animal
| Aquaculture | By Sub Animal | Fish |
| Shrimp | ||
| Other Aquaculture Species | ||
| Poultry | By Sub Animal | Broiler |
| Layer | ||
| Other Poultry Birds | ||
| Ruminants | By Sub Animal | Beef Cattle |
| Dairy Cattle | ||
| Other Ruminants | ||
| Swine | ||
| Other Animals |
By Country
| Australia |
| China |
| India |
| Indonesia |
| Japan |
| Philippines |
| South Korea |
| Thailand |
| Vietnam |
| Rest of Asia-Pacific |
| Sub Additive | Bifidobacteria | ||
| Enterococcus | |||
| Lactobacilli | |||
| Pediococcus | |||
| Streptococcus | |||
| Other Probiotics | |||
| By Animal | Aquaculture | By Sub Animal | Fish |
| Shrimp | |||
| Other Aquaculture Species | |||
| Poultry | By Sub Animal | Broiler | |
| Layer | |||
| Other Poultry Birds | |||
| Ruminants | By Sub Animal | Beef Cattle | |
| Dairy Cattle | |||
| Other Ruminants | |||
| Swine | |||
| Other Animals | |||
| By Country | Australia | ||
| China | |||
| India | |||
| Indonesia | |||
| Japan | |||
| Philippines | |||
| South Korea | |||
| Thailand | |||
| Vietnam | |||
| Rest of Asia-Pacific | |||


Market Definition
- FUNCTIONS - For the study, feed additives are considered to be commercially manufactured products that are used to enhance characteristics such as weight gain, feed conversion ratio, and feed intake when fed in appropriate proportions.
- RESELLERS - Companies engaged in reselling feed additives without value addition have been excluded from the market scope, to avoid double counting.
- END CONSUMERS - Compound feed manufacturers are considered to be end-consumers in the market studied. The scope excludes farmers buying feed additives to be used directly as supplements or premixes.
- INTERNAL COMPANY CONSUMPTION - Companies engaged in the production of compound feed as well as the manufacturing of feed additives are part of the study. However, while estimating the market sizes, the internal consumption of feed additives by such companies has been excluded.
| Keyword | Definition |
|---|---|
| Feed additives | Feed additives are products used in animal nutrition for purposes of improving the quality of feed and the quality of food from animal origin, or to improve the animals’ performance and health. |
| Probiotics | Probiotics are microorganisms introduced into the body for their beneficial qualities. (It maintains or restores beneficial bacteria to the gut). |
| Antibiotics | Antibiotic is a drug that is specifically used to inhibit the growth of bacteria. |
| Prebiotics | A non-digestible food ingredient that promotes the growth of beneficial microorganisms in the intestines. |
| Antioxidants | Antioxidants are compounds that inhibit oxidation, a chemical reaction that produces free radicals. |
| Phytogenics | Phytogenics are a group of natural and non-antibiotic growth promoters derived from herbs, spices, essential oils, and oleoresins. |
| Vitamins | Vitamins are organic compounds, which are required for normal growth and maintenance of the body. |
| Metabolism | A chemical process that occurs within a living organism in order to maintain life. |
| Amino acids | Amino acids are the building blocks of proteins and play an important role in metabolic pathways. |
| Enzymes | Enzyme is a substance that acts as a catalyst to bring about a specific biochemical reaction. |
| Anti-microbial resistance | The ability of a microorganism to resist the effects of an antimicrobial agent. |
| Anti-microbial | Destroying or inhibiting the growth of microorganisms. |
| Osmotic balance | It is a process of maintaining salt and water balance across membranes within the body's fluids. |
| Bacteriocin | Bacteriocins are the toxins produced by bacteria to inhibit the growth of similar or closely related bacterial strains. |
| Biohydrogenation | It is a process that occurs in the rumen of an animal in which bacteria convert unsaturated fatty acids (USFA) to saturated fatty acids (SFA). |
| Oxidative rancidity | It is a reaction of fatty acids with oxygen, which generally causes unpleasant odors in animals. To prevent these, antioxidants were added. |
| Mycotoxicosis | Any condition or disease caused by fungal toxins, mainly due to contamination of animal feed with mycotoxins. |
| Mycotoxins | Mycotoxins are toxin compounds that are naturally produced by certain types of molds (fungi). |
| Feed Probiotics | Microbial feed supplements positively affect gastrointestinal microbial balance. |
| Probiotic yeast | Feed yeast (single-cell fungi) and other fungi used as probiotics. |
| Feed enzymes | They are used to supplement digestive enzymes in an animal’s stomach to break down food. Enzymes also ensure that meat and egg production is improved. |
| Mycotoxin detoxifiers | They are used to prevent fungal growth and to stop any harmful mold from being absorbed in the gut and blood. |
| Feed antibiotics | They are used both for the prevention and treatment of diseases but also for rapid growth and development. |
| Feed antioxidants | They are used to protect the deterioration of other feed nutrients in the feed such as fats, vitamins, pigments, and flavoring agents, thus providing nutrient security to the animals. |
| Feed phytogenics | Phytogenics are natural substances, added to livestock feed to promote growth, aid in digestion, and act as anti-microbial agents. |
| Feed vitamins | They are used to maintain the normal physiological function and normal growth and development of animals. |
| Feed flavors and sweetners | These flavors and sweeteners help to mask tastes and odors during changes in additives or medications and make them ideal for animal diets undergoing transition. |
| Feed acidifiers | Animal feed acidifiers are organic acids incorporated into the feed for nutritional or preservative purposes. Acidifiers enhance congestion and microbiological balance in the alimentary and digestive tracts of livestock. |
| Feed minerals | Feed minerals play an important role in the regular dietary requirements of animal feed. |
| Feed binders | Feed binders are the binding agents used in the manufacture of safe animal feed products. It enhances the taste of food and prolongs the storage period of the feed. |
| Key Terms | Abbreviation |
| LSDV | Lumpy Skin Disease Virus |
| ASF | African Swine Fever |
| GPA | Growth Promoter Antibiotics |
| NSP | Non-Starch Polysaccharides |
| PUFA | Polyunsaturated Fatty Acid |
| Afs | Aflatoxins |
| AGP | Antibiotic Growth Promoters |
| FAO | The Food And Agriculture Organization of the United Nations |
| USDA | The United States Department of Agriculture |


Research Methodology
Mordor Intelligence follows a four-step methodology in all our reports.
- Step-1: IDENTIFY KEY VARIABLES: In order to build a robust forecasting methodology, the variables and factors identified in Step-1 are tested against available historical market numbers. Through an iterative process, the variables required for market forecast are set and the model is built on the basis of these variables.
- Step-2: Build a Market Model: Market-size estimations for the forecast years are in nominal terms. Inflation is not a part of the pricing, and the average selling price (ASP) is kept constant throughout the forecast period.
- Step-3: Validate and Finalize: In this important step, all market numbers, variables and analyst calls are validated through an extensive network of primary research experts from the market studied. The respondents are selected across levels and functions to generate a holistic picture of the market studied.
- Step-4: Research Outputs: Syndicated Reports, Custom Consulting Assignments, Databases & Subscription Platforms


