
Market Overview
| Study Period | 2020 - 2031 |
|---|---|
| Forecast Data Period | 2026 - 2031 |
| Base Year Market Size (2025) | USD 2.84 Billion |
| Market Size (2026) | USD 3.08 Billion |
| Market Size (2031) | USD 4.61 Billion |
| Growth Rate (2026 - 2031) | 8.38 % |
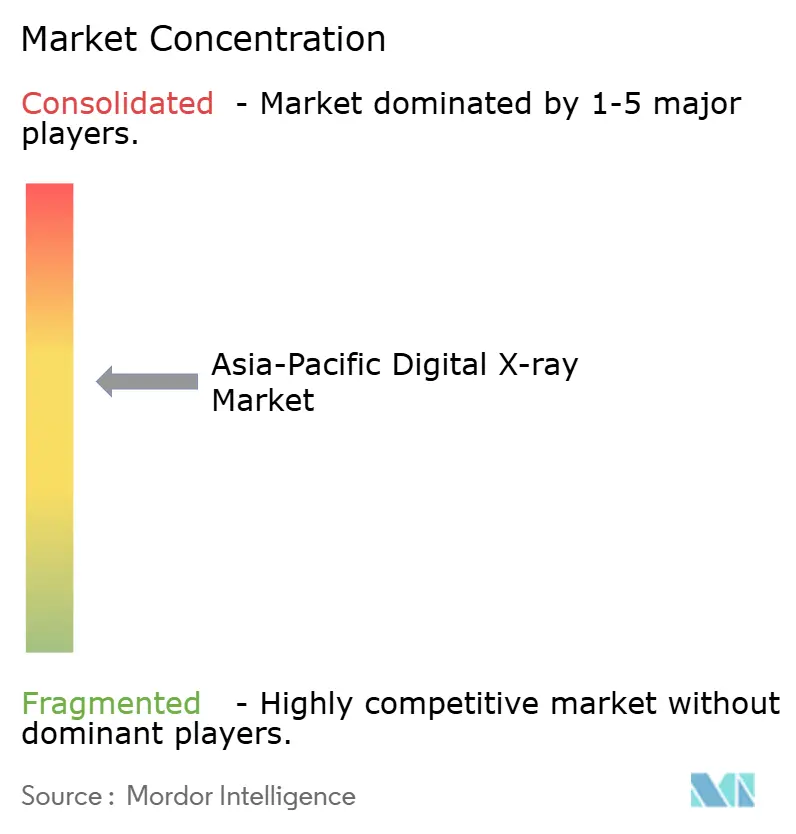
| Market Concentration | Medium |
Major Players *Disclaimer: Major Players sorted in no particular order Image © Mordor Intelligence. Reuse requires attribution under CC BY 4.0. | |
Asia-Pacific Digital X-ray Market Analysis by Mordor Intelligence
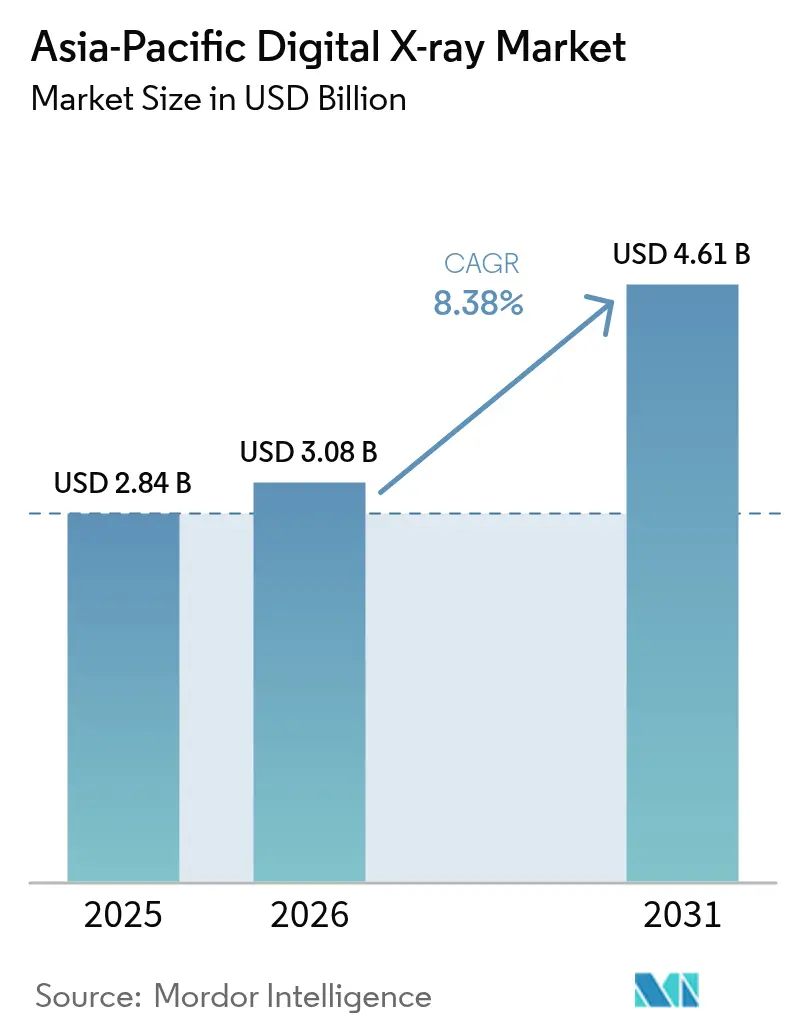
The Asia Pacific digital X-ray market size was valued at USD 2.84 billion in 2025 and estimated to grow from USD 3.08 billion in 2026 to reach USD 4.61 billion by 2031, at a CAGR of 8.38% during the forecast period (2026-2031). Accelerating hospital digitization, fiscal stimulus for medical‐equipment upgrades, and a rapidly aging population fuel demand for dose-efficient imaging systems. China’s RMB 1 trillion package earmarked for device modernization lifted procurement volumes across provincial hospitals. Parallelly, AI-enabled dose-reduction algorithms now cut radiation exposure by up to 70%, broadening pediatric and preventive-care use cases. Local manufacturing mandates in China, India, and Indonesia nurture domestic detector producers, compressing price points and reshaping the competitive order. Finally, 5G-linked teleradiology hubs connect rural clinics to metropolitan specialists, unlocking latent demand across island and border regions.
Key Report Takeaways
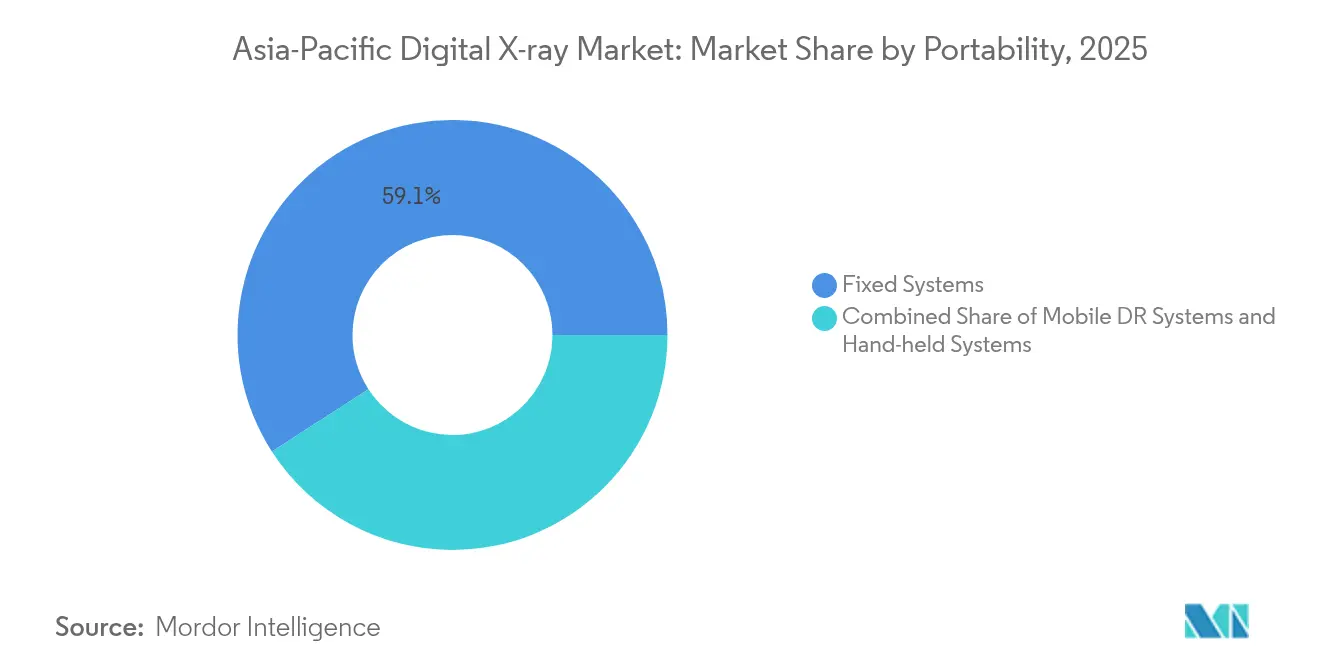
- By portability, fixed systems led with a 59.12% revenue share in 2025; hand-held units are forecast to expand at a 12.7% CAGR through 2031.
- By detector panel, amorphous silicon held 47.05% of the Asia Pacific digital X-ray market share in 2025, while IGZO/flexible panels are projected to advance at a 12.25% CAGR to 2031.
- By application, orthopedic imaging commanded 29.34% of the Asia Pacific digital X-ray market size in 2025 and is expected to grow at 6.85% CAGR through 2031.
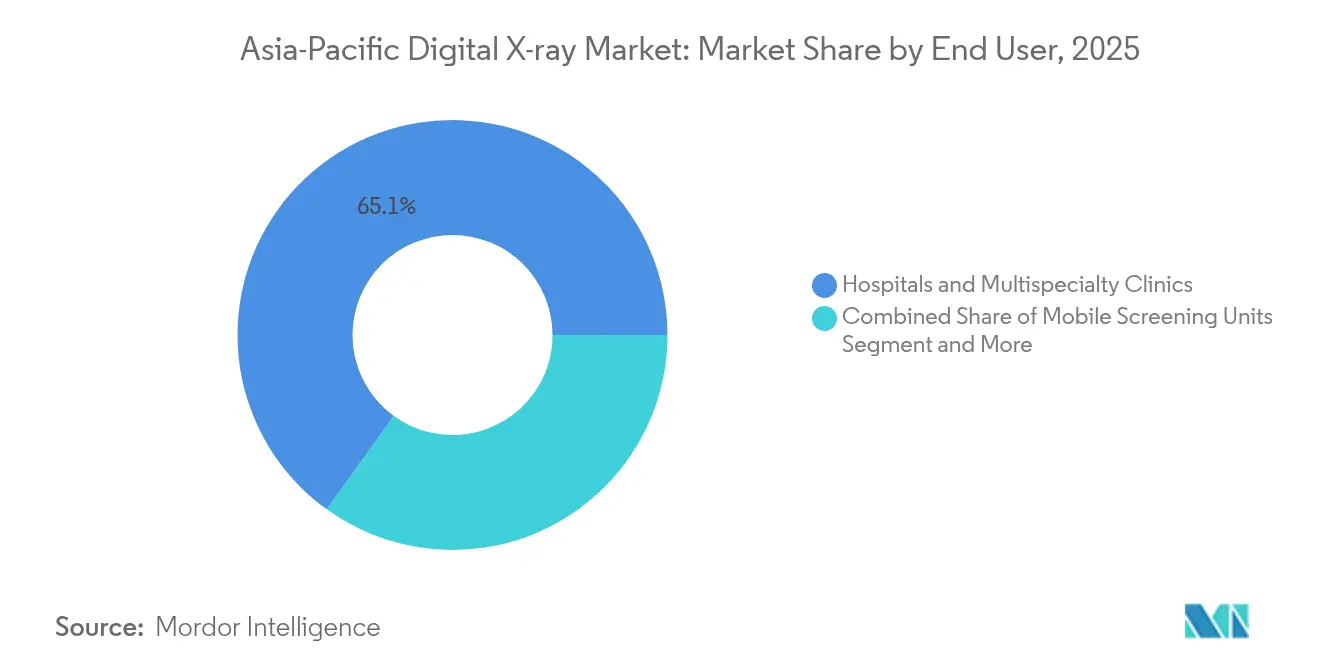
- Hospitals and multispecialty clinics accounted for 65.05% of the Asia Pacific digital X-ray market share in 2025; mobile screening units will register the highest CAGR at 12.05% over 2026-2031.
- China dominated with 39.20% revenue share in 2025, whereas India is poised for the fastest 9.85% CAGR to 2031.
Note: Market size and forecast figures in this report are generated using Mordor Intelligence’s proprietary estimation framework, updated with the latest available data and insights as of 2026.
Market Trends and Insights
Drivers Impact Analysis of Asia-Pacific Digital X-ray Market*
| Driver | (~) % Impact on CAGR Forecast | Geographic Relevance | Impact Timeline |
|---|---|---|---|
| Rising Incidence of Chronic and Trauma‐Related Conditions | +2.1% | Global APAC, concentrated in aging populations | Long term (≥ 4 years) |
| Rapid Technology Upgrades (FPD, AI Reconstruction, Dose-Reduction) | +1.8% | China, Japan, Australia leading adoption | Medium term (2-4 years) |
| Government Imaging-Infrastructure Stimulus & PPP Roll-Outs | +1.5% | China, India, Australia with major programs | Short term (≤ 2 years) |
| Mobile Chest-X-Ray Vans Targeting Remote Islands & Border Areas | +0.9% | Philippines, Indonesia, Pacific islands | Medium term (2-4 years) |
| Localization Mandates in China, India, Indonesia Favouring Regional OEMs | +1.2% | China, India, Indonesia domestic markets | Long term (≥ 4 years) |
| 5G-Enabled Cloud Teleradiology Hubs Unlocking Rural Demand | +0.7% | South Korea, Japan, Singapore infrastructure-ready | Medium term (2-4 years) |
| Source: Mordor Intelligence | |||
Rising Incidence of Chronic and Trauma-Related Conditions
Asia Pacific’s quickly greying population widens the baseline of patients requiring periodic imaging for diabetes, cardiovascular disease, and osteoporosis. WHO estimates the region’s 60 + cohort will almost double to 22.9% by 2050, sharply lifting orthopedic and chest X-ray volumes. Parallel urbanization raises road-traffic injuries, deepening trauma caseloads that necessitate rapid radiographic triage. Against this backdrop, digital radiography’s high throughput and repeat-scan efficiency position it as the frontline diagnostic modality. Hospitals increasingly embed AI triage software that flags fractures or pulmonary anomalies in real time, minimizing reporting delays and boosting clinical confidence. Collectively, these epidemiologic and workflow factors add 2.1% to CAGR forecasts for the Asia Pacific digital X-ray market.
Rapid Technology Upgrades (FPD, AI Reconstruction, Dose Reduction)
Flat-panel detector pixel architectures now pair with AI denoising engines capable of maintaining image quality at 30-70% lower dose, satisfying stricter radiation-safety protocols without compromising diagnostic clarity[1]National Center for Biotechnology Information, “AI-Driven Advances in Low-Dose Imaging and Enhancement—A Review,” pmc.ncbi.nlm.nih.gov. One tertiary hospital in India reduced mean adult chest-X-ray exposure from 0.20 mGy to 0.10 mGy while preserving contrast-to-noise ratios. Photon-counting and IGZO substrates further shrink panel thickness, unlocking handheld device form factors and longer battery life. Regulatory bodies in Japan and South Korea have approved more than a dozen AI-based imaging SaMDs, signaling policy alignment with software-driven quality gains. These technology tailwinds collectively raise the Asia Pacific digital X-ray market’s growth trajectory by 1.8%.
Government Imaging-Infrastructure Stimulus & PPP Roll-Outs
Fiscal and public-private partnership initiatives shorten equipment-replacement cycles across secondary and tertiary hospitals. China’s stimulus underwrites bulk purchases through centralized procurement, while India’s viability-gap funding model supports 10-year concession contracts for radiology centers inside district hospitals. Australia earmarked USD 9.4 billion for Tasmanian hospital upgrades that include radiology suites, catalyzing immediate order books for digital X-ray vendors. These programs accelerate installation timelines, lift service coverage, and compress total cost of ownership via lifecycle-based financing, adding 1.5% to growth potential.
Mobile Chest-X-ray Vans Targeting Remote Islands & Border Areas
Ultra-portable X-ray systems weighing roughly 25 kg enable tuberculosis and trauma screening in archipelagic nations where ferry journeys previously delayed diagnosis by weeks. The Philippines’ InferAir initiative processed up to 400 scans daily across dispersed islands, proving field robustness[2]InferVision, “Making Healthcare Accessible in Remote Philippine Islands with InferAir,” infervision.com. Similar vans in Indonesia’s Semarang City screened 2,700 residents, detecting a 1% TB positivity rate that informed treatment rollouts. Integration of solar-powered generators and 5G uplinks facilitates same-day specialist reads, nudging a 0.9% CAGR lift by opening formerly unreachable demand pockets.
Restraints Impact Analysis of Asia-Pacific Digital X-ray Market*
| Restraint | (~) % Impact on CAGR Forecast | Geographic Relevance | Impact Timeline |
|---|---|---|---|
| High Capex & Upgrade Costs for Digital Migration | -1.4% | Lower-income APAC markets, rural facilities | Short term (≤ 2 years) |
| Shortage of Certified Radiographers & Service Engineers | -1.1% | Regional, acute in public and rural settings | Long term (≥ 4 years) |
| Fragmented Radiation-Safety Certification Across APAC Delaying Launches | -0.8% | Multi-country manufacturers and importers | Medium term (2-4 years) |
| ESG Push for Lead-Free Disposal Adding Compliance Costs | -0.6% | Export-oriented manufacturers, EU market access | Medium term (2-4 years) |
| Source: Mordor Intelligence | |||
High Capex & Upgrade Costs for Digital Migration
Entry-level digital radiography rooms cost USD 15,000–50,000, a sum exceeding annual equipment budgets of many provincial clinics. Additional outlays for PACS servers, Wi-Fi retrofits, and staff retraining elevate total project spend by 40 %. OECD notes out-of-pocket health payments still exceed 50 % of total spending in several Asia Pacific economies, narrowing fiscal bandwidth for capital projects. Although leasing and pay-per-image models are emerging, limited vendor service footprints in remote districts slow uptake, removing 1.4% from the CAGR outlook.
Shortage of Certified Radiographers & Service Engineers
Radiographer density in parts of Southeast Asia remains below 2 per 100,000 population, far short of OECD’s 5.5 benchmark. Pandemic-related burnout compounded attrition, leaving new installations underutilized. Singapore General Hospital and Philips launched a regional MRI training hub, yet throughput meets only 10% of projected staffing gaps[3]National Cancer Centre Singapore, “Philips and Singapore General Hospital to advance medical imaging capabilities,” nccs.com.sg. Limited field engineers similarly prolong downtimes, subtracting 1.1% from growth forecasts.
*Our forecasts treat driver/restraint impacts as directional, not additive. The impact forecasts reflect baseline growth, mix effects, and variable interactions.
Asia-Pacific Digital X-ray Market Segment Analysis
By Portability:
Mobile Revolution Drives GrowthFixed rooms retained 59.12% revenue in 2025, underscoring their primacy in high-throughput hospital corridors. Yet the Asia Pacific digital X-ray market size attached to hand-held models is set to grow 12.7% annually to 2031, buoyed by 25 kg battery-powered units that complete 400 scans on a single charge. Mobile carts bridge inpatient care needs for ICUs and ERs, while vans extend public health screening to archipelagos. Hand-held adoption also dovetails with NGO sponsorships that bypass hospital procurement cycles.
Field evidence from Fujifilm’s 2024 FDR Xair launch shows tuberculosis programs slashing deployment times from months to days, as importers no longer need reinforced vehicles for heavy X-ray generators. These workflow wins draw new buyers beyond healthcare, including border security and disaster-response agencies. As a result, hand-held units will steadily nibble at fixed-room dominance while expanding the total addressable Asia Pacific digital X-ray market.



By Detector Panel Type:
Silicon Dominance ChallengedAmorphous silicon commanded 47.05% of 2025 revenue thanks to its mature supply chain and proven reliability. The Asia Pacific digital X-ray market share attributable to IGZO/flexible panels, however, is on course for a 12.25% CAGR through 2031 as thinner substrates lower system weight by 30% without degrading detective quantum efficiency. Chinese firms now export IGZO panels at price points under USD 1,600, undercutting imports by 22%. Photon-counting prototypes passed bench testing, promising spectral data capture that differentiates soft tissues at near-native low dose.
Healthcare purchasing consortia in Japan and Australia already include spectral readiness clauses in 2027 tenders, nudging hospitals toward future-proof detector platforms. Consequently, while silicon retains scale economies today, the Asia Pacific digital X-ray market size tied to emerging panel chemistries is poised for double-digit gains.
By Application:
Orthopedic Leadership, Dental AccelerationOrthopedic imaging generated 29.34% of 2025 revenue, reflecting fracture care volumes and bone-density studies among seniors. AI triage now flags suspected fractures in under three seconds, shaving radiologist read time by 20% in pilot sites across Seoul. Dental radiography, though smaller, will post an 11.25% CAGR as preventive dentistry gains traction among Asia’s expanding middle class. Immediate chair-side image availability and 40-60% lower dose versus film entice clinics to upgrade.
Chest imaging remains indispensable for tuberculosis control, especially in Indonesia and the Philippines, where annual screen-and-treat programs rely on digital units for speed. Cardiovascular applications are rising too, fueled by AI-assisted calcium scoring on lateral chest images. Collectively, the diversified application mix insulates vendors from cyclicality in any single specialty, broadening the Asia Pacific digital X-ray industry revenue base.
By End User:
Hospital Dominance, Mobile Unit SurgeHospitals and multispecialty clinics accounted for 65.05% of 2025 revenue as inpatient diagnostics and surgical planning require fixed high-power rooms. Nonetheless, mobile screening units will clock a 12.05% CAGR to 2031, propelled by government-NGO partnerships for active TB case finding. India’s Haryana program advanced detection by 44% within one year by dispatching vans equipped with DR and AI software to villages previously lacking imaging access.
Diagnostic centers tap affluent urban outpatients seeking rapid turnarounds, while veterinary clinics mirror human-care trends, adopting compact DR for companion animals. The widening end-user cohort enlarges total Asia Pacific digital X-ray market demand, ensuring multi-channel resilience.
Geography Analysis
China and India Digital X-ray Market
China captured 39.20% of 2025 revenue owing to colossal hospital networks and homegrown OEM efficiencies. Domestic detector maker E-ray Technology shipped more than 300,000 units globally, affirming export competitiveness. Government Software-as-Medical-Device guidance harmonizes AI approvals, hastening smart system rollouts. India is on track for a 9.85% CAGR, catalyzed by Production-Linked Incentives that lure global brands into local assembly; Siemens Healthineers invested INR 91.9 crore in Bengaluru CT and MRI lines. Strong Ayushman Bharat coverage expansion simultaneously enlarges patient throughput, elevating imaging volumes.
APAC Digital X-ray Market
Japan, Australia, and South Korea showcase best-practice regulation and rapid AI adoption. Japan has cleared 17 imaging AI SaMDs, setting a regulatory template emulated across ASEAN. Australia’s USD 9.4 billion Tasmanian rebuild earmarks radiology suites, while its 12% share of Asia-Pacific digital health spending makes it a lucrative test bed for dose-reduction technologies. South Korea’s innovative device tax incentives accelerate domestic AI algorithm commercialization.
Broader APAC Markets
Altogether, these diverse market dynamics ensure sustained regional momentum, with emerging economies driving volume and advanced ones piloting technological frontiers, collectively fortifying the Asia Pacific digital X-ray market.
Regulatory Landscape
Asia-Pacific digital X-ray commercialization and use are governed by country-specific medical-device registration requirements alongside radiation and quality-control rules. This creates multi-jurisdiction compliance work for OEMs and importers. In Malaysia, Medical Device Authority (MDA) Circular No. 1 of 2026 took full effect on January 28, 2026, tightening procurement eligibility by requiring tenderers to hold a valid Establishment Licence, which affects distributor qualification and bid participation for hospital DR tenders.
Competitive Landscape
Global multinationals—GE Healthcare, Siemens Healthineers, Philips, Canon, and Shimadzu—retain strong brand equity and vast service footprints. However, Chinese challengers such as Mindray and Wandong now offer detector-software bundles at 15–20% lower price, eroding entry barriers. Strategic differentiation centers on AI ecosystems; Siemens’ teamplay platform links DR systems to cloud analytics, while Canon integrates image shading correction for slender dose windows. April 2024 saw Shimadzu purchase California X-ray Imaging Services, extending its direct U.S. servicing arm and reinforcing turnkey credentials.
Regional alliances also deepen reach; GE Healthcare’s January 2025 agreement with Getz Healthcare leverages a 16-country distributor network to accelerate penetration of mid-tier DR models. Vendors increasingly bundle flexible financing, 24/7 remote diagnostics, and AI subscription services, shifting competition from hardware margin to lifecycle revenue.
Asia-Pacific Digital X-ray Industry Leaders
GE Healthcare
Siemens Healthineers
Koninklijke Philips NV
Canon Inc.
Shimadzu Corp.
- *Disclaimer: Major Players sorted in no particular order
Asia-Pacific Digital X-ray Market Companies Covered in this Report
- Agfa-Gevaert
- Canon
- Fujifilm Holdings Corp.
- GE Healthcare
- Hitachi
- Hologic
- Konica Minolta
- Koninklijke Philips
- Landwind Medical
- Mindray Bio-Medical
- MinXray
- OR Technology
- Perlove Medical
- Samsung Electronics (Samsung Medison)
- Shimadzu
- Siemens Healthineers
- Skanray Technologies
- United Imaging Healthcare
- Varex Imaging
- Wandong Medical

Market Opportunities and Future Outlook
National digital-health infrastructure and reimbursement rules create room for vendors that bundle DR hardware with PACS, connectivity, and workflow services. Vietnam formalized pricing and health-insurance reimbursement for film-free diagnostic imaging (PACS-enabled) in February 2026, lowering patient-facing costs and supporting migration from film-based workflows to digital X-ray rooms and mobile units. Australia is also tightening interoperability under the Modernising My Health Record framework, with mandatory compliance beginning in July 2026 for uploading diagnostic imaging reports to My Health Record by default. That policy change supports demand for integrated reporting, secure data exchange, and standardized identifiers across imaging providers.
Recent Industry Developments in Asia-Pacific Digital X-ray Market
- May 2026: Jardine Matheson announced the acquisition of Australia's I-MED Radiology Network for about USD 2.4 billion. The transaction consolidates a large diagnostic imaging provider footprint, strengthening purchasing leverage for digital X-ray and related informatics across a scaled outpatient network and accelerating standardization of equipment and workflow platforms.
- November 2025: Canon Medical Systems expanded its Mobirex i9 / Smart Edition high-end mobile X-ray system rollout to six additional hospitals across APAC. This reinforced mobile radiography capacity and improved throughput across multi-site settings.
- April 2024: Shimadzu completed the purchase of California X-ray Imaging Services, expanding its direct service and support capabilities in the United States. While outside Asia-Pacific, the transaction strengthens Shimadzu's global service model and installed-base support playbook for multi-country enterprise customers procuring digital radiography systems.


Asia-Pacific Digital X-ray Market Report Scope and Research Methodology
Market Definition and Coverage
For this study, the market covers revenue generated from digital X-ray systems and related detector-based radiography equipment sold across Asia-Pacific for human diagnostic imaging in routine clinical settings.
Scope exclusions: We exclude film-based analog X-ray, veterinary imaging, and procedure consumables and service contracts that are billed separately from system sales.
Segments Covered in This Report
- By Portability
- Fixed Systems
- Mobile DR Systems
- Hand-held Systems
- By Detector Panel Type
- Amorphous Silicon
- CMOS
- IGZO / Flexible Panels
- By Application
- Orthopedic
- Chest Imaging
- Cardiovascular
- Dental
- Other Applications
- By End User
- Hospitals & Multispecialty Clinics
- Diagnostic Imaging Centers
- Mobile Screening Units
- Dental Practices
- Veterinary Clinics
- By Country
- China
- Japan
- India
- Australia
- South Korea
- Rest of Asia-Pacific
Data Sources, Market Sizing, and Validation
Desk Research
Desk research is used to set the regional demand context and keep assumptions realistic before any modeling starts. We review public healthcare spend signals and diagnostic imaging infrastructure cues from sources such as the World Health Organization, World Bank, OECD health statistics, and national health ministries.
We also scan medical device regulator and procurement sources (for example, TGA Australia, PMDA Japan, and CDSCO India postings) to understand approval timing and the likely technology mix. Trade and shipment direction is checked using customs and UN Comtrade-style reporting, and we support this with company annual reports, investor presentations, and trusted press coverage on hospital capex cycles. Where required, we reference a paid subscription for company financials, news and patent intelligence to cross-check product introductions and country focus. These desk research sources are illustrative rather than exhaustive, and additional public sources were also used for data collection and clarification.
Primary Interviews and Surveys
Primary work is used to verify adoption pace, pricing logic, and country mix, which helps close gaps left by public sources. We spoke with hospital and imaging center buyers, distributors, service partners, and clinical users across major Asia-Pacific markets so assumptions could be challenged and adjusted before final sizing. Inputs from these discussions were then used to triangulate installation trends, replacement timing, and ASP ranges by system type.
Distribution of primary research fieldwork respondents
| Company type | Respondent position |
|---|---|
| Top tier: 27% | CXOs: 15% |
| Mid tier: 56% | Functional/Unit leaders: 26% |
| Smaller Players: 17% | Managers: 59% |
Market-Sizing & Forecasting
Sizing starts with a top-down build where diagnostic imaging demand is reconstructed from healthcare delivery signals in Asia-Pacific, and then translated into digital X-ray equipment spend. In practice, we link the model to variables such as installed base and replacement cycles, public and private hospital capacity additions, imaging procedure growth indicators, tender activity timing, and the shift from computed radiography to direct radiography.
To keep the totals grounded, the top-down output is corroborated with selective bottom-up approximations, such as sampled system shipments through key channels, average selling price bands by portability and detector type, and country-level rollups for the largest markets. Where bottom-up gaps exist (for smaller countries or limited disclosure), values are interpolated using proxy indicators like hospital count growth and import intensity, and then re-checked with interview feedback. Forecasting is done through scenario analysis supported by expert views on capex cycles, policy moves, and price erosion, and the final CAGR path is chosen only after the drivers align across multiple countries.
Data Validation & Update Cycle
Validation is done in layers so individual assumptions do not silently drive the full result. We compare computed market totals with independent signals such as procurement announcements, imaging infrastructure expansion, and observed price bands, and then investigate outliers at the country and product level before sign-off.
A second analyst review is completed to re-check unit logic, currency conversions, and the reasonableness of growth inflections across the forecast years. If large variances appear against primary feedback or new public information, the team re-contacts relevant respondents and updates the drivers. Reports are refreshed annually, and material events are incorporated through interim updates, followed by a final pre-delivery pass to reflect the latest available facts.
Mordor Intelligence's Asia Pacific Digital X Ray Market Market Size Compared With Other Published Estimates
Published market values for Asia-Pacific digital X-ray can look far apart because each publisher draws the line differently on what counts as the market, and which year and pricing assumptions are used. Differences also come from how strongly figures are validated using on-the-ground checks versus only desk indicators.
The table shows a wide spread for similar timeframes, and in Mordor Intelligence's model the scope stays with digital radiography system revenue across Asia-Pacific, rather than pooling fluoroscopy, mammography, or broader X-ray system buckets that some publications group together. Another source of spread is the way country weights and ASP movement are refreshed, since tender cycles and mix shifts do not move in sync across APAC.
Benchmark comparison
| Source | Market Size | Gaps in Research Methodology |
|---|---|---|
| Mordor Intelligence | USD 2.84 B (2025) | |
| Global Consultancy A | USD 2.40 B (2023) | Uses an earlier base year and can apply a different country and price mix, and the publication does not clearly separate digital X-ray system revenue from related bundled items, which changes the total. |
| Industry Publication B | USD 1.85 B (2031) | Reports a long-dated forecast point that is sensitive to replacement timing and assumed price erosion, and the scope description suggests a narrower device and application coverage than a full regional system view. |
Overall, the gap is mainly explained by scope boundaries between digital radiography and wider X-ray categories, the chosen base year, and the handling of ASP and country mix over time. By tying the model to observable demand signals and then checking totals with practical shipment and pricing reality checks, the outputs remain traceable and repeatable for planning.


Key Questions Answered in the Report
What is the projected value of the Asia Pacific digital X-ray market in 2031?
The market is forecast to reach USD 4.61 billion by 2031.
Which portability segment is growing fastest in Asia Pacific?
Hand-held systems are expected to grow at 12.7% CAGR through 2031, outpacing fixed and cart-based units.
Why are IGZO/flexible panels gaining traction?
Their thinner, lightweight design improves battery life for portable devices and supports lower radiation dose without image-quality loss.
How is government policy influencing demand?
Fiscal stimulus packages and production incentives accelerate hospital upgrades and local manufacturing, enlarging order pipelines.
Which country leads regional market share today?
China holds about 39.20% of Asia Pacific digital X-ray revenues, driven by large-scale hospital modernization and domestic OEM strength.
Page last updated on:


 Your data is secure and never sold or shared.


