Market Overview
| Study Period | 2020 - 2031 |
|---|---|
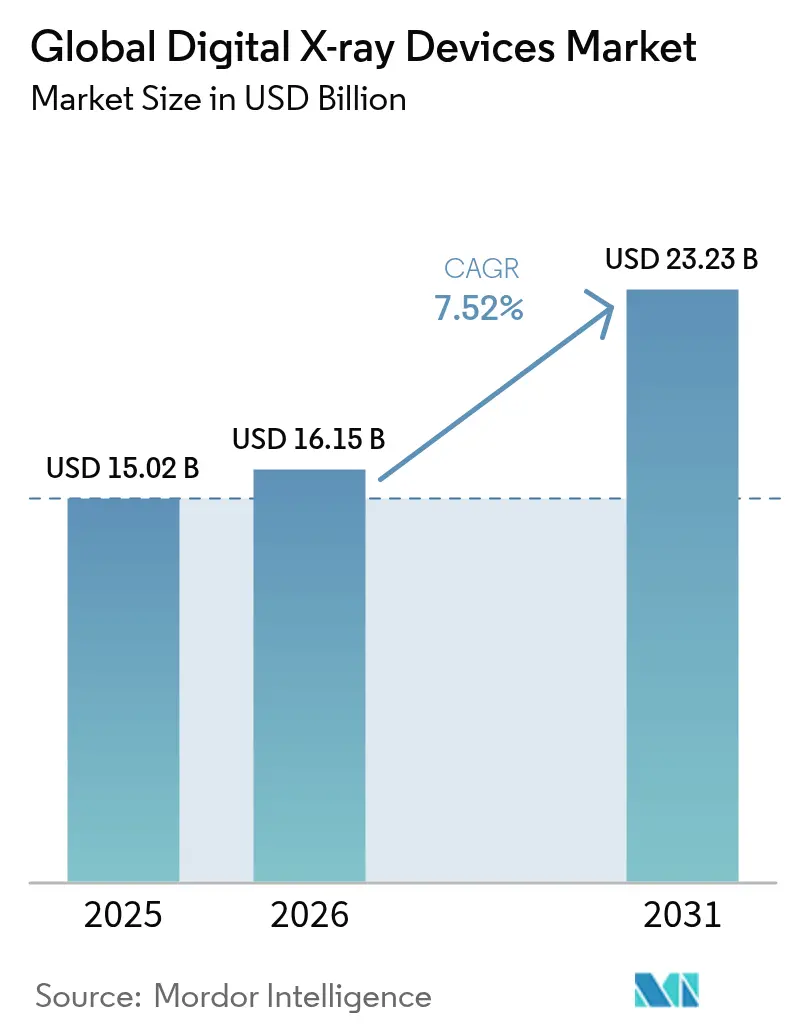
| Market Size (2026) | USD 16.15 Billion |
| Market Size (2031) | USD 23.23 Billion |
| Growth Rate (2026 - 2031) | 7.52% CAGR |
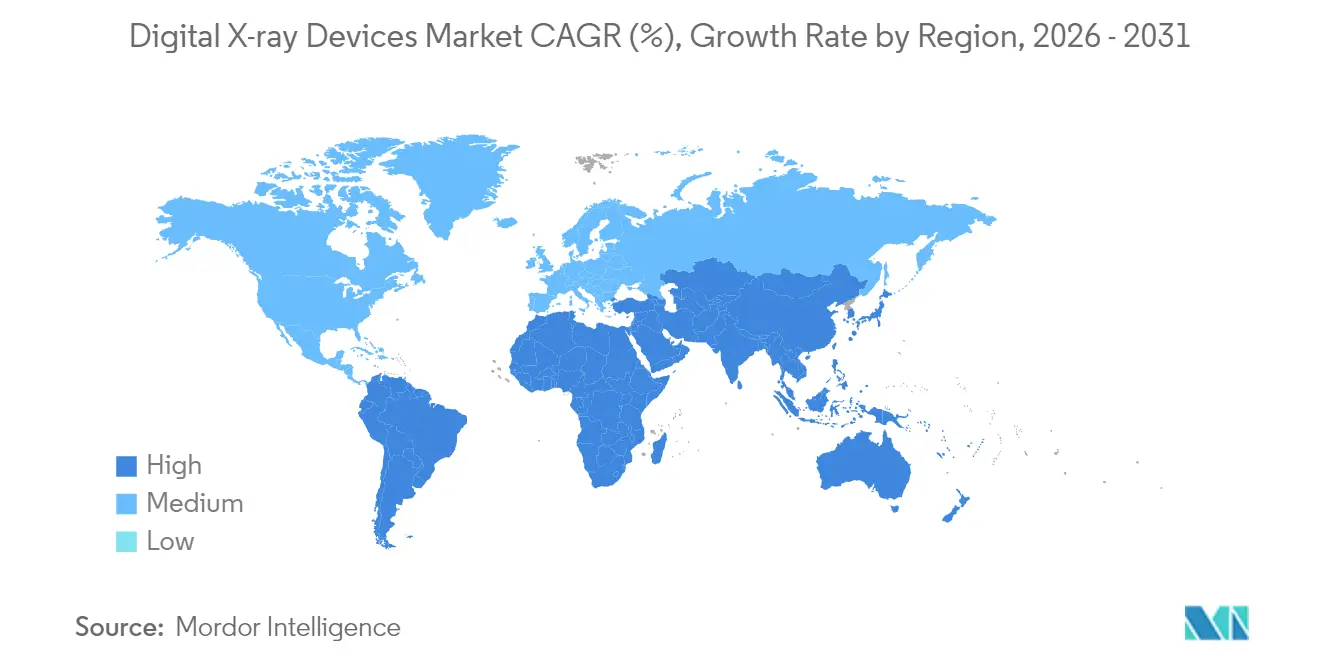
| Fastest Growing Market | Asia Pacific |
| Largest Market | North America |
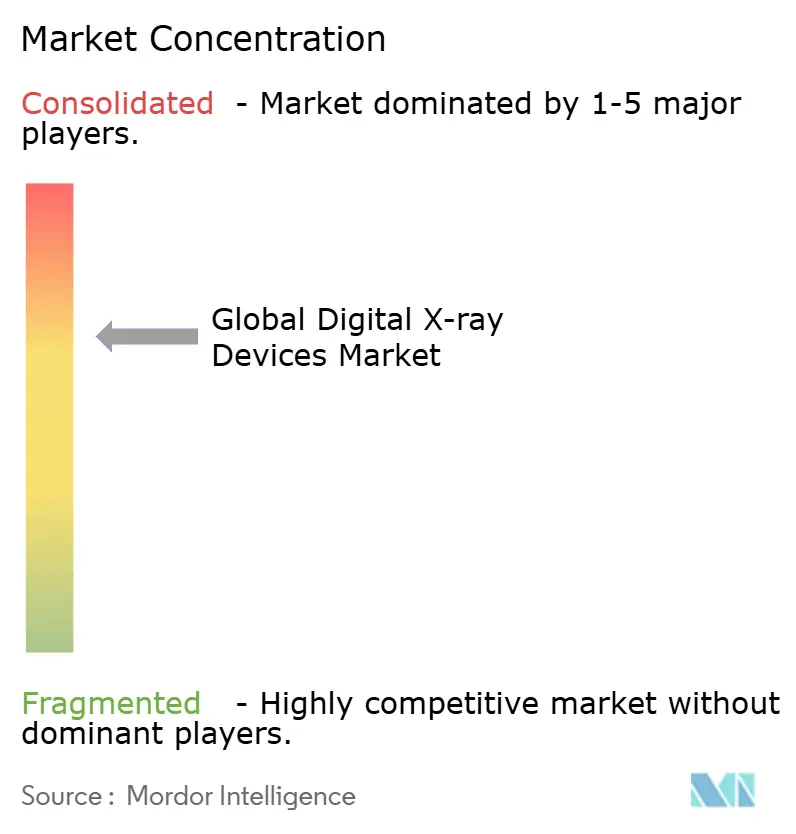
| Market Concentration | Medium |
Major Players *Disclaimer: Major Players sorted in no particular order Image © Mordor Intelligence. Reuse requires attribution under CC BY 4.0. | |
Global Digital X-ray Devices Market Analysis by Mordor Intelligence
The digital X-ray devices market size was valued at USD 15.02 billion in 2025 and estimated to grow from USD 16.15 billion in 2026 to reach USD 23.23 billion by 2031, at a CAGR of 7.52% during the forecast period (2026-2031). Consistent replacement of film and computed radiography (CR) systems, stronger emphasis on dose management, and expanding AI integration sustain this growth trajectory. Intensified Medicare penalties on CR, rising chronic disease imaging demand, and hospital workflow optimization continue to accelerate direct radiography (DR) upgrades, while portable platforms extend access beyond the hospital campus. AI-ready detectors, photon-counting technology, and cloud-enabled workflow solutions push performance benchmarks higher, creating fresh competitive pressure for traditional vendors. Simultaneously, raw-material constraints in rare-earth scintillators and radiographer staffing gaps introduce operational risk, compelling providers to seek productivity-driven innovations.
Key Report Takeaways
- By technology, direct radiography led with 83.90% of the digital X-ray devices market size in 2025; computed radiography is projected to decline as DR advances at 7.95% CAGR through 2031.
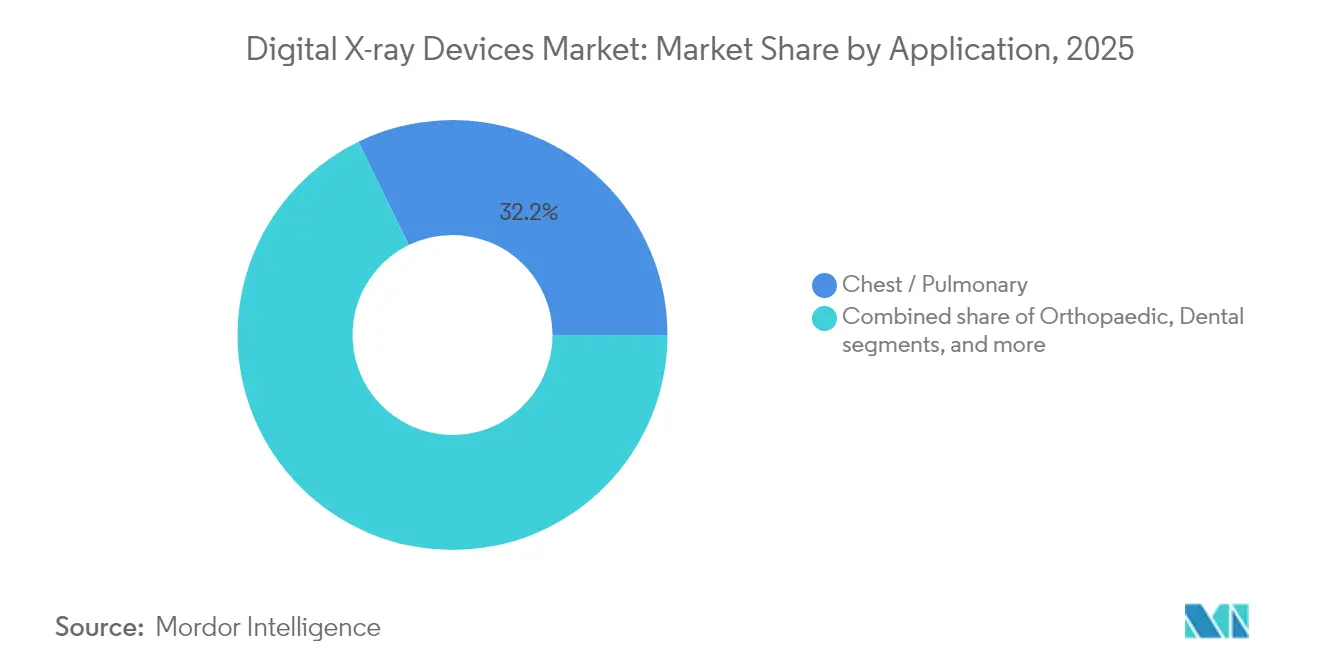
- By application, chest and pulmonary imaging commanded 32.21% revenue share in 2025; dental imaging is poised to expand at an 8.64% CAGR to 2031.
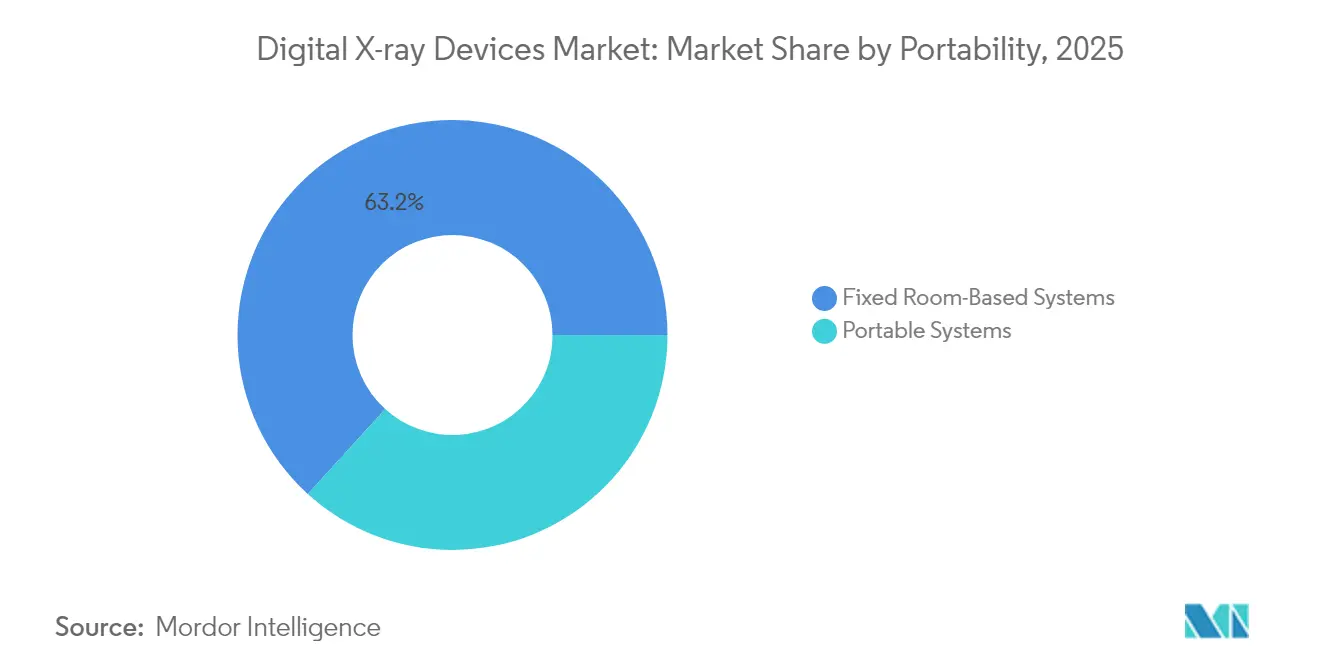
- By portability, fixed room-based systems held 63.25% of the digital X-ray devices market size in 2025, while portable systems exhibit the highest projected CAGR at 8.12% between 2026 and 2031.
- By end-user, hospitals accounted for 56.74% of the digital X-ray devices market share in 2025; ambulatory surgical centers record the fastest growth at 8.47% CAGR through 2031.
- By geography, North America maintained a 38.10% share in 2025; Asia-Pacific is forecast to achieve the quickest regional CAGR at 8.55% through 2031.
Note: Market size and forecast figures in this report are generated using Mordor Intelligence’s proprietary estimation framework, updated with the latest available data and insights as of 2026.
Global Digital X-ray Devices Market Trends and Insights
Drivers Impact Analysis*
| Driver | (~) % Impact on CAGR Forecast | Geographic Relevance | Impact Timeline |
|---|---|---|---|
| Rising prevalence of chronic & orthopedic disorders | +2.1% | Global, with highest impact in North America & Europe | Long term (≥ 4 years) |
| Rapid detector & AI upgrades in DR panels | +1.8% | North America & APAC core, spill-over to Europe | Medium term (2-4 years) |
| Cost-savings & dose-reduction versus film/CR | +1.5% | Global, particularly emerging markets | Short term (≤ 2 years) |
| Procurement incentives for retrofit upgrades in mid-tier hospitals | +1.2% | North America & Europe, expanding to APAC | Medium term (2-4 years) |
| Growth of point-of-care & home imaging ecosystems | +0.9% | Global, with early adoption in developed markets | Long term (≥ 4 years) |
| Expansion of AI-driven teleradiology networks | +0.7% | Global, accelerated in underserved regions | Medium term (2-4 years) |
| Source: Mordor Intelligence | |||
Rising Prevalence of Chronic & Orthopedic Disorders
Global population aging enlarges the base of patients requiring musculoskeletal and chest imaging. Osteoporosis, osteoarthritis, and cardiopulmonary diseases now dominate outpatient diagnostics, driving regular radiographic follow-ups that create repeat equipment utilization. The World Health Organization projects that chronic disorders will account for nearly three-quarters of worldwide deaths by 2030[1]World Health Organization, “Universal Health Coverage (UHC) Fact Sheet,” World Health Organization, who.int, firmly anchoring radiography as a frontline diagnostic tool. AI-enhanced DR platforms add value by detecting subtle vertebral fractures during routine studies, as demonstrated by Nanox AI’s HealthOST algorithm, which uncovered thousands of undiagnosed cases across NHS sites. Early detection lowers downstream costs and supports reimbursement for preventative imaging. Growing orthopedic imaging demand, therefore, sustains consistent unit placements across hospitals, imaging centers, and ambulatory clinics within the digital X-ray devices market.
Rapid Detector & AI Upgrades in DR Panels
Flat-panel detectors now incorporate on-board computing that improves exposure parameters, noise suppression, and automated collimation. Photon-counting architectures further enhance spatial resolution and contrast-to-noise ratios, giving clinicians more diagnostic information at lower doses. Siemens Healthineers, GE Healthcare, and other OEMs invest heavily in joint hardware-software roadmaps that extend competitive life cycles for installed fleets. GE Healthcare’s collaboration with NVIDIA[2]GE Healthcare, “GE Healthcare and NVIDIA Reimagine Diagnostic Imaging,” gehealthcare.com illustrates this pivot, aiming to automate image positioning and quality checks, thereby shortening exam times and improving technologist productivity. Facilities, therefore, prioritize detectors that can receive continuous firmware upgrades, protecting capital investments and reinforcing the digital X-ray devices market’s innovation cadence.
Cost-Savings & Dose-Reduction Versus Film/CR
Direct radiography eliminates film processing, chemical disposal, and physical storage costs. In addition, Medicare imposes a 7% annual reimbursement cut on CR images, accelerating conversion economics for sites still using cassette systems. DR platforms consistently show 30–50% lower radiation exposure while reducing examination cycle times from minutes to seconds, enabling radiology departments to manage higher patient volumes without staff increases. These gains shrink payback periods to under two years for many high-volume centers, making DR adoption financially compelling in both developed and price-sensitive markets. Environmental benefits from eliminating chemicals also resonate with hospital sustainability goals.
Procurement Incentives for Retrofit Upgrades in Mid-Tier Hospitals
Retrofit kits convert existing analog or CR rooms into full DR suites at comparatively modest cost. Wireless detectors and modular workstations minimize room downtime and preserve legacy infrastructure. Government-led managed-equipment service contracts in several emerging economies fund these upgrades, spreading the financial burden over multi-year service payments while guaranteeing uptime. For providers lacking full capital budgets, subscription models and outcome-based payments make DR accessible, which in turn expands addressable volumes within the digital X-ray devices market.
Restraints Impact Analysis*
| Restraint | (~) % Impact on CAGR Forecast | Geographic Relevance | Impact Timeline |
|---|---|---|---|
| High CAPEX & total-cost-of-ownership | -1.4% | Global; acute in emerging markets | Short term (≤ 2 years) |
| Reimbursement gaps in outpatient settings | -0.8% | North America & Europe | Medium term (2-4 years) |
| Skilled radiographer shortage for advanced DR & AI workflows | -0.6% | Global; most severe in developed markets | Long term (≥ 4 years) |
| Supply-chain risk in rare-earth scintillators | -0.4% | Global; concentrated in Asia-Pacific | Medium term (2-4 years) |
| Source: Mordor Intelligence | |||
High CAPEX & Total-Cost-of-Ownership
Premium DR rooms with advanced AI features can exceed USD 500,000, representing significant financial barriers for small hospitals. Ongoing maintenance contracts, cybersecurity upgrades, and periodic detector replacements inflate lifecycle spending. In the United States, 2025 Physician Fee Schedule adjustments cut global imaging reimbursement by 3.55%, lengthening return-on-investment horizons for new equipment. Facilities therefore scrutinize capital plans more closely, delaying some purchases and selectively favoring retrofit kits or refurbished detectors.
Reimbursement Gaps in Outpatient Settings
Ambulatory and independent imaging centers rely on predictable reimbursements to service equipment leases. Commercial payers increasingly mirror Medicare’s downward adjustments, while new value-based arrangements tie payment to diagnostic outcomes. Smaller centers lack leverage to negotiate higher rates, pressuring margins and limiting DR capital spending. Regulatory complexity surrounding AI reimbursement adds uncertainty, further dampening purchasing appetite among outpatient providers within the digital X-ray devices market.
*Our forecasts treat driver/restraint impacts as directional, not additive. The impact forecasts reflect baseline growth, mix effects, and variable interactions.
Segment Analysis
By Application: Chest Imaging Dominance Drives Volume Growth
Chest and pulmonary studies represented 32.21% of the digital X-ray devices market size in 2025. High examination frequency in emergency, critical-care, and routine outpatient settings sustains system utilization and encourages continuous detector upgrades. AI screening algorithms for pneumonia and tuberculosis enhance diagnostic confidence, reinforcing DR as the modality of choice for first-line respiratory evaluation. Dental imaging registers the fastest expansion at an 8.64% CAGR, helped by compact intraoral sensors and AI-assisted caries detection that streamline chairside workflows. Orthopedic imaging also climbs steadily as elderly populations require frequent fracture assessment and postoperative monitoring.
Beyond volumes, chest radiography leads AI adoption because image libraries are large and labeling is standardized, enabling rapid algorithm development. Portable chest systems deployed during infectious disease outbreaks demonstrated clear value, ensuring continuity of care while reducing cross-contamination risks. Dental practices benefit from three-dimensional reconstruction and cloud-based consults, increasing the revenue potential per visit. Together, these factors broaden the digital X-ray devices market’s application mix, balancing mature high-volume segments with faster-growing specialty niches.


By Technology: Direct Radiography Transformation Accelerates
Direct radiography platforms captured 83.90% of digital X-ray devices market share in 2025, with continued expansion underpinned by superior image quality, workflow speed, and favorable reimbursement. Photon-counting detectors under evaluation show promise for dual-energy separation and lower dose at equal resolution, marking the next leap in detector innovation. Computed radiography remains only in budget-constrained facilities, yet escalating reimbursement penalties and the falling price of entry-level DR units drive conversion.
The digital X-ray devices industry now differentiates primarily on integrated software performance rather than raw detector pixel size. Smart acquisition protocols, predictive maintenance alerts, and automated quality assurance raise clinical confidence while reducing service costs. Consequently, procurement teams assess total software ecosystem capability before committing to hardware, cementing direct radiography’s role as the technology backbone of the digital X-ray devices market.
By Portability: Mobile Systems Drive Access Expansion
Fixed rooms accounted for 63.25% of the digital X-ray devices market size in 2025, serving trauma centers, operating theaters, and radiology departments that require top image fidelity and high throughput. Portable systems advance at an 8.12% CAGR due to point-of-care, ICU, and home-health adoption. Handheld units weighing under 4 kg allow clinicians to perform exams in ambulances, rural clinics, and residential settings without patient transport. Field trials of Fujifilm’s compact X-air registered zero missed appointments, underscoring mobility’s value in geographically dispersed communities.
Battery improvements, lightweight shielding, and Wi-Fi image transfer shorten setup times and speed clinical decisions. Portable DR also supports crisis response, enabling rapid triage during disasters or pandemics. As payers increasingly reimburse for home diagnostics, mobility becomes a core competitive dimension, anchoring future growth across the digital X-ray devices market.
By End-User: Ambulatory Centers Lead Growth Transformation
Hospitals retained 56.74% of the digital X-ray devices market share in 2025, leveraging broad service lines and night-and-day staffing to generate exam volume. Nonetheless, ambulatory surgical centers record an 8.47% CAGR through 2031, fueled by payer preference for lower-cost outpatient procedures and patient demand for convenient care. Imaging-only centers and urgent-care clinics also purchase compact DR suites to differentiate service offerings.
The digital X-ray devices market size for ambulatory settings rises further as AI tools reduce reliance on specialized technologists, mitigating the 18.1% vacancy rate reported for radiologic technologists in 2024. Equipment vendors respond with turnkey packages that bundle training, cloud PACS, and remote support. These solutions enable smaller sites to deploy sophisticated imaging with limited staffing, driving incremental unit sales and reinforcing decentralization trends.
Geography Analysis
North America generated 38.10% of 2025 revenue within the digital X-ray devices market, anchored by mature hospital networks and accelerated upgrade cycles motivated by Medicare penalties. OEMs raised detector shipments after U.S. hospitals prioritized radiation safety, cybersecurity, and AI readiness in their 2025 capital budgets. Canada applies similar dose-reduction targets, while Mexico’s Seguro Popular replacement scheme channels funding toward provincial imaging centers. Despite this scale, annual growth moderates to 7.05% as substitution rather than new installation dominates demand.
Asia-Pacific is the fastest-growing territory at 8.55% CAGR, propelled by multi-billion-dollar public hospital construction programs and expanding middle-class insurance coverage. China’s Healthy China 2030 blueprint mandates imaging capacity expansion at county level, incentivizing regional OEMs to localize detector assembly. India’s smart-city and Ayushman Bharat initiatives increase rural diagnostic reach, spurring sales of rugged portable DR. Meanwhile, Japanese and South-Korean providers purchase high-end photon-counting prototypes for cardiovascular and oncology subspecialties. Supply-chain risk in rare-earth scintillators, however, could inflate end prices if export restrictions persist, injecting volatility into Asia-Pacific procurement cycles. Europe posts a steady 7.45% CAGR to 2031 as universal health systems replace aging CR fleets. The European Radiation Protection Directive enforces dose-tracking software, elevating AI-ready DR adoption. Germany and France invest in teleradiology networks to serve rural regions, while the United Kingdom advances community diagnostic hubs that favor portable DR. Middle East & Africa demonstrates 8.02% CAGR owing to multi-clinic investments in Gulf Cooperation Council states and expanding insurance penetration in South Africa. South America grows 7.78% as Brazil’s public-private concession model funds diagnostic equipment, combating historical under-supply.

Regulatory Landscape
In the United States, digital X-ray systems and major components must comply with FDA performance standards for diagnostic X-ray (21 CFR 1020.30-1020.33), alongside applicable requirements such as 21 CFR 1020.40 for cabinet X-ray systems. These rules shape expectations for shielding, radiation output, labeling, and quality assurance for both manufacturers and providers. Separately, on June 17, 2026, the FDA established class II status with special controls for radiological machine learning-based quantitative imaging software, including pathways that allow predetermined change control plans, which is relevant for AI-enabled DR workflows bundled with X-ray acquisition and QC features.
In Europe, compliance remains anchored to the EU Medical Device Regulation (MDR 2017/745), with ongoing emphasis on clinical evaluation, post-market surveillance, and traceability for radiography equipment and integrated software. The European Commission published a legislative Simplification Package proposal on December 16, 2025, to amend MDR/IVDR and reduce administrative burden, but it is not enacted as of mid-2026, so manufacturers continue to plan around existing MDR conformity assessment requirements. In China, the NMPA issued a 2026 Medical Device Industry Standards Development and Revision Plan in February 2026 that includes digital radiography-related standard work, and new medical device GMP requirements take effect November 1, 2026, increasing documentation, process control, and audit-readiness expectations for device and detector supply chains serving the market.
Value Chain Analysis
The digital X-ray devices value chain runs from raw materials, such as scintillators (including cesium- and gadolinium-based materials) and specialty large-area glass, to core components like CMOS sensors, TFT backplanes, generator and tube assemblies, and rotating anodes. OEMs then integrate detectors, gantries or mobile carts, acquisition software, and connectivity to PACS/RIS into complete imaging systems.
Regulatory and quality infrastructure, including ISO 13485 quality systems, IEC 60601-1 safety, IEC 60601-1-3 radiation protection, and IEC 60601-2-54 for radiography/radioscopy, acts as a gating layer across design, manufacturing, and verification. Cybersecurity documentation requirements are increasingly visible in reviews for networked systems within premarket submissions. Bottlenecks cluster around constrained refining capacity for specialty scintillator materials, tight semiconductor fab allocation for imaging sensors, and periodic lead-time extensions for large-area glass substrates (often cited in the 16-20 week range), which can cascade into detector and system availability. Qualification and design-change cycles typically run 12-24 months for new detector technologies, creating structural delay between material or sensor innovation and broad commercial availability, while component shortages can extend production timelines by several months. Beyond equipment sales, value capture concentrates in service, managed-equipment contracts, detector replacement cycles, and recurring software licensing, increasing the role of field service organizations, distributors, and enterprise IT integration partners in total lifecycle economics.
Competitive Landscape
First-tier multinationals—Siemens Healthineers, GE Healthcare, and Philips—maintain extensive portfolios spanning room-based suites, mobile carts, detectors, and enterprise informatics. They benefit from vertically integrated service agreements and established channel networks, capturing multi-year managed-equipment contracts with large health systems. Siemens channeled USD 27.38 billion into med-tech development and opened new high-throughput detector lines in 2025, securing long-term supply continuity. GE Healthcare’s 2025 collaboration with NVIDIA positions the firm at the forefront of autonomous workflow solutions, re-shaping competitive dynamics toward software value.
Second-tier manufacturers such as Canon Medical, Agfa-Gevaert, Carestream, and Fujifilm leverage specialized imaging heritage and cost-efficient production to address value-oriented segments. They differentiate through retrofit kits, wireless detectors, and tailored financing packages that resonate with mid-tier hospitals. Meanwhile, specialized disruptors like Nanox target affordability with cold-cathode X-ray source designs[4]Nano-X Imaging Ltd., “Nanox Receives FDA Clearance for New Imaging System,” investors.nanox.vision, using subscription models to penetrate low-resource markets. AI-only vendors, including Aidoc and Lunit, partner with hardware OEMs to bundle decision-support algorithms, migrating competitive emphasis from physical components to image intelligence.
Patent filings for photon-counting sensors, perovskite scintillators, and automated collimation exceed 5,000 applications since 2022, indicating sustained innovation velocity. Supply-chain alliances with scintillator suppliers and electronics fabs have become critical strategic levers, particularly after China’s export-licensing framework on gadolinium and lutetium. Vendors hedging with multi-regional supply agreements and recycling programs gain resilience, an increasingly important differentiator within the digital X-ray devices market.
Global Digital X-ray Devices Industry Leaders
Canon Medical Systems Corporation
Fujifilm Holdings Corporation
GE Healthcare
Koninklijke Philips N.V.
Siemens Healthineers AG
- *Disclaimer: Major Players sorted in no particular order

Market Opportunities and Future Outlook
Dose governance and data standardization are creating a specific whitespace in DR upgrades that embed dose monitoring and reporting into routine workflow. In February 2026, the European Commission issued Commission Recommendation (Euratom) 2026/403 on establishing and using diagnostic reference levels and supporting dose data standardization, encouraging providers to operationalize consistent dose tracking across sites and vendors. This raises demand for DR rooms and portable systems that can export structured dose and exam metadata reliably, reinforcing the business case for replacing older film/CR and non-connected digital installations.
Workflow automation is another actionable opportunity area linked to radiographer shortages and throughput constraints, with differentiation moving toward on-device guidance, automated quality checks, and software upgradability. In June 2026, Agfa Radiology Solutions highlighted intelligent automation features in DR platforms aimed at reducing manual workload through AI-driven guidance and automated quality assurance, aligning purchasing priorities toward productivity and repeatability in both fixed rooms and mobile environments. On the hardware side, performance-per-dose improvements in newer detector stacks support retrofit and fleet refresh programs, particularly where capital constraints favor staged upgrades through wireless detectors, modular workstations, and managed service models rather than full room rebuilds.
Recent Industry Developments
- January 2026: Fujifilm announced the first UK installation of the updated FDR Visionary Suite digital X-ray room at The Yorkshire Clinic. The installation points to continued investment in room-based DR modernization and offers a reference site for workflow-focused upgrades in mature European hospital markets.
- November 2025: Canon Medical Systems commenced sales of the Mobirex i9 / Smart Edition mobile X-ray system equipped with a CXDI series digital radiography detector. The rollout reinforces competitive emphasis on mobile DR carts that combine portability with detector ecosystem compatibility for faster bedside imaging.
- February 2024: Canon Medical Systems Europe introduced Xavion, an AI-supported remote-controlled digital R/F system, at the European Congress of Radiology. The announcement highlighted broader vendor moves toward AI-assisted operation and remote-control capabilities that can improve consistency and reduce operator burden in high-throughput imaging environments.


Research Methodology Framework and Report Scope
Market Definition and Coverage
For this study, the digital X-ray devices market covers medical radiography systems that capture images using computed radiography or direct digital sensors across hospitals, diagnostic centers, and similar care settings. It includes fixed and portable digital X-ray systems and related device-level accessories sold with the equipment.
Scope exclusions: Veterinary imaging, industrial nondestructive testing, and stand-alone image analysis software are excluded from this market sizing.
Segmentation Overview
- By Application
- Orthopaedic
- Chest / Pulmonary
- Dental
- Cardiovascular
- Oncology
- Other Applications
- By Technology
- Computed Radiography (CR)
- Direct Radiography (DR)
- Flat-Panel Detectors
- CCD/CMOS Panels
- By Portability
- Fixed Room-Based Systems
- Portable Systems
- Hand-held Units
- Mobile Carts
- By End-User
- Hospitals
- Diagnostic Imaging Centres
- Ambulatory Surgical Centers (ASCs)
- Other End-Users
- By Geography
- North America
- United States
- Canada
- Mexico
- Europe
- Germany
- United Kingdom
- France
- Italy
- Spain
- Rest of Europe
- Asia-Pacific
- China
- India
- Japan
- Australia
- South Korea
- Rest of Asia-Pacific
- Middle East and Africa
- GCC
- South Africa
- Rest of Middle East and Africa
- South America
- Brazil
- Argentina
- Rest of South America
- North America
Data Sources, Market Sizing, and Validation
Desk Research
Desk research was used to build the starting picture of demand, supply, and regulation for digital radiography and computed radiography systems. We referenced public sources such as the US FDA device databases, OECD health statistics, World Health Organization health system indicators, World Bank macro data, and radiology society and hospital association publications, which helps frame procedure volumes and imaging capacity directionally.
In parallel, we reviewed company annual reports, investor presentations, product brochures, and reputable press coverage to understand product refresh cycles, shifts from CR to DR, and typical purchase triggers (for example, room upgrades and fleet replacement). Where needed, we also used paid subscriptions for company financials and intelligence, patent databases, and shipment-level import and export data to cross-check supplier presence and trade flows. These desk sources are not exhaustive, and we also used other public materials for data collection, validation, and clarification.
Primary Interviews and Surveys
Primary work focused on validating what is counted as a digital X-ray device sale, and then stress-testing pricing and replacement assumptions that are hard to infer from public data alone. We spoke with manufacturers, distributors, service partners, radiology administrators, and procurement or biomedical teams across APAC, EMEA, and the Americas. The discussions were used to align adoption rates, installed base replacement timing, and typical system price bands by portability and setting.
Distribution of primary research fieldwork respondents
| Company type | Respondent position | Region |
|---|---|---|
| Top tier: 36% | CXOs: 16% | APAC: 43% |
| Mid tier: 43% | Functional/Unit leaders: 32% | EMEA: 30% |
| Smaller Players: 21% | Managers: 52% | Americas: 27% |
Market-Sizing & Forecasting
Sizing started from a top-down build where imaging demand and capacity signals were reconstructed by region, and then translated into device demand using penetration and replacement logic for digital radiography and computed radiography. To keep the model grounded, we used bottom-up approximations as cross-checks, such as sampling average selling prices by system type and multiplying by estimated unit shipments or upgrade volumes, then confirming through distributor and hospital channel checks.
Inputs that were tracked (illustrative) included the shift from CR to DR, the share of portable versus fixed installations, replacement cycles for installed base systems, procedure growth in key clinical uses, and price movement driven by detector costs and product refresh timing. Where data was thin, gaps were handled by using conservative ranges confirmed in interviews, then applying region-level weights based on health infrastructure and procurement patterns.
For forecasting, scenario analysis was used, supported by short series trend methods like exponential smoothing for stable demand indicators. We then adjusted results using expert consensus on upgrade waves, budget cycles, and regulatory or reimbursement changes. The forecast was finalized only after forward assumptions were checked for internal consistency, such as whether implied unit volumes were realistic versus capacity build-outs and replacement timing.
Data Validation & Update Cycle
Findings were validated through triangulation across multiple signals, including procedure and capacity direction, trade movement where relevant, and supplier revenue and product mix commentary. Variance checks were performed at regional and global levels, and any outliers were reviewed by another analyst before sign-off. This helps catch issues like double counting retrofit activity or overstating ASPs.
The model is refreshed on an annual cycle, and interim updates are triggered when there are material events such as major regulatory actions, sudden procurement shifts, or notable technology changes that affect pricing and mix. Before delivery, we complete a fresh review pass so that the latest public indicators and new primary learnings are reflected in the final numbers.
Mordor Intelligence's Digital X Ray Devices Market Size Versus Other Published Estimates
It is normal to see different published market sizes for digital X-ray devices because teams count different product buckets, and they also treat pricing, mix, and geography in different ways. Variations can also come from whether values reflect factory-gate revenue or channel value, and how quickly assumptions are updated when portable systems gain share.
In this market, gaps usually come from what gets counted as a digital X-ray device and how closely the model follows the DR versus CR mix over time. Some estimates include dental-specific systems or service elements sold with equipment, and others keep the market limited to medical radiography device revenue. Price blending is another driver, because averaging portable and fixed-room systems without a clear mix can shift the total, especially when currency conversion timing differs by publisher. These scope and mix checks are applied consistently, then re-tested through interviews before figures are finalized by Mordor Intelligence.
Benchmark comparison
| Source | Market Size | Gaps in Research Methodology |
|---|---|---|
| Mordor Intelligence | USD 16.15 B (2026) | |
| Global Consultancy A | USD 14.23 B (2026) | Uses a narrower pricing and product mix for DR versus CR and tends to average portability without fully reflecting higher priced fixed-room installations, which reduces the implied ASP and the total. |
| Industry Publisher B | USD 14.30 B (2025) | Defines revenue at factory gate and includes related services sold with goods, and it also pulls in broader dental and associated system categories, which changes year comparability and can shift totals versus a hardware-only view. |
The spread across these numbers mainly comes from what is counted as a device sale, and how system mix and pricing are blended across fixed and portable settings. By keeping scope rules explicit and tying totals back to adoption, replacement, and pricing checks that can be re-run each year, the market size stays traceable to clear inputs instead of hidden inclusions.


Key Questions Answered in the Report
What is driving healthcare providers to replace computed radiography equipment with direct radiography systems?
Reimbursement penalties on legacy technology, combined with workflow efficiencies and radiation-dose reductions delivered by direct radiography, are prompting rapid equipment upgrades.
How are portable digital X-ray units reshaping diagnostic workflows?
Handheld and mobile systems extend imaging to emergency rooms, intensive-care beds, and home-care settings, allowing faster triage and reducing the need to move fragile patients.
Why has artificial intelligence become a key differentiator among digital X-ray vendors?
Embedded algorithms improve image quality, automate positioning, and flag potential abnormalities, enabling facilities to boost throughput and mitigate radiographer shortages.
What supply-chain challenges affect future detector availability?
Export controls on rare-earth elements used in scintillators create sourcing risk, encouraging manufacturers to diversify suppliers and explore alternative materials.
How are ambulatory surgical centers influencing purchasing decisions in the imaging industry?
Their preference for compact, easy-to-install systems that integrate seamlessly with electronic health records is encouraging vendors to develop turnkey, software-centric X-ray solutions.
In what way are retrofit detector kits supporting technology adoption in mid-tier hospitals?
Retrofit options allow facilities to convert existing rooms to digital operation without major construction, spreading capital costs over time while gaining immediate productivity benefits.
Page last updated on:


