
Market Overview
| Study Period | 2020 - 2031 |
|---|---|
| Forecast Data Period | 2026 - 2031 |
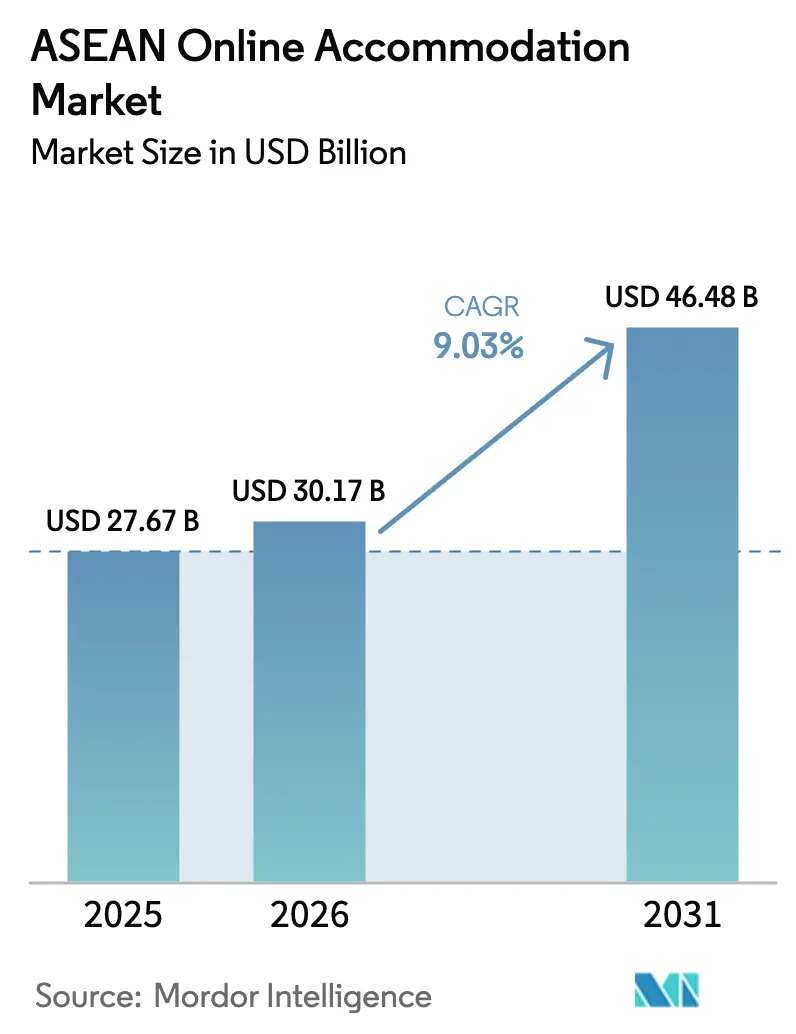
| Base Year Market Size (2025) | USD 27.67 Billion |
| Market Size (2026) | USD 30.17 Billion |
| Market Size (2031) | USD 46.48 Billion |
| Growth Rate (2026 - 2031) | 9.03 % |
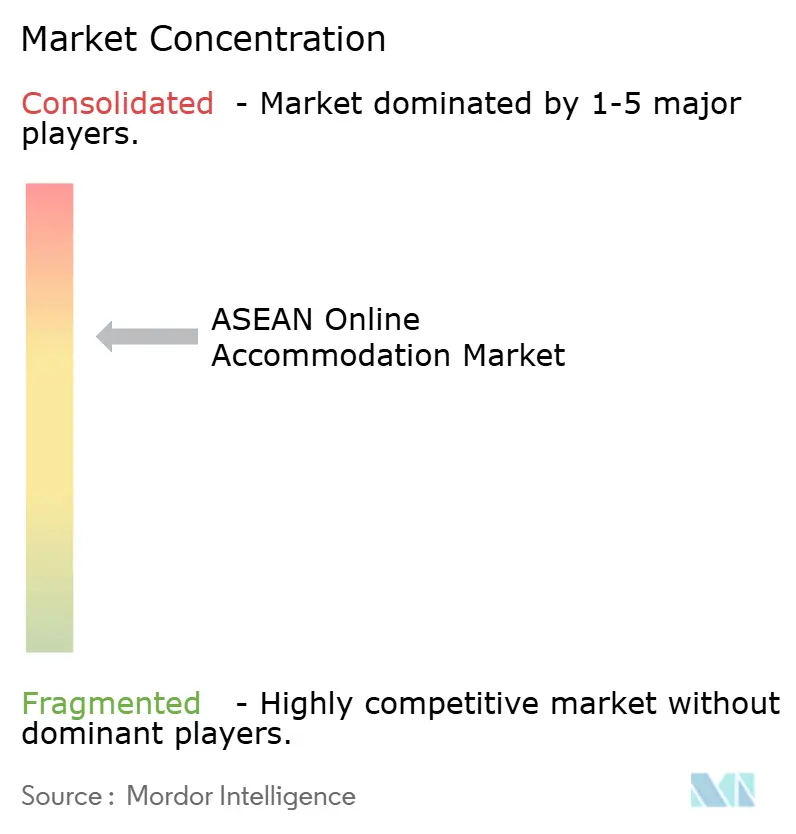
| Market Concentration | Medium |
Major Players *Disclaimer: Major Players sorted in no particular order Image © Mordor Intelligence. Reuse requires attribution under CC BY 4.0. | |
ASEAN Online Accommodation Market Analysis by Mordor Intelligence
The ASEAN Online Accommodation Market size is expected to grow from USD 27.67 billion in 2025 to USD 30.17 billion in 2026 and is forecast to reach USD 46.48 billion by 2031 at 9.03% CAGR over 2026-2031.
Growing smartphone penetration that already exceeds 80% in large member economies, seamless QR-based cross-border payments, and a rapid rebound in international arrivals continue to propel digital booking volumes. Demand momentum is reinforced by low-cost carrier (LCC) route expansions that cut average intra-ASEAN fares significantly, making secondary leisure destinations more accessible. Government visa-free entry programs, especially Thailand’s 60-day stay policy for 93 countries, complement the post-pandemic “revenge travel” surge, while new digital-nomad visa schemes in the Philippines and Thailand nurture a lucrative workcation segment. Competitive intensity within the online travel agency (OTA) market remains significant. The leading OTAs dominate a considerable share of bookings and allocate substantial resources toward marketing efforts in the first quarter of 2024. Despite the competitive landscape, participation in OTA platforms enhances the average hotel’s return on assets by providing incremental exposure, which contributes to improved financial performance.
Key Report Takeaways
- Mobile applications are projected to dominate the platform segment, accounting for a substantial market share of 55.63% of the ASEAN Online Accommodation Market in 2025. Furthermore, this sub-segment is anticipated to expand at a strong CAGR of 14.63% during the forecast period from 2026 to 2031.
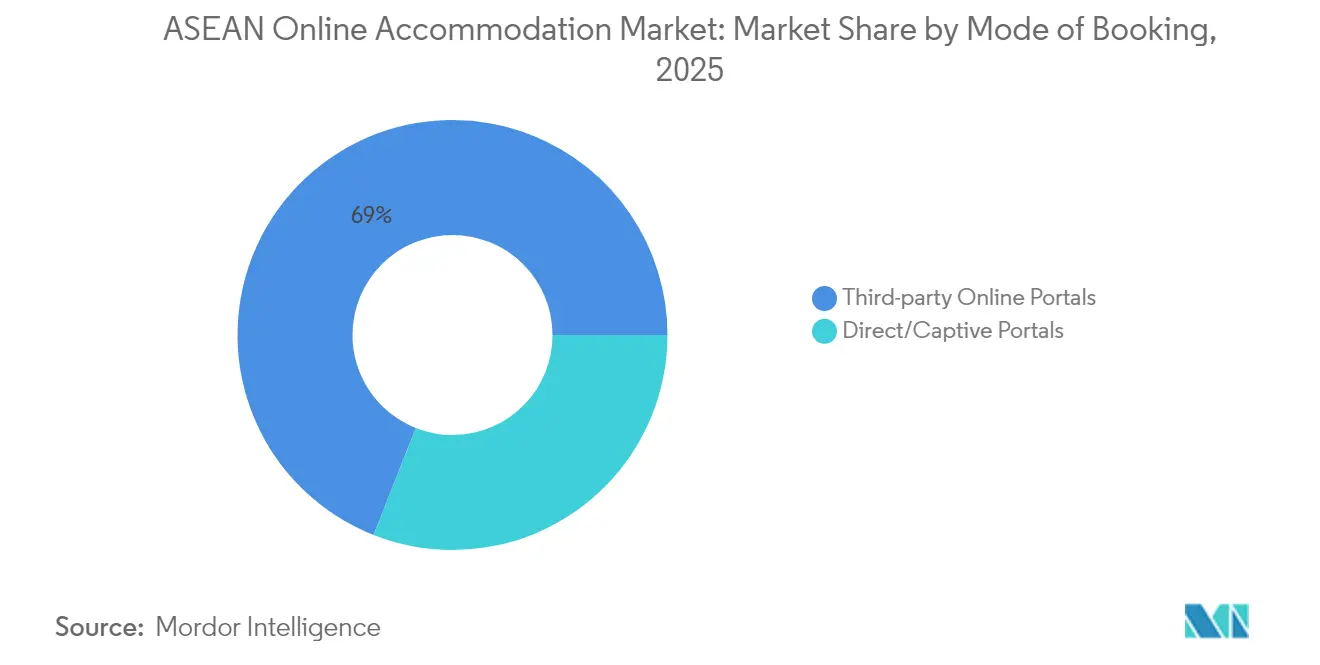
- Third-party online portals are expected to lead the mode of booking category, capturing a significant share of 69.02% of the ASEAN Online Accommodation Market in 2025. Meanwhile, direct or captive portals in ASEAN Online Accommodation Market are forecasted to exhibit the highest growth rate, with a CAGR of 15.51% over the same forecast period.
- Within the property type segment, hotels and resorts are estimated to hold the largest share of 50.61% of the ASEAN Online Accommodation Market in 2025. However, alternate lodgings in ASEAN Online Accommodation Market are identified as the fastest-growing sub-segment, with a notable CAGR of 18.32% projected for 2026-2031.
- From a geographical perspective, Vietnam is expected to secure a leading position with a 25.12% market share of the ASEAN Online Accommodation Market in 2025. On the other hand, Thailand in ASEAN Online Accommodation Market is projected to witness accelerated growth, with a CAGR of 12.78% during the forecast period.
Note: Market size and forecast figures in this report are generated using Mordor Intelligence’s proprietary estimation framework, updated with the latest available data and insights as of 2026.
ASEAN Online Accommodation Market Trends and Insights
Drivers Impact Analysis*
| Driver | (~) % Impact on CAGR Forecast | Geographic Relevance | Impact Timeline |
|---|---|---|---|
| Low-cost carrier expansion | +2.1% | ASEAN corridor routes | Medium term (2-4 years) |
| Cross-border QR payment interoperability | +1.8% | TH, MY, ID, VN, SG | Short term (≤2 years) |
| Post-pandemic “revenge travel” | +2.3% | ASEAN-wide | Short term (≤2 years) |
| Visa-free entry programs | +1.9% | TH, MY, PH | Medium term (2-4 years) |
| Remote work “workcation” policies | +1.2% | PH, TH, ID | Long term (≥4 years) |
| Super-app ecosystem cross-selling | +1.4% | SG, ID, MY | Medium term (2-4 years) |
| Source: Mordor Intelligence | |||
Growth of Low-Cost Carriers Boosting Intra-ASEAN Leisure Trips
Low-cost carriers, including AirAsia, Scoot, and Cebu Pacific, have strategically increased point-to-point routes, effectively bypassing traditional hub airports. This operational shift has driven significant growth in passenger traffic at secondary airports, highlighting the evolving dynamics of air travel demand. Additionally, the substantial reduction in average leisure fares on key routes, such as Kuala Lumpur to Bangkok and Jakarta to Phuket, has further stimulated travel activity. This fare decline has particularly encouraged weekend travel among middle-income households, reflecting a shift in consumer behavior and preferences within the aviation market. The widened network footprint feeds directly into incremental room nights for emerging beach, cultural, and eco-tourism destinations that previously lacked international lift. Sustained LCC orderbooks for narrow-body aircraft signal capacity growth through the late-2020s, anchoring a durable demand engine for the ASEAN online accommodation market[1]Asian Development Bank, “ADB Forecasts Developing Asia’s Economy to Grow 4.9% in 2024,” adb.org .
Digital Payments Interoperability (QR-Code Cross-Border)
Central-bank-led collaboration has linked domestic e-wallet schemes so that Thai, Malaysian, Indonesian, Vietnamese, and Singaporean tourists can scan familiar QR codes abroad and settle in their home currency. For small and mid-scale lodging operators, the ability to collect digital payments without foreign-merchant accounts removes a key barrier to online distribution. According to industry case studies, implementing streamlined checkout processes significantly enhances booking completion rates, with an observed increase when compared to systems that rely solely on card payment options. This highlights the importance of optimizing payment flows to improve user experience and drive higher conversion rates. Over the next two years, the network is slated to expand to Cambodia, Laos, and the Philippines, making frictionless payments a near-universal feature across the ASEAN online accommodation market.
Post-Pandemic Pent-Up Demand for “Revenge Travel”
The ongoing impact of lockdown fatigue has shifted consumer behavior, with travelers increasingly prioritizing experiential value over material consumption. This trend has resulted in extended travel itineraries and higher daily expenditures. By the end of 2024, ASEAN tourism is projected to recover to 2019 arrival levels. Survey insights indicate a growing trend among households, with a significant proportion planning to undertake two or more international leisure trips annually through 2026. Vietnam and Thailand, in particular, have reported occupancy rates exceeding in key urban and resort hubs, while average daily rates have surpassed pre-pandemic benchmarks. This sustained consumer willingness to spend is driving growth across both traditional hotel chains and premium alternative accommodations, thereby reinforcing revenue streams for hospitality platforms and operators. The data underscores a robust recovery trajectory for the region's tourism sector, supported by evolving consumer preferences and spending patterns[2]Savarin Luxury Property, “Thailand’s Hotel Industry: Bright Outlook Continues in 2025,” savarinluxprop.com .
Government Visa-Free Entry Programs
Thailand’s decision to waive visas for citizens of 93 countries and allow 60-day stays sets a high regional bar for facilitation[3]VnExpress, “Which Southeast Asian Country Welcomes Highest Number of American Tourists?” vnexpress.net . The Destination Thailand Visa, which permits multiple 180-day entries over five years, is strategically designed to attract digital nomads, long-term retirees, and repeat leisure travelers. Malaysia and the Philippines have implemented comparable initiatives, reflecting a regional trend toward targeting these high-value visitor segments. Preliminary arrival data for 2024-2025 highlights a significant double-digit increase in travelers from the United States and Europe. This influx of extended-stay visitors, who typically prefer accommodations with higher nightly rates and flexible options, is driving a notable rise in premium demand within the ASEAN online accommodation market, underscoring a shift toward more lucrative customer demographics.
Restraints Impact Analysis*
| Restraint | (~) % Impact on CAGR Forecast | Geographic Relevance | Impact Timeline |
|---|---|---|---|
| Fragmented taxation & short-stay regulations | -1.3% | MY, TH, VN, PH | Long term (≥4 years) |
| High OTA customer-acquisition cost | -0.9% | ASEAN-wide | Medium term (2-4 years) |
| Limited rural broadband coverage | -0.7% | ID, PH, MM, LA | Long term (≥4 years) |
| Currency volatility | -0.6% | ASEAN-4 | Short term (≤2 years) |
| Source: Mordor Intelligence | |||
Fragmented Taxation and Short-Stay Regulations Across ASEAN
Businesses operating in the Southeast Asian hospitality sector face significant challenges due to varying hotel and tourism levies across the region. For instance, Malaysia enforces a straightforward flat RM10 tourism tax, whereas Thailand implements a more intricate framework that includes a multi-layer VAT and TM.30 guest-registration requirements. Providers of alternative accommodations encounter additional complexities, as they must navigate unclear zoning regulations and condominium bylaws. These regulatory ambiguities contribute to the proliferation of a gray market, which undermines the competitiveness of licensed operators. The inconsistent enforcement of these regulations further exacerbates the issue, placing compliant businesses at a disadvantage due to higher operational costs. This disparity not only erodes their price competitiveness but also impedes the overall professionalization and growth of the ASEAN online accommodation market.
High Customer-Acquisition Cost on OTAs
Independent hotels, particularly those with limited negotiating leverage, experience significant margin erosion due to commission rates applied to room revenue. While leveraging Online Travel Agencies (OTAs) increases overall occupancy levels and has been demonstrated to improve return on assets by approximately 3 percentage points, many properties encounter difficulties in securing the necessary capital for strategic investments. These investments, which are critical for reducing long-term distribution expenses, include the development of direct-booking platforms, implementation of loyalty programs, and execution of digital marketing strategies. The financial strain is especially severe in secondary markets, where Average Daily Rates (ADRs) remain relatively low, yet commission rates persist at consistent levels, further compressing profitability.
*Our forecasts treat driver/restraint impacts as directional, not additive. The impact forecasts reflect baseline growth, mix effects, and variable interactions.
Segment Analysis
By Platform: Mobile Applications Drive Digital-First Booking Behaviors
Mobile Apps accounted for 55.63% of the ASEAN online accommodation market share in 2025, dwarfing desktop channels as travellers pivot to on-the-go planning. Indonesia exemplifies this shift, with more than half of OTA users booking via smartphones as early as 2018. The convenience of fingerprint login saved traveller profiles, and e-wallet checkout underpins a forecast 14.63% CAGR for mobile bookings through 2031. Website interfaces remain relevant for complex multi-city itineraries and corporate travel, yet their growth lags that of app-centric channels.
The ascendancy of apps dovetails with super-app monetization strategies that fuse transport, food delivery, and lodging into a single user journey. Enhanced push-notification targeting and AI-based price alerts further raise app engagement, siphoning share from both traditional desktop portals and call-centre bookings. Regulators, meanwhile, are codifying mobile payment standards that recognize the app as the default commerce environment, cementing its primacy in the ASEAN online accommodation market.




By Mode of Booking: Third-Party Portals Maintain Distribution Dominance Despite Direct Channel Growth
Third-party portals captured 69.02% of the total 2025 transaction value thanks to their deep inventory pools and metasearch visibility. Even so, direct/captive portals will post the fastest growth—15.51% CAGR—as chains deploy dynamic-packaging engines, member-only rates, and cashback rewards. Hotels aim to claw back share to ease commission drag, but outcome success hinges on competitive parity with OTAs’ seamless UX, multilingual support, and instant confirmation.
Independent properties, especially in rural or island locations, still lean heavily on OTAs for reach. For them, the ASEAN online accommodation market size attributable to direct sales remains limited by marketing budgets and technology gaps. Aggregator strength is likely to persist, but its share edge could narrow by the late 2020s as loyalty ecosystems and white-label booking solutions mature.
By Property Type: Alternative Lodgings Capitalize on Experience-Driven Travel Demand
Hotels & Resorts retained a 50.61% slice of the 2025 transaction value, benefiting from established brands and corporate demand. Yet, Alternate Lodgings, glamping tents, farm-stays, and boutique villas clock the fastest trajectory at 18.32% CAGR. Rural Vietnam now counts 11 government-endorsed ecological farms that blend lodging with agritourism workshops, while Philippine farm-stay clusters around CALABARZON report occupancy uplift after digital onboarding to major OTAs.
Premium short-term rental properties on select Thai islands generate significant annual host revenues, often exceeding USD 40,000. While hostels and budget hotels continue to cater to the preferences of Gen Z backpackers, the upscale experiential accommodation segment is experiencing the most rapid expansion. This growth is driven by a rising consumer demand for authentic, immersive experiences and visually appealing properties that align with social media trends, particularly those suitable for platforms like Instagram.
Geography Analysis
Vietnam commanded 25.12% of the ASEAN online accommodation market size in 2025 as post-COVID recovery reached near-full normalization. American inbound searches rank the country top among ASEAN peers, funneling traffic to both coastal resorts and new inland farm-stays. Regulatory clarity around VAT and personal-income tax for home-stay operators, although burdensome, helps formalize supply and instill traveler confidence.
Thailand’s pace-setting growth stems from destination marketing that positions the kingdom as both a wellness mecca and a flexible remote-work base. Permanent visa-free status for Chinese travelers and 60-day stays for 93 nationalities decrease planning friction. Domestic developers and global brands are reacting: Centara Life, lyf and Novotel have announced or inaugurated dozens of mixed-use properties catering to millennials, long-stay professionals and families. Regulatory grey zones persist for condo-based short-term rentals, yet sustained political will to align rules with demand could unlock fresh inventory. Indonesia benefits from a diversified archipelago where Bali still reigns, but “10 New Balis” campaigns funnel infrastructure spending toward Mandalika, Labuan Bajo and Lake Toba. The World Travel & Tourism Council sees international visitor spending hitting record highs in 2025, translating into robust booking throughput. Meanwhile, Malaysia’s linked payments with Singapore and Thailand, plus the Philippines’ June 2025 digital-nomad visa, add competitive texture to the ASEAN online accommodation market landscape. Smaller economies—Cambodia, Laos, Myanmar and Brunei—stand to capture spillover when main hubs reach peak occupancy, provided broadband and airlift gaps close.
Regulatory Landscape
Regulation for online accommodation across ASEAN is shaped by a mix of regional tourism frameworks and country-by-country rules covering licensing, guest registration, and taxation. The ASEAN Tourism Sectoral Plan 2026-2030 and the ASEAN Tourism Marketing Strategy 2026-2030 set a shared direction for resilient, digital, and sustainable tourism, while ASEAN tourism standards such as ASEAN Green Hotel and Homestay standards function as voluntary harmonization tools adopted through national programs.
On the digital side, ASEAN workstreams under the ASEAN Digital Masterplan 2025 outline principles-based guidance for digital platform regulation, reinforcing expectations on platform governance, data handling, and consumer protection. Indonesia stands out in its enforcement approach for accommodation listings, with the Ministry of Tourism announcing in May 2026 an API-based verification approach that links OTA listings to the government Online Single Submission (OSS) licensing system. OTA-OSS integration is scheduled to start in June 2026, and delisting pressure on unlicensed operators was flagged for August 2026, shifting compliance from manual checks toward automated oversight.
Value Chain Analysis
The ASEAN online accommodation value chain begins with accommodation supply creation and compliance (hotels, resorts, serviced apartments, and alternative lodging hosts), then moves through digitization and distribution using property management systems, channel managers, payment gateways, and identity and guest-registration processes where applicable. Demand is aggregated by OTAs and metasearch, alongside direct or captive hotel portals, while marketing technology (search, affiliates, app push, and loyalty tools) drives customer acquisition and conversion. Post-booking operations are handled through customer support, refunds, reputation management, and review ecosystems.
Value capture is concentrated in large platforms that control traffic and merchandising, while hotels and alternative lodging operators absorb commission costs and operational requirements such as tax collection, invoicing, and local reporting. Interoperable cross-border QR payments reduce checkout friction for smaller properties that previously needed card acceptance or foreign-merchant setups, which supports higher completion rates for mobile bookings. Bottlenecks also persist from fragmented national rules for short-stay inventory, uneven rural connectivity in parts of Indonesia and the Philippines, and workforce constraints at properties that can limit service delivery even when online demand is strong.
Competitive Landscape
Oligopolistic dynamics define the marketplace: Booking Holdings, Expedia Group, Trip.com Group, Traveloka, and Agoda collectively hold a significant share, enabling scale advantages in search-engine marketing, loyalty programs, and AI-driven personalization. Regional challengers leverage localization—language, payment methods, and after-sales support—to defend niche strongholds, while super-app entrants Grab and GoTo exploit embedded user bases to cross-sell hotels at marginal acquisition cost.
Product innovation is relentless. Booking.com unveiled generative-AI trip assistants in late 2024, and Centara rolled out chat-based booking bots in early 2025, aiming to lift direct share among Gen Z. Asset-light virtual-hotel brands sign revenue-share deals with independent properties, supplying centralized pricing algorithms and brand standards in exchange for inventory. Compliance complexity around taxation, data residency, and guest registration favors well-capitalized platforms that maintain legal teams across all ten ASEAN jurisdictions.
The supply side is equally active. Ascott added more than 3,400 units via 28 Southeast Asia signings in 2024, focusing on co-living label lyf to target digital natives. Accor’s Swissôtel Bangkok Pratunam and Centara’s Indonesian debut bolster upscale room counts. Alternative-accommodation specialists expand vetted host programs to raise consistency and meet traveler expectations for hygiene and safety. With the top five brokers still controlling over three-quarters of gross bookings, the ASEAN online accommodation market remains tightly held despite a steady flow of new niche entrants.
ASEAN Online Accommodation Industry Leaders
Booking Holdings (Booking.com, Agoda)
Traveloka
Expedia Group
Airbnb Inc.
Trip.com Group
- *Disclaimer: Major Players sorted in no particular order

Market Opportunities and Future Outlook
Super-app and ecosystem integration remains a clear whitespace where OTAs, airlines, and local platforms can bundle lodging with mobility, attractions, and payments into a single flow, especially as cross-border QR interoperability expands across core ASEAN corridors. Government-led digital tourism programs also create an adoption pull for online distribution and data-enabled operations. For example, Vietnam approved the National Digital Economy and Digital Society Development Programme 2026-2030 (Decision No. 1033/QD-TTg), which sets a target for 70% of tourism establishments to use digital platforms by 2030, expanding the addressable base for booking, payments, and property onboarding.
Accommodation supply expansion and event-led destination buildouts are widening the range of bookable inventory for platforms, with activity concentrated in Vietnam and Thailand. In July 2026, Accor and Sun Group announced a partnership to develop more than 5,300 keys across Vietnam, while Sun Group advanced large-scale Phu Quoc developments tied to APEC 2027. These initiatives support a pipeline of room nights that favors platforms with strong merchandising and international reach. A second opportunity area is sustainability-led and standards-aligned merchandising, where ASEAN-wide standards provide a shared taxonomy that OTAs and direct channels can convert into filters, badges, and dynamic packaging for high-value travelers.
Recent Industry Developments
- July 2026: Booking Holdings moved to form a new B2B business unit under Agoda CEO Omri Morgenshtern, bringing Booking.com, Agoda, and Priceline closer for partner-led distribution. The shift supports deeper connectivity with airlines, hotels, and other travel sellers while reducing dependence on purely consumer-facing performance marketing. It also reinforces scale advantages for regional inventory sourcing and rate parity management across ASEAN.
- September 2025: Trip.com Group and Traveloka announced a strategic distribution alliance to pool outbound Chinese and regional Southeast Asian traffic. The tie-up broadened cross-border reach for both platforms across key ASEAN destinations and increased competitive pressure on standalone OTAs through shared demand generation. It also strengthened inbound-to-ASEAN merchandising for multi-country itineraries where platform breadth matters.
- January 2024: Thailand implemented permanent visa-free entry for Chinese nationals, reinforcing its visitor-volume targets. Easier entry improved booking conversion for Thailand-bound travel across major OTAs and supported higher utilization of hotel and alternative lodging inventory during peak periods. The policy also pushed platforms to prioritize Chinese-language content, payments, and customer service workflows in Thailand listings.


Research Methodology Framework and Report Scope
Market Definition and Coverage
This market counts the value of accommodation stays in ASEAN that are booked through online channels, covering hotels, resorts, hostels, vacation rentals, and other alternate lodgings when the booking is made digitally.
Scope exclusions: Offline-only bookings and non-accommodation travel components (such as air tickets and local transport) are excluded from this sizing.
Segmentation Overview
- By Platform
- Mobile Application
- Website
- By Mode of Booking
- Third-party Online Portals
- Direct/Captive Portals
- By Property Type
- Hotels & Resorts
- Vacation Rentals
- Hostels & Budget Accommodations
- Alternate Lodgings (Glamping, Farm-stays)
- By Geography
- Indonesia
- Thailand
- Malaysia
- Philippines
- Vietnam
- Singapore
- Cambodia
- Laos
- Myanmar
- Brunei
Data Sources, Market Sizing, and Validation
Desk Research
To anchor the model in real demand signals, we started with public travel and tourism series that describe visitor flows and lodging activity across ASEAN. Sources used for this step included, as examples, UN Tourism country dashboards, World Bank travel and services indicators, national tourism boards and statistics agencies in ASEAN, and central bank or national accounts releases that track travel receipts.
Next, the structure of online booking adoption and the likely mix of property types were refined using company annual reports and investor decks from listed travel and lodging operators, along with reputable press coverage and association websites tied to hospitality. In a few places, we also referenced paid subscriptions that help with company financials and intelligence, and a separate news and financials database to confirm timing of major demand shifts. This list is not exhaustive, and many other sources were reviewed for data collection, validation, and clarification.
Primary Interviews and Surveys
Primary work focused on validating what part of accommodation demand is actually booked online, and how the average booking value has been moving across key ASEAN destinations. We spoke with a mix of booking intermediaries, property operators, and supporting ecosystem participants, and we checked feedback across Singapore, Malaysia, Indonesia, Thailand, and the rest of ASEAN to reduce single-country bias.
Distribution of primary research fieldwork respondents
| Company type | Respondent position |
|---|---|
| Top tier: 34% | CXOs: 16% |
| Mid tier: 46% | Functional/Unit leaders: 32% |
| Smaller Players: 20% | Managers: 52% |
Market-Sizing & Forecasting
Sizing was built using a top-down and bottom-up approach, where the demand pool was first reconstructed from travel activity and accommodation utilization, and then stress-tested using sampled price and volume checks. On the top-down side, we translated inbound and domestic travel patterns into booked room nights and stay values, and then applied an online booking share to isolate the digital channel.
A few market-specific inputs were tracked closely because they move the total quickly, namely tourist arrivals and domestic trip volumes, average length of stay, occupancy and room supply trends, the split between hotels and alternate lodgings, and average booking value progression (driven by room-rate inflation and mix shift toward higher value stays in peak periods). Bottom-up checks were used selectively by rolling up revenue signals from representative online channels and triangulating them with property-side conversion and commission norms, with gaps handled by using country-level proxies when direct data points were thin.
Forecasting relied mainly on scenario analysis, since travel cycles in ASEAN can change sharply with airfare costs, visa policies, and capacity additions. Assumptions for key drivers such as arrivals growth, room supply additions, and online penetration were adjusted using consensus ranges shared by primary respondents, and then applied consistently across the forecast years.
Data Validation & Update Cycle
Outputs were cross-checked against independent signals such as tourism receipts, lodging supply additions, and visible shifts in pricing and occupancy, and then reconciled where variances looked structurally too high or too low. When an inconsistency showed up, the underlying assumption was revisited, followed by a second pass that rechecks formulas, conversions, and country totals before sign-off.
Reports are refreshed annually, and interim updates are triggered when material events occur, such as sudden policy changes affecting arrivals or a sharp regional pricing swing. Before delivery, an analyst performs a fresh validation pass so that clients receive the latest updated view tied to the same repeatable steps.
Mordor Intelligence's Asean Online Accommodation Market Size Versus Other Published Estimates
Published market values for online accommodation in ASEAN can look far apart, even when they appear to cover the same space. The differences usually come from how each publisher treats currency timing, how average booking value is updated, and whether the scope stays strictly on accommodation or expands into wider online travel.
If FX conversion is done using a different month or year average, or if room-rate inflation is applied as a flat uplift without checking country mix and seasonality, the total can swing quickly. A refresh-led approach that rechecks ASP movement against recent hotel rate signals, then revalidates online booking share with fresh field inputs before the cut-off date, is what keeps the 2025 value aligned in Mordor Intelligence.
Benchmark comparison
| Source | Market Size | Gaps in Research Methodology |
|---|---|---|
| Mordor Intelligence | USD 27.67 B (2025) | |
| Trade Journal B | USD 24.00 B (2025) | Uses a narrower accommodation definition that leans toward hotel-only online bookings in major destinations, and applies conservative FX conversion that reduces multi-currency totals when expressed in USD. |
| Regional Consultancy A | USD 33.50 B (2025) | Blends accommodation with broader online travel spend in parts of the estimate, and inflates average booking value using a generalized price uplift without consistent checks on stay length and property-type mix. |
The spread in the table is mainly explained by what is counted as accommodation-only value, plus how pricing and currency are refreshed close to the base year. By tying totals back to clear travel volume signals and a repeatable ASP and online-share logic, the estimate stays easier to audit and update when new tourism and rate data comes in.


Key Questions Answered in the Report
How large is the ASEAN online accommodation market in 2026?
The ASEAN online accommodation market size stood at USD 30.17 billion in 2026 and is projected to exceed USD 46.48 billion by 2031.
What is the expected growth rate for online lodging bookings in Southeast Asia?
The market is forecast to register a 9.03% CAGR between 2026 and 2031, lifted by mobile adoption, open-visa policies and LCC connectivity.
Which booking channel is growing fastest within Southeast Asia?
Direct or captive portals are expanding the quickest, with a 15.51% CAGR outlook as hotel groups invest in loyalty apps and member-only rates.
Why are alternative lodgings gaining popularity among ASEAN travelers?
Travelers seek unique, immersive experiences such as farm-stays and glamping; this preference propels alternative lodging bookings at a 18.32% CAGR.
Which country currently leads Southeast Asia in online accommodation revenue?
Vietnam held the largest geographic share at 25.12% in 2025, buoyed by a near-complete tourism rebound and diversified lodging options.
How do visa policies influence booking trends across ASEAN?
Expanded visa-free and digital-nomad schemes in Thailand, the Philippines and Malaysia lower travel barriers, directly boosting room-night demand across the region.
Page last updated on:


 Your data is secure and never sold or shared.


