
Market Overview
| Study Period | 2020 - 2031 |
|---|---|
| Forecast Data Period | 2026 - 2031 |
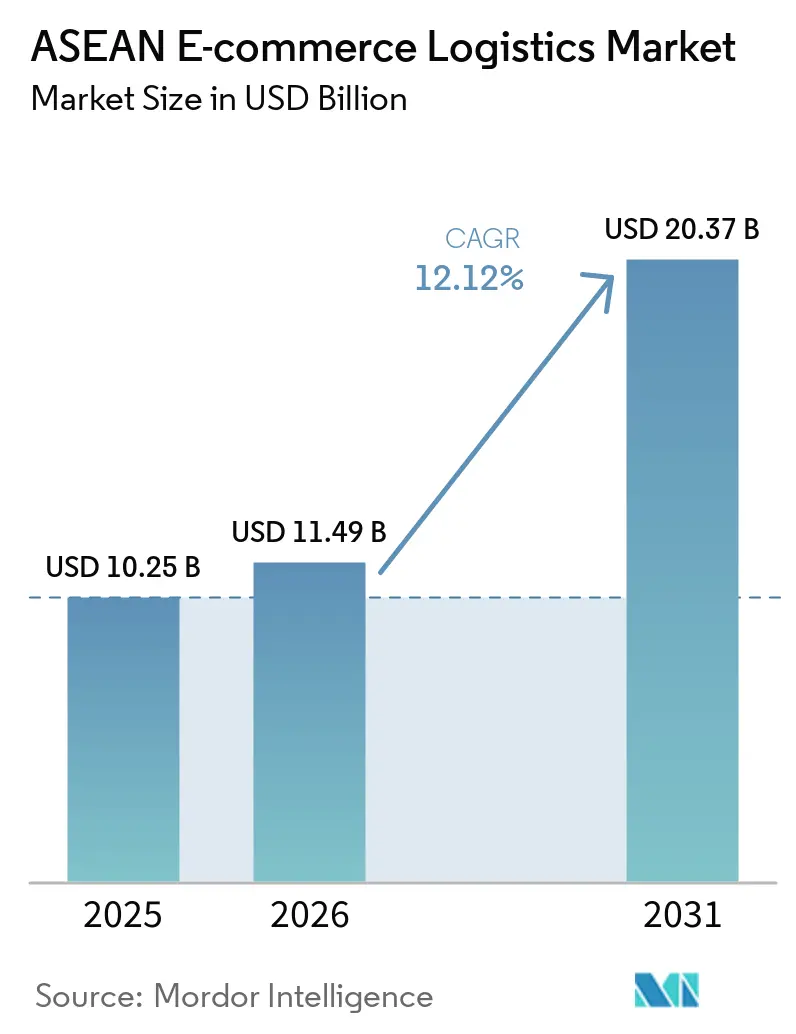
| Base Year Market Size (2025) | USD 10.25 Billion |
| Market Size (2026) | USD 11.49 Billion |
| Market Size (2031) | USD 20.37 Billion |
| Growth Rate (2026 - 2031) | 12.12 % |
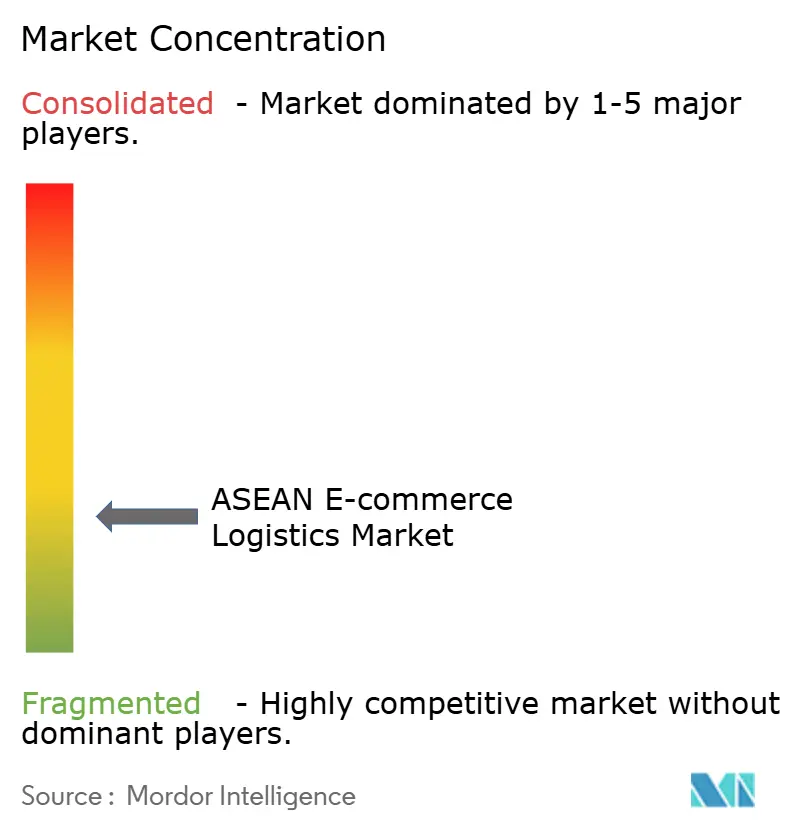
| Market Concentration | Low |
Major Players *Disclaimer: Major Players sorted in no particular order Image © Mordor Intelligence. Reuse requires attribution under CC BY 4.0. | |
ASEAN E-commerce Logistics Market Analysis by Mordor Intelligence
The ASEAN E-commerce Logistics Market size was valued at USD 10.25 billion in 2025 and estimated to grow from USD 11.49 billion in 2026 to reach USD 20.37 billion by 2031, at a CAGR of 12.12% during the forecast period (2026-2031).
Platform consolidation, social-commerce momentum, and digital-payment ubiquity are accelerating parcel volumes, while infrastructure projects such as Indonesia’s Tol Laut corridor expand multimodal capacity. Same-day and cross-border services are the fastest-rising niches, supported by dark-store networks, AI-driven routing, and the partial roll-out of the ASEAN Single Window. Competitive intensity remains moderate as regional specialists, platform-owned arms, and global integrators battle for share; technology investment and neutral, multi-platform positioning increasingly influence contract awards. Structural headwinds labor shortages, regulatory fragmentation, and urban congestion taxes temper margins even as autonomous warehouses and electric two-wheelers alleviate cost pressures.
Key Report Takeaways
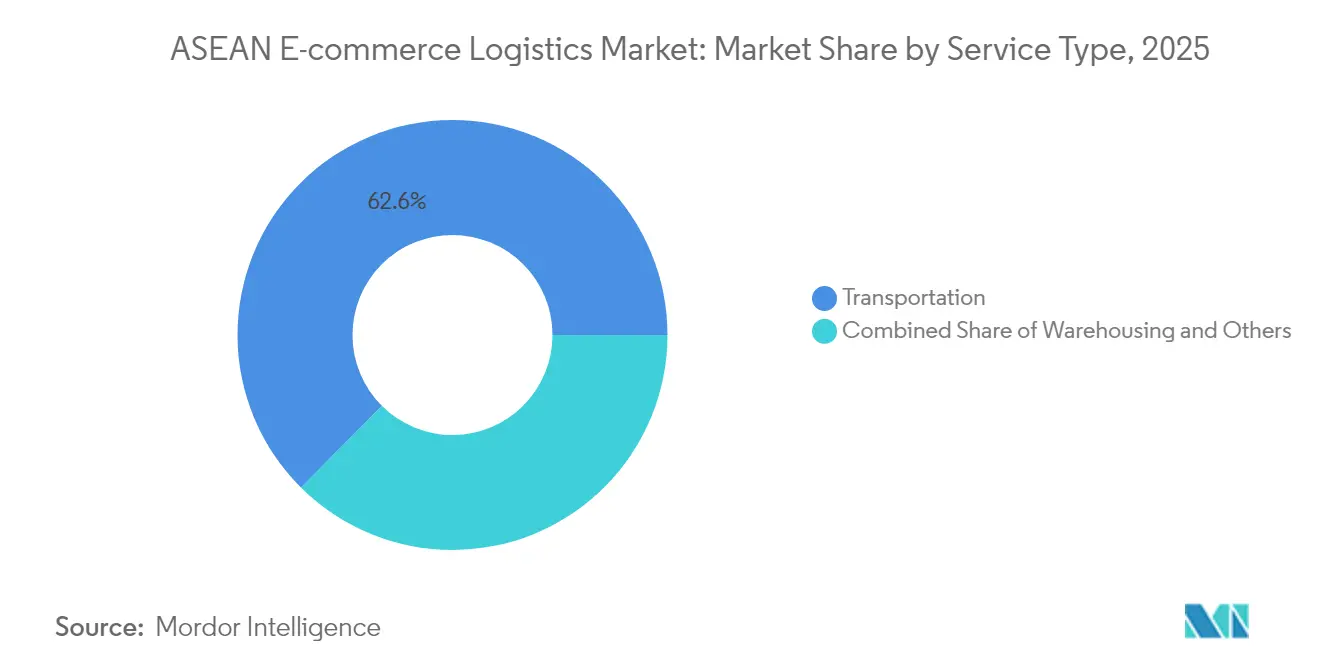
- By service, transportation led with 62.55% of the ASEAN e-commerce logistics market share in 2025.
- Warehousing & fulfillment is projected to expand at an 8.09% CAGR through 2031.
- By business model, B2C held 68.20% share of the ASEAN e-commerce logistics market size in 2025.
- C2C transactions record the highest projected CAGR at 8.77% through 2031.
- By destination, domestic logistics commanded 62.70% share of the ASEAN e-commerce logistics market size in 2025, while cross-border flows are advancing at a 7.03% CAGR.
- By delivery speed, same-day fulfillment is growing at 7.39% CAGR through 2031.
- By product category, fashion & lifestyle captured 26.60% of the ASEAN e-commerce logistics market share in 2025; foods & beverages is expanding at 7.80% CAGR.
- Indonesia, the largest country market, accounted for 30.80% share in 2025; Vietnam posts the fastest growth at 6.22% CAGR to 2031.
Note: Market size and forecast figures in this report are generated using Mordor Intelligence’s proprietary estimation framework, updated with the latest available data and insights as of 2026.
Market Trends and Insights
Drivers Impact Analysis of ASEAN E-commerce Logistics Market*
| Driver | % Impact on CAGR Forecast | Geographic Relevance | Impact Timeline |
|---|---|---|---|
| Accelerated growth of ASEAN-based e-commerce marketplaces | 3.2% | Indonesia, Thailand, Vietnam, Philippines | Medium term (2-4 years) |
| Rapid expansion of BNPL & digital wallets boosting checkout-conversion | 2.1% | Global ASEAN, strongest in Singapore, Malaysia | Short term (≤ 2 years) |
| Government-funded national logistics corridors | 1.8% | Indonesia, Vietnam, Thailand | Long term (≥ 4 years) |
| Rising cross-border social-commerce flows within CLMV sub-region | 1.5% | Cambodia, Laos, Myanmar, Vietnam | Medium term (2-4 years) |
| On-demand dark-store networks enabling 2-hour delivery windows | 1.3% | Urban centers: Jakarta, Bangkok, Ho Chi Minh City, Manila | Short term (≤ 2 years) |
| Gen-AI-driven route-optimisation lowering per-parcel cost by >12% | 1.1% | Technology-advanced markets: Singapore, Malaysia, Thailand | Medium term (2-4 years) |
| Source: Mordor Intelligence | |||
Accelerated Growth of ASEAN-Based E-Commerce Marketplaces
Shopee’s 28.4% social-commerce share and TikTok Shop’s viral selling model concentrate traffic on integrated checkout-logistics rails, shifting parcel flows toward venues that can support split payments and real-time tracking. IDC forecasts regional GMV of USD 325 billion by 2028, with digital payments reaching 94%, eliminating cash-handling delays. The end of exclusive deals such as J&T Express–Shopee Indonesia forces carriers to diversify and invest in neutral APIs that accept orders from multiple storefronts. Cross-border marketplace integration worth USD 14.6 billion by 2028 drives demand for multi-currency settlement and harmonised customs workflows. Logistics providers able to plug simultaneously into several mega-platforms capture disproportionate volume as winner-take-all dynamics escalate[1]“Tol Laut Maritime Logistics Program,” Government of Indonesia, indonesia.go.id.
Rapid Expansion of BNPL and Digital Wallets Boosting Checkout Conversion
Digital wallets already settle 34% of logistics-sector invoices and accelerate order frequency by cutting checkout friction. BNPL widens consumer credit access; transaction-level analysis across 1 billion users links the product to higher basket sizes and merchant acceptance in card-scarce markets. In Indonesia, pay-later schemes lift impulsive fashion purchases, whereas COD persists among risk-averse shoppers, obliging carriers to operate dual workstreams for prepaid and cash segments. Wallet usage is set to pass 50% of global e-commerce by 2025, intensifying working-capital complexity for last-mile firms that settle funds to merchants, couriers, and platforms in near real time[2]“Opening the Black Box of Digital Wallets,” Cong et al., cepr.org.
Government-Funded National Logistics Corridors
Public capex lowers structural bottlenecks across the ASEAN e-commerce logistics market. Indonesia’s Tol Laut maritime network, expanded from 6 to 30 routes, narrows inter-island price gaps by up to 20%. The China-Laos Railway cuts Kunming–Vientiane freight time from three days to under 15 hours, opening new land links for CLMV sellers. Thailand’s land-bridge plan, slated for 2028–2030, could shave two days off Gulf-to-Andaman shipping. Vietnam channels USD 40 billion annually into logistics assets yet still pays logistics costs exceeding 20% of GDP, underscoring the magnitude of unfinished capacity. Private 3PLs leverage state-built corridors to scale at lower capital intensity while expanding rural reach.
Rising Cross-Border Social-Commerce Flows Within CLMV
Social-first platforms turn Cambodia, Laos, Myanmar, and Vietnam into micro-export hubs, unlocking arbitrage on labor and product sourcing. Regional social-commerce GMV may hit USD 42 billion by 2025, outpacing traditional shopping carts. The China-Laos Railway provides an overland option for time-sensitive parcels previously relegated to slower sea freight. Digital wallets and BNPL flatten cross-border payment pain points, while micro-fulfillment centers near border zones shorten cycle times. Logistics firms capturing CLMV flows gain an early stake in an ecosystem still lightly penetrated by global giants[3]“ASEAN Single Window Progress Report,” ASEAN Secretariat, asean.org.
Restraints Impact Analysis of ASEAN E-commerce Logistics Market*
| Restraint | % Impact on CAGR Forecast | Geographic Relevance | Impact Timeline |
|---|---|---|---|
| Fragmented customs clearance rules across ASEAN single window | -1.8% | Cross-border operations, particularly Indonesia-Malaysia-Thailand corridor | Medium term (2-4 years) |
| Chronic middle and last-mile labour shortages in tier-2/3 cities | -2.3% | Vietnam, Philippines, Indonesia rural areas | Long term (≥ 4 years) |
| Escalating urban congestion taxes raising last-mile costs | -1.2% | Jakarta, Manila, Bangkok | Short term (≤2 years) |
| Elevated logistics cost structures above global benchmarks | -1.4% | Vietnam, Philippines, Indonesia | Medium term (2-4 years) |
| Source: Mordor Intelligence | |||
Fragmented Customs Clearance Rules Across ASEAN Single Window
Only nine members exchange ASEAN Customs Declaration Documents, forcing carriers to juggle redundant paperwork that erodes same-day and next-day promises. Vietnam’s 2025 traffic rules lifted logistics costs 10% and cut on-time rates below 90%. SMEs lacking dedicated brokers struggle most, curbing export participation. Divergent requirements from ISO 9001 mandates to country-specific licensing delay broader harmonisation and keep cross-border fulfillment expensive.
Chronic Middle- and Last-Mile Labor Shortages in Tier-2/3 Cities
Vietnam alone needs 2.2 million additional logistics workers by 2030, yet qualified staff meet just 10% of demand. Across ASEAN, 85% of carriers report shortages, forcing overtime premiums that cut margins. Aging dock crews and high churn rates inflate training spend and safety risks. Automation offsets some gaps, but capital constraints delay deployment outside top metros.
*Our forecasts treat driver/restraint impacts as directional, not additive. The impact forecasts reflect baseline growth, mix effects, and variable interactions.
ASEAN E-commerce Logistics Market Segment Analysis
By Service:
Transportation Scale Sustains DominanceTransportation accounts for 62.55% of 2025 revenue, anchoring the ASEAN e-commerce logistics market size amid the archipelago geography of Indonesia and the Philippines. Road fleets leverage trans-Java and pan-Thailand highways to trim line-haul latency, while rail gains share following the China–Laos link that slashes Kunming-Vientiane lead time. Air freight remains the go-to for high-value electronics, and sea lanes support bulk cross-border orders. The ASEAN e-commerce logistics market share of warehousing & fulfillment, though smaller, grows swiftly as dark-store grids inside Jakarta, Bangkok, and Ho Chi Minh City shorten promise windows to two hours. Automated picking lifts throughput 50-60%, and AI slotting blends same-day SKUs with slower movers. Value-added services kitting, custom labels present niche margins as platforms seek differentiated unboxing.
The segment outlook favors transport firms that digitalize fleets, integrate parcel-level visibility, and hedge fuel price swings via electric light-commercial vehicles. Fulfillment operators investing in mezzanine robotics amortize capex over accelerating parcel density. Market entrants may piggyback government corridors rather than replicate network depth, adopting asset-light models that subcontract middle mile while owning customer-facing tech.



By Business Model:
B2C Scale Meets C2C AgilityB2C maintains 68.20% of 2025 value thanks to Shopee, Lazada, and Tokopedia scale, underpinning predictable line-haul and hub capacity. Checkout digitalization at 94% removes COD float, simplifying cash cycles. Yet C2C, buoyed by TikTok Shop’s viral engines, logs an 8.77% CAGR, forcing carriers to master doorstep pickup and variable parcel sizing. Same-day SLA expectations transfer platform urgency onto lightly formalized sellers.
Hybrid logistics APIs that accept C2C waybills while reserving space on B2C trunk routes unlock utilisation gains. B2B, though the smallest slice, matures as wholesalers digitize replenishment and experiment with BNPL credit, creating steady pallet flows into provincial depots.
By Destination:
Domestic Scale vs. Cross-Border PotentialDomestic lanes represent 62.70% of 2025 revenue, aided by Indonesia’s Tol Laut coastal ferries that narrow price dispersion islands-wide. Jakarta’s congestion tariffs, however, lift city-center delivery cost profiles, nudging carriers toward suburban micro-hubs. Cross-border parcels clock a 7.03% CAGR, powered by the ASEAN e-commerce logistics market size increment tied to intra-SEA shoppers. Partial ASEAN Single Window adoption reduces paperwork yet still mandates manual intervention at several borders, capping speed gains.
Providers that pre-clear duties, integrate multi-currency wallets, and position stock at bonded hubs capture early mover advantage. Fulfillment players combine Malaysia’s free-trade zones with Singapore’s air-cargo links to aggregate demand before final-mile injection in CLMV.
By Delivery Speed:
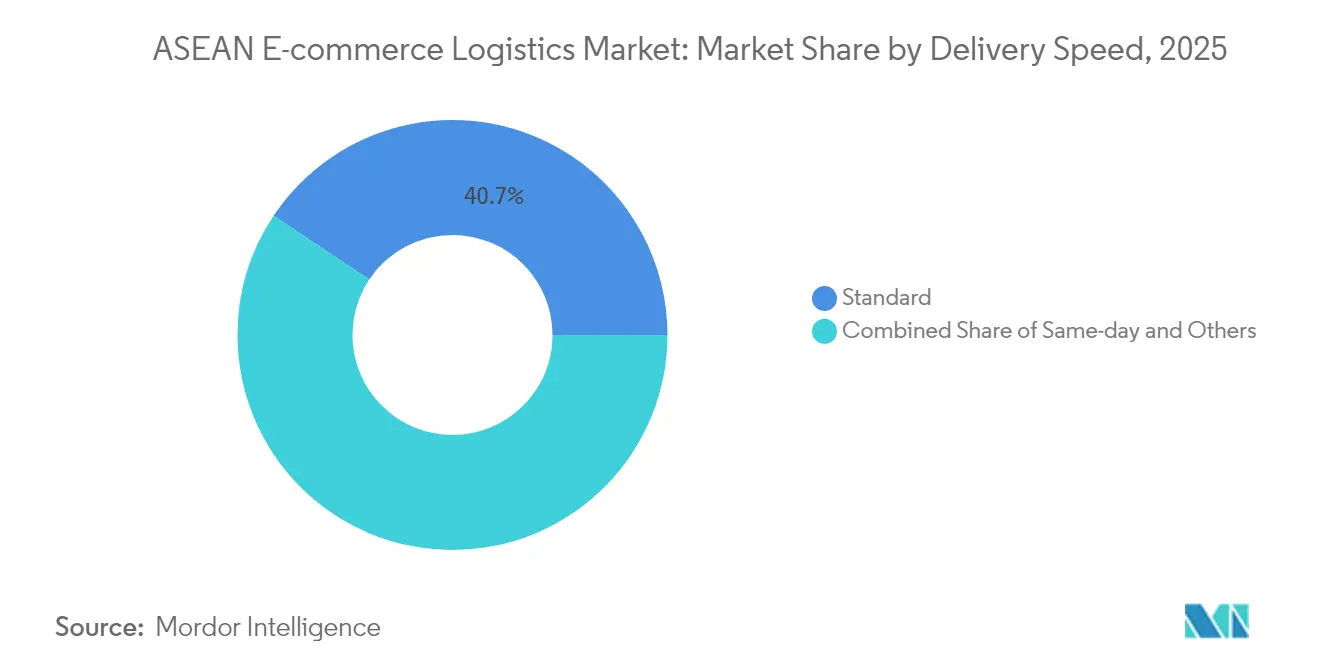
Same-Day Premium Ups the StakesStandard (3-5 days) retains 40.65% of shipments as budget-minded consumers accept slower arrivals outside tier-1 cities. Same-day revenue, however, rises at 7.39% CAGR, propped by two-hour grocery promises. The ASEAN e-commerce logistics market size for rapid modes scales as grocers and pharmacy apps subsidize shipping to snag loyalty. Next-day occupies a middle ground, relying on overnight trucking corridors; its growth hinges on highway reliability and night-time driving waivers.
Investments pivot to micro-fulfillment nodes, bike couriers, and AI batching to shave dwell time. Carriers weigh premium tariff upticks against asset-utilisation challenges, especially when weather or road closures strain two-hour commitments.
By Product Category:
Fashion Leadership, Food MomentumFashion & lifestyle tops 26.60% share, buttressed by large SKU assortments, light weight, and high return rates that spur reverse-logistics opportunities worth USD 947.36 billion globally by 2032. Foods & beverages charts 7.80% CAGR on the back of quick-commerce baskets; cold-chain mileage and leftover shelf life dictate dynamic route sequencing. Personal-care SKUs ride wellness trends, while consumer electronics leverage insured shipping and installation upsells. Furniture, bulky yet margin rich, pushes carriers toward white-glove crews and assembly add-ons, aligning with home-improvement spending in suburban ASEAN.
Geography Analysis
Indonesia E-commerce Logistics Market
Indonesia’s 30.80% share mirrors its 270 million-strong consumer base and dispersed islands that mandate sea-road-air blends. Tol Laut’s 30 vessels reduce inter-island freight premiums and invite 3PLs to penetrate outer provinces. Congestion taxes in Jakarta, however, nudge operators toward electric bikes exempt from peak-hour surcharges, raising capex but trimming variable cost.
Thailand and Vietnam E-commerce Logistics Market
Thailand and Vietnam spearhead growth in the e-commerce logistics market. Bangkok’s land-bridge vision could bypass the Malacca choke point by 2029, redirecting intra-ASEAN flows through southern seaports. Vietnam, sitting on USD 40-42 billion logistics turnover, endures elevated cost-to-GDP ratios and a 2.2 million-worker gap, propelling automation outlays. Traffic regulations enacted in 2025 lifted cost curves yet catalyzed route-optimisation investments.
Maritime ASEAN E-commerce Logistics Market
Philippines, Malaysia, and Singapore play specialist roles. Metro Manila pushes standard delivery windows beyond 48 hours due to chronic gridlock, but English fluency eases international coordination. Malaysia’s free zones host UPS-Ninja Van’s cross-border sortation, coupling global networks with local last mile. Singapore remains the region’s bonded-hub of choice for high-value electronics and fashion re-exports, commanding premium storage rents yet guaranteeing same-day regional uplift.
Mainland ASEAN and Brunei E-commerce Logistics Market
Rest-of-ASEAN markets-Cambodia, Laos, Myanmar, Brunei see social-commerce-led orders climb as the China–Laos Railway’s 15-hour run beats traditional trucking. Logistics players that embed customs brokerage and omnichannel APIs into smaller economies position for outsize returns once income levels rise.
Regulatory Landscape
ASEAN e-commerce logistics operators navigate a layered framework anchored by the 2019 ASEAN Agreement on Electronic Commerce and supported by trade-facilitation programs administered through the ASEAN Secretariat and national customs agencies. A notable 2026 milestone was June 2026, when ASEAN Senior Economic Officials (SEOM) concluded negotiations for the ASEAN Digital Economy Framework Agreement (DEFA), with formal signing referenced for November 2026.
On the cross-border leg, initiatives such as the ASEAN Customs Transit System (ACTS) support single-declaration cargo movements across participating members, while partial implementation of paperless trade and e-commerce measures leaves compliance requirements uneven. ASEAN also advanced standardization via the Roadmap on Digital Trade Standards in ASEAN (published 2026), which targets harmonization for e-authentication, e-invoicing, paperless trade, and digital payments. This shapes how parcel and marketplace data is exchanged across borders and how quickly cross-border clearances can be operationalized at scale.
Value Chain Analysis
The value chain connects merchants and marketplaces (order capture, payments, and customer service), upstream line-haul and customs brokerage (cross-border documentation and duty/tax handling), warehousing and fulfillment (inbound, storage, picking/packing, returns), and last-mile delivery (dispatch, proof-of-delivery, and reverse flows). With platform consolidation and multi-platform selling, carrier-agnostic integrations become more central, particularly APIs for label creation, order intake, and tracking. Bonded and cross-dock nodes in hubs such as Singapore and Malaysia also help connect air and road injection into domestic networks across Indonesia, Vietnam, Thailand, and the Philippines.
2026 activity shows players tightening the link between cross-border injection and domestic execution. Viettel Post became FedEx's National Network Provider in Vietnam effective April 26, 2026, aligning domestic coverage with international service standards for cross-border parcels. LEO Global Logistics signed an MoU in April 2026 with Thailand Post and Viettel Post to develop a Thailand-Vietnam-China multimodal corridor for two-way fulfillment. In June 2026, SLP Vietnam and J&T Express agreed to develop an automated sorting center in southern Vietnam (completion targeted for 2027), reinforcing the midstream sortation layer that supports peak-season SLA performance. Separately, the ASEAN shift from MPAC 2025 toward the ASEAN Connectivity Strategic Plan (ACSP) 2026-2035 reinforces investment pull toward automation, shared data, and cross-border process alignment.
Competitive Landscape
The ASEAN e-commerce logistics market exhibits moderate fragmentation. J&T Express’s decision to drop Shopee exclusivity unveiled vulnerability in single-platform reliance and triggered a reshuffle of lane volumes. Ninja Van anchors regional last mile but fights financial strain, evident in 2024 wage delays, as subsidised shipping erodes margins.
Differentiation pivots on tech depth. Providers deploying Gen-AI route optimisation cut per-parcel cost over 12% and uplift on-time rates to 97% in pilot metros. Robotics-rich warehouses process 50% more orders per square foot, allowing fulfillment specialists to underbid manual peers. Cross-border mastery compliance automation, multi-currency billing—emerges as the next frontier, especially with social-commerce merchants seeking frictionless export.
Regulations add gatekeeping layers: ISO 9001 mandates in Singapore and Malaysia restrict entry to smaller couriers, whereas Indonesia favours local licensing and data-hosting rules. Consolidation continues via M&A: Amilo bought Thailand’s Sivadon, CJ Logistics allied with Ninja Van, and UPS partnered Ninja Van in Malaysia to fuse global reach with local know-how. Chinese giants JD Logistics and Cainiao scout ASEAN depots, raising the bar on automation and price transparency.
ASEAN E-commerce Logistics Industry Leaders
J&T Express
Ninja Van
Deutsche Post DHL Group
Shopee Xpress
Lazada Logistics
- *Disclaimer: Major Players sorted in no particular order
ASEAN E-commerce Logistics Market Companies Covered in this Report
- JandT Express
- Ninja Van
- Deutsche Post DHL Group
- Shopee Xpress
- Lazada Logistics
- Kerry Express
- Flash Express
- Best Express
- FedEx Corporation
- UPS Inc.
- Pos Indonesia
- JNE Express
- TIKI
- Giao Hang Nhanh
- LBC Express
- GD Express
- aCommerce
- SF International
- CJ Logistics
- Yusen Logistics

Market Opportunities and Future Outlook
Cross-border compliance and documentation digitization remains the main whitespace area, since operators still face uneven procedures and partial interoperability across borders even as ASEAN progresses toward deeper digital-economy alignment. The June 2026 conclusion of negotiations for the ASEAN Digital Economy Framework Agreement (DEFA) and the 2026 Roadmap on Digital Trade Standards in ASEAN provide a clearer path for solutions that standardize e-invoicing, e-authentication, and paperless trade across networks. This would support carriers and 3PLs that can combine brokerage, tax/duty handling, and parcel-level visibility into a single workflow.
Opportunities also concentrate in technology-enabled execution layers that tighten promise windows and reduce exceptions, including AI-enabled documentation and control-tower integrations, automated sortation, and fulfillment capabilities for returns and exception management for multi-platform sellers. Evidence in 2026 includes The Hashgraph Group and Teleport's April 2026 proof of concept for a Web3 and AI-enabled customs documentation system aimed at high-volume e-commerce flows in Malaysia and regional air routes. The June 2026 SLP Vietnam and J&T Express agreement to develop an automated sorting facility in southern Vietnam further supports this execution focus. In parallel, capacity-building and technology adoption priorities under the ASEAN Transport Sectoral Plan (ATSP) 2026-2030 broaden the addressable market for providers offering compliant digital interfaces that connect shippers, carriers, warehouses, and customs into end-to-end visibility across ASEAN lanes.
Recent Industry Developments in ASEAN E-commerce Logistics Market
- July 2026: In July 2026, A.P. Moller Capital completed a 40% share subscription in AC Logistics Holdings Corp. in the Philippines. The transaction strengthens AC Logistics' ability to scale integrated logistics capacity, supporting e-commerce fulfillment and distribution requirements in a market where nationwide coverage and service reliability are central to platform and merchant contracts.
- April 2025: In April 2025, J&T Express ended its exclusive partnership with Shopee Indonesia. This move increased contestability of large platform volumes, pushing carriers to compete on service quality, network density, and multi-platform integrations rather than relying on single-platform commitments.
- August 2024: In August 2024, UPS and Ninja Van formed a strategic partnership in Malaysia to serve export-oriented SMEs. The tie-up combined international express capabilities with local last-mile reach, improving cross-border access for online sellers and raising competitive pressure on regional carriers offering Malaysia-based export and returns solutions.


ASEAN E-commerce Logistics Market Report Scope and Research Methodology
Market Definition and Coverage
For this study, the ASEAN e-commerce logistics market is defined as revenue earned from moving, storing, and handling parcels tied to online orders across ASEAN, including line haul, last mile, fulfillment warehousing, returns, and related value-added activities used to complete delivery.
Scope exclusions: This sizing excludes the value of goods sold online and excludes pure digital services that do not involve physical logistics execution.
Segments Covered in This Report
- By Service
- Transportation
- Road
- Rail
- Air
- Sea
- Warehousing and Fulfilment
- Value-Added Services (Labelling, Packaging, Kitting)
- Transportation
- By Business Model
- B2C
- B2B
- C2C
- By Destination
- Domestic
- Cross-border (international)
- By Delivery Speed
- Same-day (less than 24 h)
- Next-day (24-48 h)
- Standard (3-5 days)
- Others (more than 5 days)
- By Product Category
- Foods and Beverages
- Personal and Household Care
- Fashion and Lifestyle (accessories, apparel, footwear)
- Furniture
- Consumer Electronics and Household Appliances
- Other Products
- By Country
- Indonesia
- Thailand
- Vietnam
- Philippines
- Malaysia
- Singapore
- Rest of ASEAN (Cambodia, Laos, Myanmar, Brunei)
Data Sources, Market Sizing, and Validation
Desk Research
Desk research was used to set the boundaries of what counts as e-commerce logistics in ASEAN and to build the starting demand picture by country. We relied on public, non-paywalled sources such as ASEANStats, national statistics offices for Indonesia, Thailand, Vietnam, Malaysia, the Philippines, and Singapore, central bank or finance ministry releases on consumption and trade, and World Bank logistics and trade indicators.
To translate demand signals into logistics activity, we also reviewed postal and parcel regulator publications and transport ministry releases where available, along with airport and port authority throughput statistics, customs trade data, and disclosures from listed logistics providers and marketplaces (annual reports and investor decks). In parallel, we used paid subscriptions for company financials and news to standardize revenue splits, corporate actions, and service mix changes. This list is not exhaustive, and many other sources were referred to for data collection, validation, and research clarification.
Primary Interviews and Surveys
Primary work focused on validating the service boundary and the unit economics that sit under the model, especially where public data is uneven across ASEAN countries. We spoke with operators and channel participants across fulfillment, last mile, line haul, and cross-border handling, and we also checked assumptions with shippers and large online sellers to confirm shipment profiles and seasonal peaks.
Because ASEAN performance differs by country, we ensured views were captured across high-volume hubs and developing corridors, and then the inputs were reconciled back to desk-based indicators before final sizing and forecasts were signed off.
Distribution of primary research fieldwork respondents
| Company type | Respondent position |
|---|---|
| Top tier: 30% | CXOs: 17% |
| Mid tier: 52% | Functional/Unit leaders: 36% |
| Smaller Players: 18% | Managers: 47% |
Market-Sizing & Forecasting
Our market sizing starts with a top-down reconstruction that links ASEAN online retail demand to the physical logistics it creates, and then applies service-level conversion factors by country. The model uses a practical chain of inputs such as e-commerce GMV and order growth trends, parcel volume per order, share of cross-border shipments, average delivery speed mix, fulfillment outsourcing rates, and service-level pricing movement (for example, last-mile price per parcel and fulfillment fees per order).
Once totals are formed, they are corroborated using selective bottom-up checks, such as rolling up disclosed logistics revenues for key service lines, sampled pricing times observed parcel volumes, and channel checks on capacity utilization in fulfillment nodes. Where company disclosures do not separate e-commerce from broader parcel or contract logistics, we fill gaps using interview-led allocation keys that are tied to customer mix, lane structure, and typical contract terms.
For forecasting, scenario analysis is used so growth can flex with changes in online penetration, cross-border policy friction, fuel and labor cost pass-through, and delivery promise expectations that influence service mix. Assumptions are stress-tested at country level and then aggregated, so the regional outlook stays consistent with the on-ground operating reality.
Data Validation & Update Cycle
Validation is done through triangulation across independent signals, followed by structured variance checks before conclusions are finalized. We compare outputs against directionally stable indicators such as parcel volume trends, air and sea throughput patterns for key lanes, and company-reported logistics revenue trajectories, and then outliers are reviewed to confirm whether they reflect real shifts or a data break.
Before sign-off, the model goes through a multi-step analyst review that checks arithmetic consistency, unit conversions, and sensitivity to the biggest drivers. If a material variance is found, respondents are re-contacted to clarify assumptions, and the inputs are updated with the most recent public releases. Reports are refreshed annually, with interim updates for major events, and a final pre-delivery pass is completed so clients receive the latest updated view.
Mordor Intelligence's Asean E Commerce Logistics Market Size Compared Against Other Published Estimates
Published market sizes for ASEAN e-commerce logistics can look far apart because authors do not always count the same activities, and the base-year inputs can be built from different demand signals. In practice, the spread usually comes from what is treated as in-scope logistics revenue, how cross-border flows are handled, and whether the estimate leans on parcel counts, broader freight figures, or seller-side spending proxies.
Parcel-volume direction checks, fulfillment capacity utilization feedback, and country-level e-commerce order growth are the evidence points that keep Mordor Intelligence tied to a defined logistics revenue pool, rather than a wider freight and delivery universe. When delivery speed mix, returns intensity, and domestic versus international handling are treated differently, the resulting average price and volume math changes quickly, and that is often the biggest driver behind higher or lower totals.
Benchmark comparison
| Source | Market Size | Gaps in Research Methodology |
|---|---|---|
| Mordor Intelligence | USD 10.25 B (2025) | |
| Industry Association A | USD 8.90 B (2025) | Typically tracks only express parcel delivery revenues and omits fulfillment warehousing and value-added processing tied to e-commerce, which can undercount markets with rising outsourced fulfillment. |
| Global Consultancy B | USD 12.80 B (2025) | Often applies a broader logistics spend-to-GMV ratio and may include adjacent B2B distribution and non-e-commerce parcel flows, which can inflate totals when definitions are not filtered to online orders. |
The comparison shows that most differences are explainable once the scope boundary is made explicit and the volume and pricing drivers are checked country by country. By keeping the market tied to observable shipment activity and service-level revenue logic, the final number is easier to replicate, update, and use in planning without hidden category overlap.


Key Questions Answered in the Report
What is the current value of the ASEAN e-commerce logistics market?
The market is valued at USD 11.49 billion in 2026 and is projected to reach USD 20.37 billion by 2031.
Which service segment is growing the fastest?
Warehousing & fulfillment leads growth with an 8.09% CAGR as dark-store and automation investments rise.
How fast is cross-border e-commerce logistics expanding?
Cross-border flows are forecast to advance at a 7.03% CAGR, driven by social-commerce integration and customs digitalization.
Why are digital wallets important for logistics operators?
Wallets settle 34% of sector payments, reduce checkout friction, and require carriers to manage real-time fund splits.
Which country shows the highest growth momentum?
Vietnam posts the fastest national CAGR at 6.22%, supported by manufacturing exports and rising domestic GMV.
How does labor availability affect logistics costs?
Chronic shortages, especially in tier-2/3 cities, lift wages and training spend, reducing margins until automation scales.
Page last updated on:


 Your data is secure and never sold or shared.


