Asia-Pacific Green Buildings Market Size and Share
Market Overview
| Study Period | 2020 - 2031 |
|---|---|
| Forecast Data Period | 2026 - 2031 |
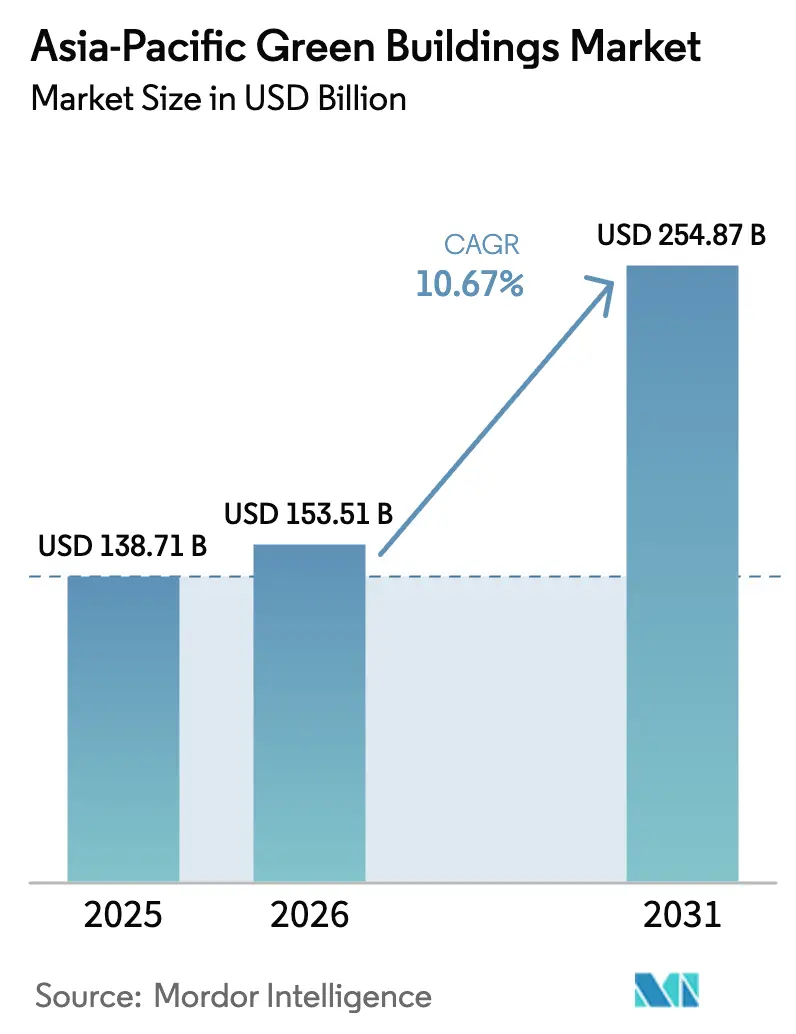
| Base Year Market Size (2025) | USD 138.71 Billion |
| Market Size (2026) | USD 153.51 Billion |
| Market Size (2031) | USD 254.87 Billion |
| Growth Rate (2026 - 2031) | 10.67% CAGR |
| Market Concentration | Low |
Major Players *Disclaimer: Major Players sorted in no particular order Image © Mordor Intelligence. Reuse requires attribution under CC BY 4.0. | |
Asia-Pacific Green Buildings Market Analysis by Mordor Intelligence
The Asia-Pacific Green Buildings Market size was valued at USD 138.71 billion in 2025 and is estimated to grow from USD 153.51 billion in 2026 to reach USD 254.87 billion by 2031, at a CAGR of 10.67% during the forecast period (2026-2031).
Policy-driven energy-performance codes, investor appetite for sustainable assets, and accelerating electricity tariffs are converting energy efficiency from a voluntary premium into a core design requirement across new projects and deep retrofits. Building-automation platforms that cut operating costs by 20-30%, abundant green-finance lines that narrow the cost‐of-capital gap, and tenant demand for ESG-aligned space are reinforcing a positive feedback loop that sustains volume growth across the Asia-Pacific green buildings market. Competitive intensity remains high as global multinationals and regional conglomerates race to control certified‐material supply chains and secure early positions in the fastest-growing retrofit niches. Government roadmaps that mandate net-zero new-builds between 2030 and 2050 ensure that the addressable opportunity in the Asia-Pacific green buildings market extends well beyond the current forecast window.
Key Report Takeaways
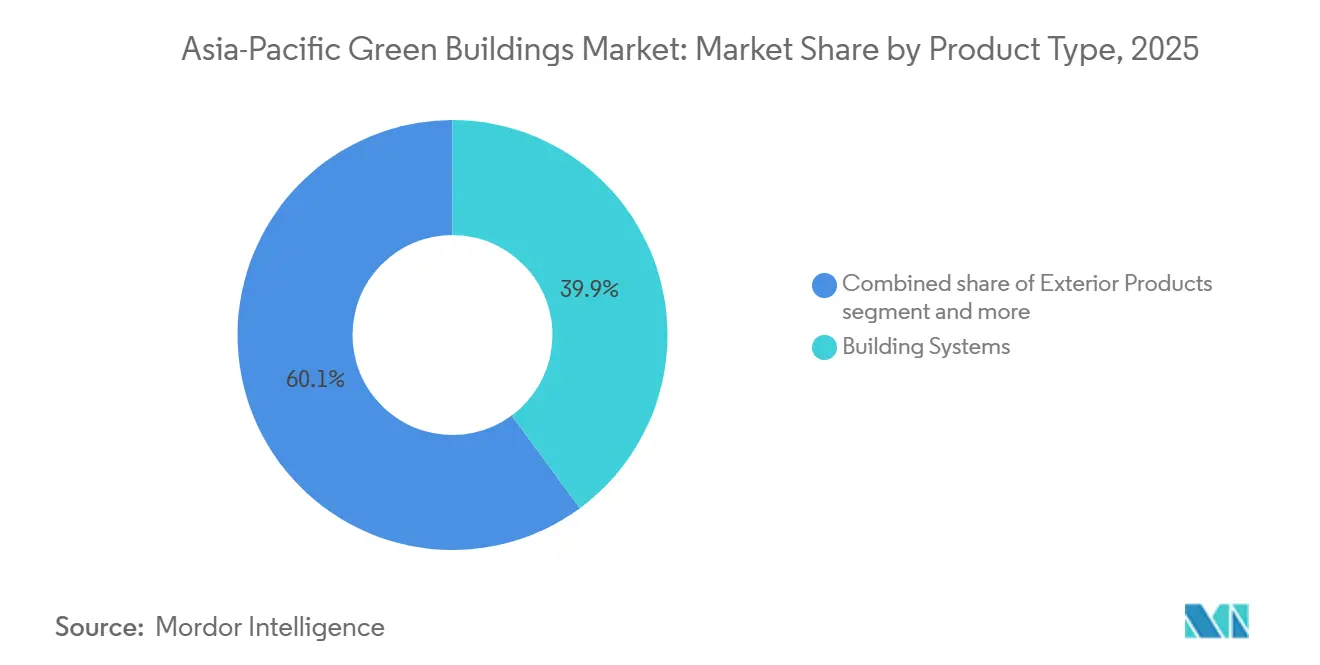
- By product type, Building Systems led with 39.9% of the Asia-Pacific green buildings market share in 2025; Solar Products are projected to expand at an 11.08% CAGR through 2031.
- By end user, the Residential segment commanded 54.8% of the Asia-Pacific green buildings market size in 2025, while Commercial applications are on track to record a 10.98% CAGR to 2031.
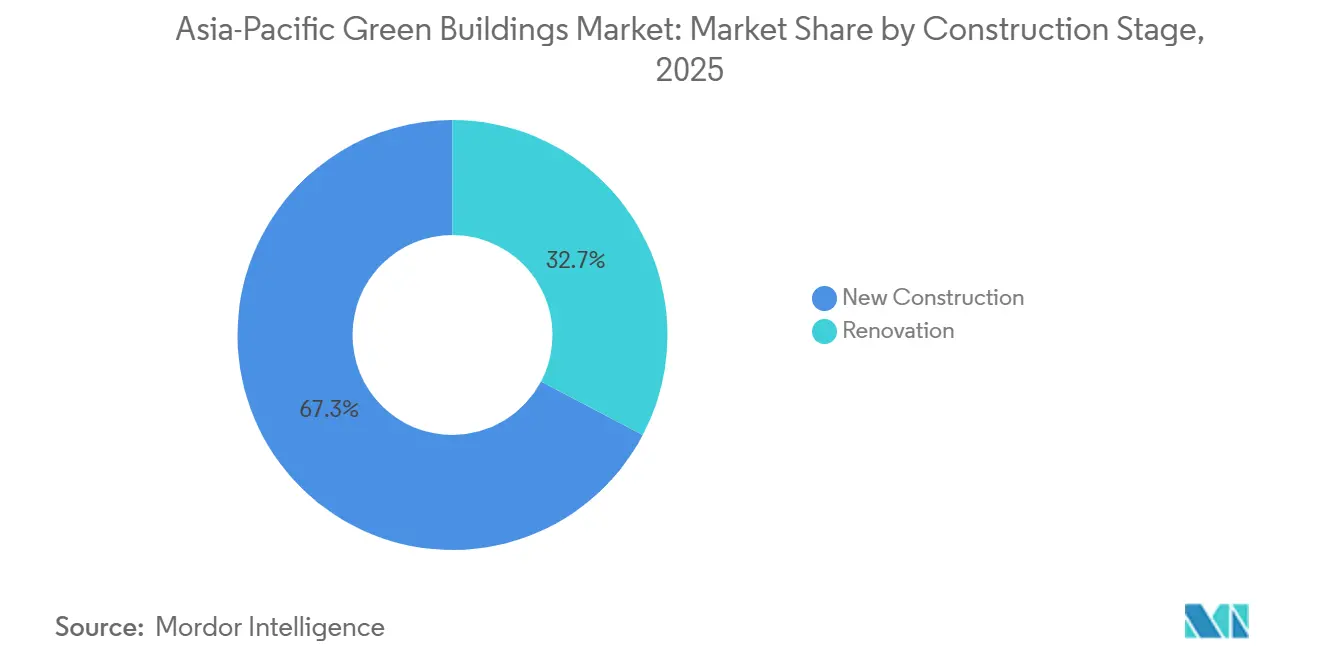
- By construction stage, New Construction generated 67.3% of the Asia-Pacific green buildings market revenue in 2025, and Renovation is forecast to grow at an 11.21% CAGR over 2026-2031.
- By geography, China captured 38.5% of 2025 revenue, whereas India is expected to post the quickest expansion at an 11.78% CAGR through 2031.
Note: Market size and forecast figures in this report are generated using Mordor Intelligence’s proprietary estimation framework, updated with the latest available data and insights as of 2026.
Worldwide, activity is shaped by contributions from multiple regions, with Asia representing one of the more structurally developed among them. The global report on green buildings market by Mordor Intelligence reflects how these regional layers combine into a single system.
Asia-Pacific Green Buildings Market Trends and Insights
Drivers Impact Analysis*
| Drivers | (~) % IMPACT ON CAGR FORECAST | Geographic Relevance | Impact Timeline |
|---|---|---|---|
| Government net-zero targets and progressively tightening green-building codes | +3.2% | China, India, Japan, South Korea, Australia, Singapore | Medium term (2–4 years) |
| Rapid urbanization alongside expansion of new commercial corridors | +2.8% | India, China, Indonesia | Long term (≥ 4 years) |
| Electricity tariff inflation improving payback economics for efficiency upgrades | +2.3% | Singapore, Australia, India, Japan | Short term (≤ 2 years) |
| Investor and tenant preference for ESG-compliant real estate assets | +1.9% | China, India, Singapore, Australia | Medium term (2–4 years) |
| Expanding availability of green-finance incentives and sustainability-linked funding | +1.5% | Singapore, China, Hong Kong, Australia | Short term (≤ 2 years) |
| Source: Mordor Intelligence | |||
Government Net-Zero Targets and Green-Building Codes Tightening Every Year
Mandatory net-zero roadmaps are transforming voluntary certification programs into compliance checkpoints that developers must clear to obtain permits and financing. Australia’s Net Zero Built Environment Sector Plan, in force since September 2025, aligns public procurement with near-zero operational emissions, while Singapore’s 80-80-80 program requires 80% of gross floor area to achieve Super Low Energy status by 2030[1]Building and Construction Authority, “Green Mark 2026 Roadmap,” bca.gov.sg . South Korea’s G-SEED framework and Net-Zero Public Sector Plan obligate all new government buildings to meet zero-energy standards, creating a guaranteed pipeline for high-efficiency HVAC and building-integrated photovoltaics. Japan has legislated that every new structure satisfy ZEH/ZEB benchmarks by 2030, accelerating heat-pump adoption years ahead of schedule. Indonesia’s Presidential Regulation 110/2025 monetizes verified carbon cuts, enabling developers to create a secondary revenue stream through trading. The convergence of these programs compresses design cycles and locks in structural demand for advanced materials across the Asia-Pacific green buildings market.
Rapid Urbanization Coupled with New Commercial Corridors
Metro-area populations in India, China, and Indonesia are swelling by millions each year, spurring fresh commercial clusters that embed green specifications from day one. India’s construction output is on pace to reach 14% of GDP by 2030, with industrial corridors such as Delhi-Mumbai specifying energy-efficient envelopes and smart controls at the tender stage[2]RICS, “India Construction Outlook 2026,” rics.org . China State Construction Engineering Corporation booked USD 347.4 billion equivalent in new contracts in H1 2025, including a semiconductor park that sources 100% renewable electricity at the site level. The World Bank is financing low-income green housing in Indonesia that uses passive cooling to cut peak loads by 35%, demonstrating that efficiency can be mainstreamed even in affordable segments. Developers are therefore switching to a design-for-performance mindset, embedding solar-ready roofs, low-carbon concrete, and demand-responsive lighting as standard features.
Electricity-Tariff Inflation Boosting Payback for Efficiency Upgrades
Average electricity tariffs in Singapore hit USD 0.22 per kWh in Q1 2026, up 4.3% quarter-on-quarter, while India’s peak demand touched 250 GW in 2024, lifting average industrial rates by double digits[3]Energy Market Authority, “Quarterly Statistics Q1 2026,” Energy Market Authority, ema.gov.sg. The International Energy Agency projects that Asia-Pacific demand will rise 4.4% annually through 2034, outstripping renewable-capacity additions. Building owners are therefore accelerating rollouts of variable-speed chillers, high-performance glazing, and AI-driven energy-management software that collectively trim utility bills by 20-30%. Schneider Electric’s EcoStruxure installation at a Mumbai office in 2024 is already saving 30% of annual consumption, validating the economics of deep retrofits. As payback periods compress to less than five years, efficiency spending moves from discretionary to mandatory within the Asia-Pacific green buildings market.
Investor and Tenant Preference for ESG-Compliant Assets
Eighty-eight percent of Asia-Pacific office occupiers now apply carbon criteria when signing space, and 90% of institutional investors screen new acquisitions against sustainability thresholds. India’s green-certified Grade A inventory reached 503 million ft² in 2025, capturing 75% of annual leasing and commanding 4-24% rent premiums. ISPT’s USD 113 million retrofit of 270 Pitt Street, Sydney, targets Green Star and NABERS scores that future-proof lease renewals and unlock cheaper debt. As occupiers chase lower Scope 2 footprints, landlords are forced to retrofit existing portfolios or face obsolescence. This demand-side pull translates directly into accelerated retrofit cycles, lifting the overall velocity of the Asia-Pacific green buildings market.
Restraints Impact Analysis*
| Restraints | (~) % Impact on CAGR Forecast | Geographic Relevance | Impact Timeline |
|---|---|---|---|
| Higher upfront capital costs and uncertain payback in secondary markets | -1.4% | Indonesia, India secondary cities, emerging APAC markets | Short term (≤ 2 years) |
| Skills shortages and uneven availability of certified materials/technologies | -1.2% | Regional, particularly acute in Southeast Asia and India | Medium term (2-4 years) |
| Fragmented regulations, split incentives, and inconsistent valuation practices across jurisdictions | -0.9% | Cross-border projects, multi-jurisdiction developments | Long term (≥ 4 years) |
| Source: Mordor Intelligence | |||
Higher upfront costs for green materials and systems slowing adoption in price-sensitive projects
Even though lifecycle savings are compelling, recycled steel, low-carbon concrete, and passive design measures can inflate initial budgets by 6-8%, a premium that many affordable-housing developers cannot absorb. Construction firms in Southeast Asia report that limited product availability forces imports, adding logistics costs and eroding margins. Fit-out prices for second-tier office markets are also climbing as landlords integrate acoustic insulation and sensor grids demanded by tenants. Until green-finance products penetrate deeper into small-ticket segments, adoption will lag in value-driven verticals, capping short-term growth of the Asia-Pacific green buildings market.
Limited supply and higher lead times for certified products and skilled green contractors
Rapid adoption is straining supply chains for high-performance glazing, heat pumps, and building-integrated photovoltaics, extending lead times by up to 16 weeks in key metros. The International Labour Organization has warned of a widening skills gap; its ASEAN youth program aims to certify thousands of apprentices by 2026, yet current demand already exceeds trained labor supply. Singapore’s Green Mark Professional drive reached 25,000 practitioners in 2025, but neighboring countries trail far behind, pushing wages for certified supervisors up by 15-20%. These bottlenecks inflate project timelines, raising holding costs and delaying returns for developers.
*Our forecasts treat driver/restraint impacts as directional, not additive. The impact forecasts reflect baseline growth, mix effects, and variable interactions.
Segment Analysis
By Product Type: Building Systems Hold Leadership While Solar Products Scale Fast
Building Systems generated 39.9% of the Asia-Pacific green buildings market revenue in 2025, reflecting strong demand for high-efficiency HVAC, LED lighting, and intelligent controls that deliver immediate 20-30% operating-cost cuts. Solar Products, although starting from a smaller base, are projected to grow at an 11.08% CAGR to 2031 as on-site generation becomes a compliance requirement for net-zero certification. Building-integrated photovoltaics launched by China State Construction Engineering Corporation in 2025 generate 110 kWh per m² annually, helping developers monetize excess power via net-metering. Panasonic’s Malaysia factory now runs a 9.156 MW rooftop array paired with storage, illustrating how industrial users hedge tariff volatility and lock in Renewable Energy Certificates. The convergence of declining module costs and exportable carbon credits will keep Solar Products the fastest-growing slice of the Asia-Pacific green buildings market size over the forecast period.
Exterior and Interior Products together capture the next largest pool of spending. High-performance glazing and mineral-wool insulation supplied by Saint-Gobain’s Chennai line, expanded in 2025, are essential for meeting stricter envelope U-values across China, India, and Australia. Green roofs and permeable pavements, still niche, are gaining traction as city planners in Singapore and Jakarta bundle stormwater management into planning approvals. Manufacturers are therefore localizing production of recycled sub-systems to qualify for government procurement rules, amplifying regional value addition within the APAC green buildings industry.


By End User: Residential Dominates but Commercial Surges
The Residential segment accounted for 54.8% of the Asia-Pacific green buildings market share in 2025 as households embraced smart thermostats, solar-ready roofs, and low-VOC finishes to manage rising energy and health concerns. Commercial stock—offices, retail, logistics, and data centers—is forecast to expand at a 10.98% CAGR between 2026 and 2031, narrowing the absolute dollar gap with Residential. Grade A green office space in India reached 503 million ft² in 2025, capturing three-quarters of annual leasing and fetching rent premiums up to 24%. Larsen & Toubro’s 40 MW AI-ready data center, launched in January 2026, exemplifies the explosive synergy between digital infrastructure and carbon-neutral commitments.
Within Residential, master-planned communities such as Sumitomo Forestry-Mirvac’s USD 549 million Highforest project in Sydney bundle biophilic design with grid-interactive battery storage, signaling that buyers in mature metros will pay for embedded sustainability features. In Commercial, logistics developers are racing to certify warehouses under EDGE or LEED to secure e-commerce clients, while hospitals and schools leverage public-sector green-bond programs to finance high-efficiency retrofits. This dual-track expansion ensures that both owner-occupied and income-producing assets continually feed the Asia-Pacific green buildings market size.
By Construction Stage: New Construction Leads, Renovation Rises
New Construction delivered 67.3% of 2025 revenue, underpinned by urban growth corridors and statutory requirements that force green compliance at the blueprint stage. Renovation, however, is projected to grow at an 11.21% CAGR through 2031, fueled by regulation covering existing stock and a spike in sustainability-linked refinancing. CapitaLand’s retrofit portfolio in China achieved up to 72% energy cuts and saved as much as USD 1.83 million per building per year, proving retrofit economics in prime CBDs. Keppel Bay Tower’s zero-energy conversion in Singapore eliminated 2,400 tCO₂e annually and unlocked preferential debt, attracting peers to emulate the model.
Deep‐retrofit playbooks now include modular façade replacements, demand-controlled ventilation, and AI-enabled fault detection that maximizes asset uptime. Funding support ranges from Australian federal tax rebates under the Net Zero Sector Plan to Indonesia’s cap-and-trade credits that effectively finance one-third of payback. Given that 65% of today’s building stock will still be operational in 2040, the long-run addressable renovation pool represents the single largest pathway to decarbonizing the Asia-Pacific green buildings market.
Geography Analysis
China contributed 38.5% of 2025 revenue to the Asia-Pacific green buildings market, anchoring demand through aggressive provincial mandates, mass prefabrication, and an expanding pipeline of public housing that embeds low-carbon criteria. Shanghai’s 2025 code update tightened envelope and system benchmarks by 12-15%, triggering a wave of design-build contracts that favor suppliers of high-performance insulation and smart controls. China State Construction Engineering Corporation’s factory-built modules cut embodied carbon by 60% and secured preferential access to government tenders, while building-integrated photovoltaics allow developers to monetize Renewable Energy Certificates in regional spot markets.
India is forecast to log the fastest pace, at an 11.78% CAGR through 2031, driven by sustained urbanization, peak-demand shocks that keep tariffs elevated, and a green-bond pipeline that exceeded USD 5 billion over 2024-2025. Policy tailwinds such as mandatory eco-labeling for infrastructure and concessional finance spur the adoption of low-carbon concrete and solar façades across metro rail, airports, and warehousing clusters. Industrial giants like Larsen & Toubro now derive more than half their revenue from green contracts, while Saint-Gobain’s USD —equivalent Chennai upgrade scales local supply for high-performance glass and insulation. Rent premiums of up to 24% for certified Grade A offices accelerate retrofits and new developments alike.
Japan, South Korea, Australia, Indonesia, and the wider Rest of Asia-Pacific contribute the remaining share and present diverse opportunity sets. Japan’s nationwide ZEH/ZEB mandate channels demand toward heat pumps and mineral-wool insulation, with Sumitomo Forestry targeting 10,000 near-zero homes annually. South Korea’s public-sector zero-energy requirement guarantees a baseline volume of advanced HVAC and on-site renewables, while the NABERS-Green Star ecosystem in Australia has already rated more than 20,000 buildings, encouraging private owners to pursue higher star ratings to maintain liquidity. Indonesia’s Presidential Regulation 110/2025 introduces building-level carbon trading, creating a new monetization lever for verified energy savings. Emerging markets such as Vietnam and the Philippines are catching up, propelled by multilateral funding that ties concessional loans to LEED or local green-tag benchmarks, expanding the geographic footprint of the Asia-Pacific green buildings market.
Mordor Intelligence provides coverage of the green buildings market across other key regional markets, including Europe, Middle East, and North America, each with their regulatory frameworks and demand patterns.
Competitive Landscape
Competition across the Asia-Pacific green buildings market remains highly fragmented, with no single player commanding a dominant regional position. Strategic positioning revolves around vertical integration, digital differentiation, and regional expansion. Johnson Controls’ USD 60 million Innovation Centre in Singapore develops liquid-immersion cooling and AI control loops aimed at hyperscale data centers that demand sub-PUE levels. China State Construction Engineering Corporation leverages factory automation to deliver 95% prefab hospitals and schools, reducing on-site labor risks and accelerating completion schedules that appeal to public agencies under tight fiscal deadlines.
The second competitive tier comprises regional construction majors and material specialists scaling circular production. Sika’s January 2025 acquisition of Elmich injects a 100% recycled green-roof system into Sika’s Asian portfolio, positioning the firm for mandated stormwater solutions in dense cities. Saint-Gobain’s glass and insulation capacity expansions in India and Malaysia localize high-performance envelope components, slashing lead times that have hampered developers under compressed project windows. Tech-centric disruptors offer cloud-based energy analytics; Schneider Electric’s EcoStruxure and Honeywell’s Forge platforms are converging with carbon-trading APIs to let owners visualize savings and generate credits in real time.
M&A and joint ventures are accelerating as players chase scale in services and technology. Sumitomo Forestry and Mirvac’s 50-50 Highforest JV secures land, design, and sales expertise in one structure, lowering execution risk for a USD 549 million community. Financial innovation is equally fierce; GuocoLand’s repeat green-club financings build a track record that yields progressively tighter spreads. Across segments, the ability to prove energy savings, document embodied-carbon cuts, and compress build schedules is emerging as the decisive factor for winning bids in the Asia-Pacific green buildings market.
Asia-Pacific Green Buildings Industry Leaders
Johnson Controls International
Daikin Industries Ltd.
Saint-Gobain S.A.
Panasonic Holdings Corp.
Kingspan Group plc
- *Disclaimer: Major Players sorted in no particular order

Recent Industry Developments
- January 2026: Johnson Controls committed USD 60 million to expand its Singapore Innovation Centre for next-generation data-center cooling.
- January 2026: Panasonic completed a 9.156 MW rooftop solar plus storage system at its Malaysia factory, achieving near-zero operational emissions.
- January 2026: Larsen & Toubro started a 40 MW AI-ready data center in Navi Mumbai, powered by renewables and advanced cooling.
- January 2026: China State Construction Engineering Corporation delivered a 470,000 m², 2,000-bed modular hospital in Shenzhen, 95% prefab.


Asia-Pacific Green Buildings Market Report Scope
| Exterior Products |
| Interior Products |
| Building Systems |
| Solar Products |
| Others |
| Residential | Apartments & Condominiums |
| Villas & Landed Houses | |
| Commercial | Office |
| Retail | |
| Logistics | |
| Institutional | |
| Others (industrial, hospitality, etc.) |
| New Construction |
| Renovation |
| China |
| India |
| Japan |
| South Korea |
| Australia |
| Indonesia |
| Rest of Asia-Pacific |
| By Product Type | Exterior Products | |
| Interior Products | ||
| Building Systems | ||
| Solar Products | ||
| Others | ||
| By End User | Residential | Apartments & Condominiums |
| Villas & Landed Houses | ||
| Commercial | Office | |
| Retail | ||
| Logistics | ||
| Institutional | ||
| Others (industrial, hospitality, etc.) | ||
| By Construction Stage | New Construction | |
| Renovation | ||
| By Country | China | |
| India | ||
| Japan | ||
| South Korea | ||
| Australia | ||
| Indonesia | ||
| Rest of Asia-Pacific | ||


Key Questions Answered in the Report
How large will spending on green construction in the Asia-Pacific be by 2031?
The Asia-Pacific green buildings market size is projected to reach USD 254.87 billion by 2031, reflecting a 10.67% CAGR over 2026-2031.
Which product category is growing the fastest?
Solar Products are anticipated to expand at 11.08% annually as on-site generation becomes mandatory for many new projects.
Why is renovation activity accelerating?
Tighter energy-performance codes for existing stock and favorable sustainability-linked loans make deep retrofits financially attractive, driving an 11.21% CAGR through 2031.
Which country offers the highest growth potential after China?
India leads with an expected 11.78% CAGR thanks to rapid urbanization, rising tariffs, and a robust green-bond pipeline exceeding USD 5 billion in 2024-2025.
How are investors influencing adoption?
Institutional investors now embed carbon criteria in acquisition and leasing decisions, allowing certified assets to command 4-24% rent premiums and lower financing spreads.
What is the main barrier for affordable housing projects?
Higher upfront costs for low-carbon materials and limited access to concessional finance slow adoption in price-sensitive residential segments.
Page last updated on:


