Market Overview
| Study Period | 2020 - 2031 |
|---|---|
| Forecast Data Period | 2026 - 2031 |
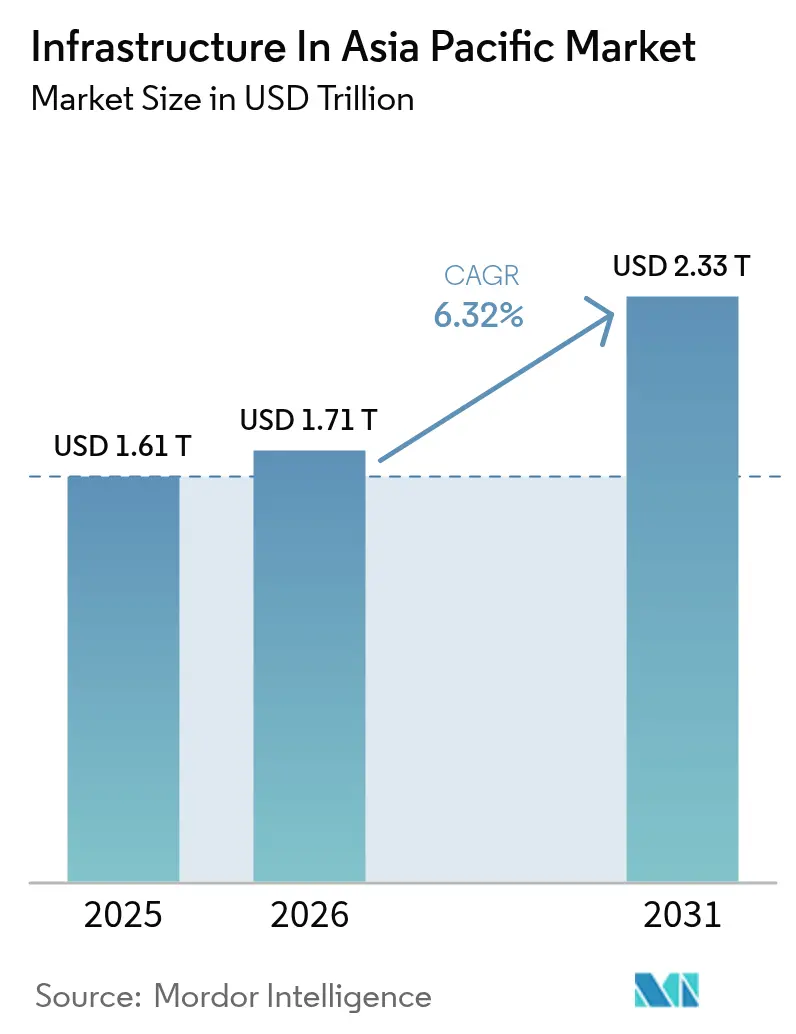
| Base Year Market Size (2025) | USD 1.61 Trillion |
| Market Size (2026) | USD 1.71 Trillion |
| Market Size (2031) | USD 2.33 Trillion |
| Growth Rate (2026 - 2031) | 6.32% CAGR |
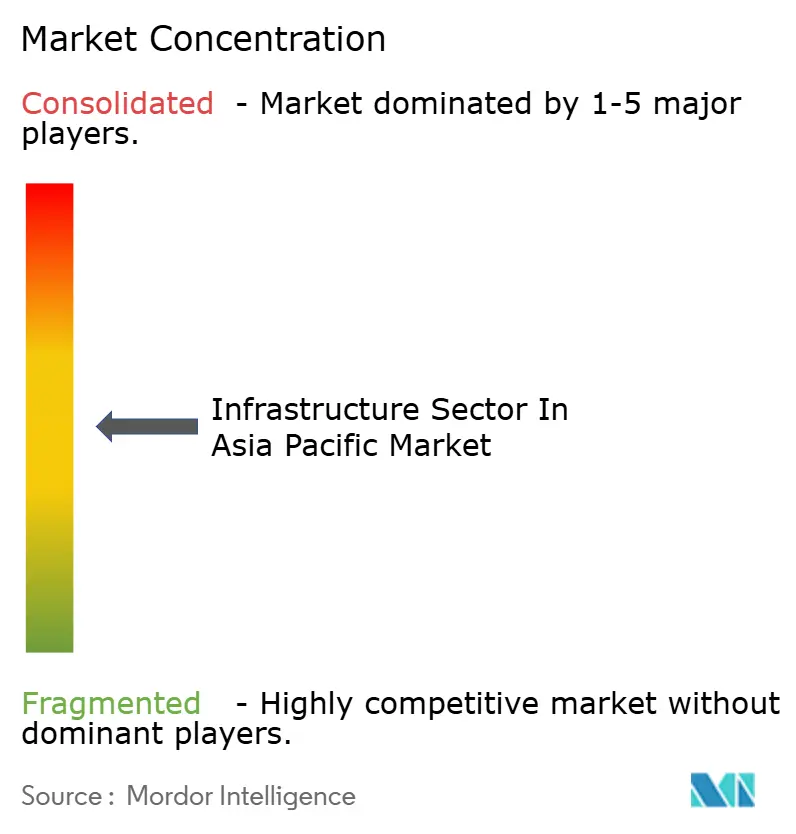
| Market Concentration | Medium |
Major Players *Disclaimer: Major Players sorted in no particular order Image © Mordor Intelligence. Reuse requires attribution under CC BY 4.0. | |
Infrastructure In Asia Pacific Market Analysis by Mordor Intelligence
APAC infrastructure market size in 2026 is estimated at USD 1.71 trillion, growing from 2025 value of USD 1.61 trillion with 2031 projections showing USD 2.33 trillion, growing at 6.3% CAGR over 2026-2031. Momentum comes from governments pivoting toward economic resilience, large-scale transport corridors that link regional supply chains, and a surge in data-center builds geared toward artificial-intelligence workloads. China’s USD 167 billion hydropower project in Tibet, India’s USD 134 billion federal allocation for 2025-26, and Japan’s public backing for semiconductor hubs illustrate unprecedented state outlays that continue to anchor the APAC infrastructure market. Private investors are stepping in to bridge financing gaps through public-private partnerships that blend sovereign guarantees with performance-linked returns, while the push for climate-resilient assets is shifting a slice of capital toward green utilities and cross-border renewable grids. Supply-chain diversification away from single-country dependency further accelerates inland ports, freight rail upgrades, and port automation across emerging ASEAN economies. Finally, digital infrastructure, 5G corridors, fiber backbones, and edge data centers have become integral rather than optional, opening new revenue streams across the construction and operation phases.
Key Report Takeaways
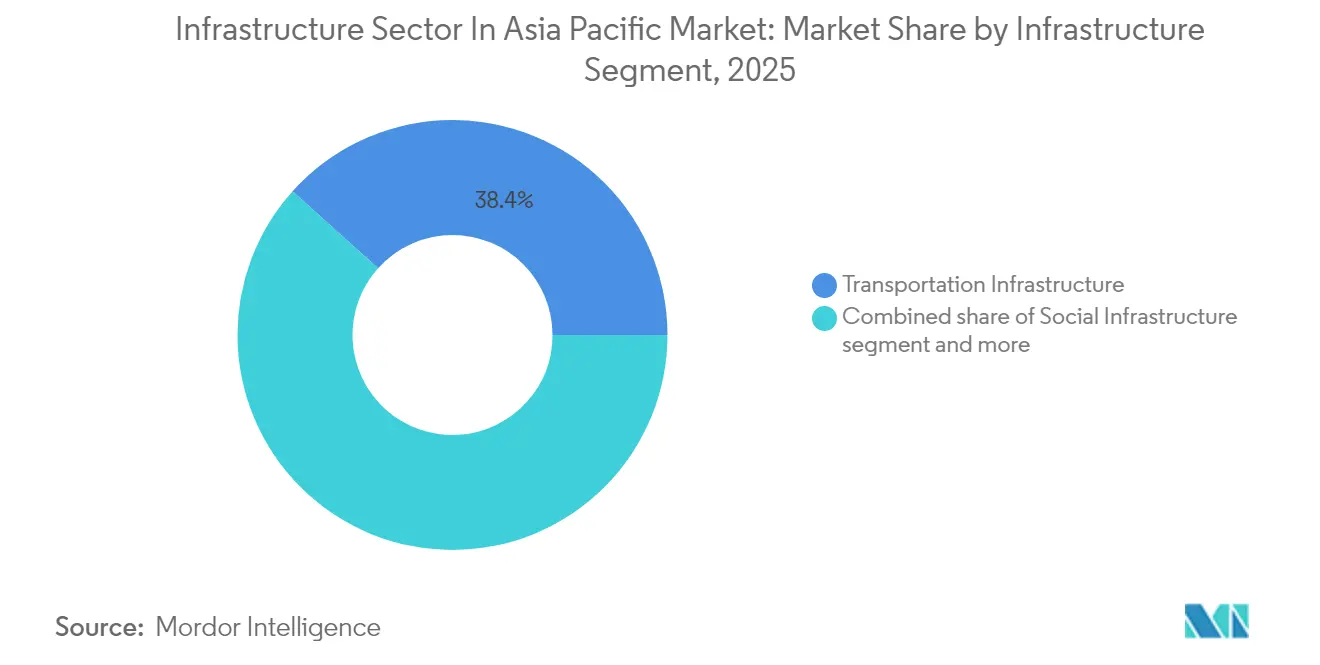
- By infrastructure segment, transportation led with 38.35% of APAC infrastructure market share in 2025 and is expanding at an 8.15% CAGR through 2031.
- By construction type, new builds accounted for 71.86% share of the APAC infrastructure market size in 2025, whereas renovation is advancing at an 7.78% CAGR during the outlook period.
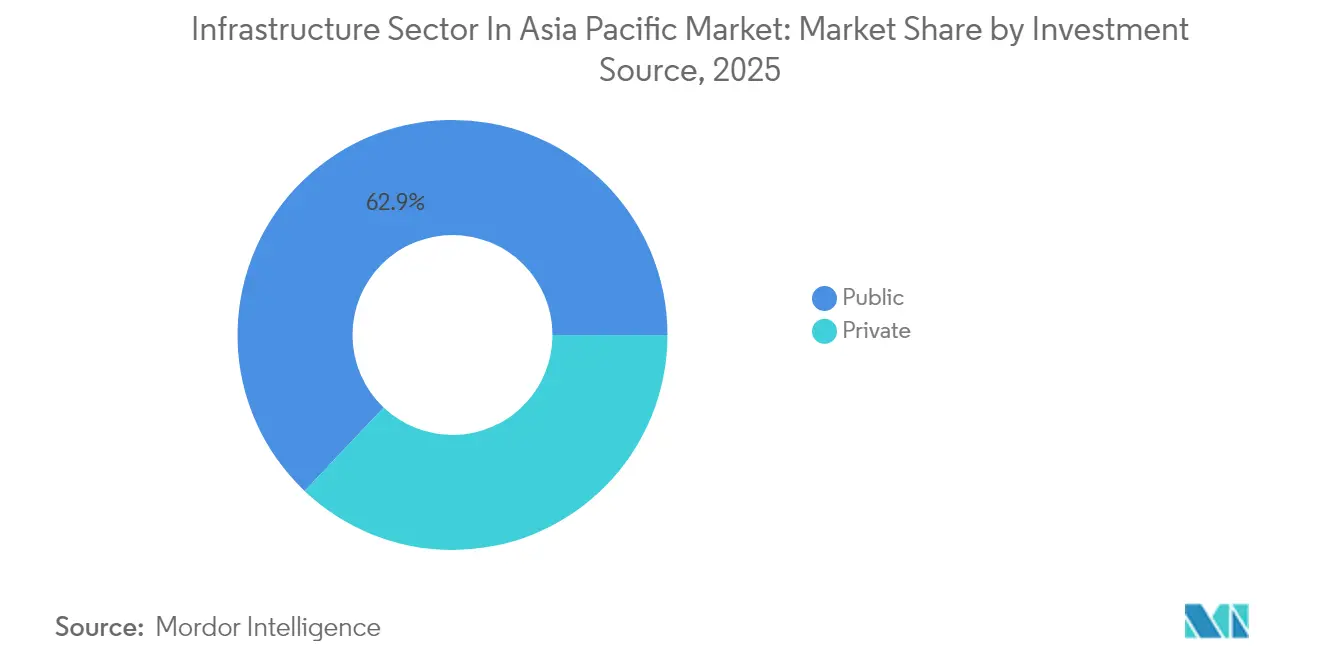
- By investment source, public capital commanded 62.92% of 2025 spending, while private financing is forecast to register the fastest 8.55% CAGR to 2031.
- By geography, China dominated with a 50.12% share of the APAC infrastructure market size in 2025; India records the highest 7.74% CAGR through 2031.
Note: Market size and forecast figures in this report are generated using Mordor Intelligence’s proprietary estimation framework, updated with the latest available data and insights as of 2026.
Infrastructure In Asia Pacific Market Trends and Insights
Drivers Impact Analysis*
| Driver | % Impact on CAGR Forecast | Geographic Relevance | Impact Timeline |
|---|---|---|---|
| Robust government infrastructure spending | 2.1% | China, India, Japan, South Korea | Medium term (2-4 years) |
| Accelerating urbanization & middle-class demand | 1.8% | India, ASEAN core countries | Long term (≥ 4 years) |
| 5G, data-center & fiber roll-outs | 1.4% | Global, with concentration in Japan, South Korea, Singapore | Short term (≤ 2 years) |
| Green & sovereign-wealth capital pivot to APAC | 0.9% | ASEAN, Australia, with spillover to India | Medium term (2-4 years) |
| Supply-chain diversification into ASEAN | 0.7% | ASEAN core, spillover to India | Medium term (2-4 years) |
| Climate-resilience upgrade mandates | 0.5% | Global, early gains in Australia, Singapore, Japan | Long term (≥ 4 years) |
| Source: Mordor Intelligence | |||
Robust Government Infrastructure Spending
Public budgets across the region continue to hit record levels. China has earmarked over USD 551 billion for “hidden” urban utilities and smart-city upgrades while concurrently adding 3,800 kilometers of high-speed rail by year-end. Japan is underwriting semiconductor “chip cities” with USD 27 billion in direct support that catalyzes USD 120 billion in downstream economic benefits. South Korea’s parliament approved USD 471 billion for a Gyeonggi semiconductor cluster and complementary road and rail links. These policies both stimulate near-term growth and strengthen technological sovereignty. Together, they raise baseline demand for construction services, machinery, and advanced project management tools across the APAC infrastructure market[1]Li Guanghua, “China to Spend 4 Trillion Yuan on Urban Hidden Infrastructure,” State Council Information Office, scio.gov.cn.
Accelerating Urbanization & Middle-Class Demand
Rapid urban migration is swelling consumption and stretching city limits. Southeast Asia’s GDP reached USD 3.6 trillion in 2022, and household spending is projected to cross USD 4 trillion by 2031, intensifying demand for mass transit and smart-utility grids. Programs such as Indonesia’s “Movement Toward 100 Smart Cities” layer digital sensors, open-data platforms, and climate-resilient drainage into every new township. Vietnam’s USD 67 billion north-to-south high-speed railway will cut travel times to six hours for 80% of urban residents, illustrating how quality-of-life upgrades translate into large transportation outlays. Urban green retrofits like Singapore’s Bishan-Ang Mo Kio Park show that nature-based drainage can raise biodiversity by 30% and still save 15% over concrete alternatives. These examples clarify why recurring city budgets and private mortgages will keep funneling capital into the APAC infrastructure market long after mega-projects finish.
5G, Data-Center & Fiber Roll-outs
Telecom infrastructure is evolving from consumer bandwidth plays to industrial productivity enablers. Thailand’s 5G factories report 15-20% efficiency gains, and Indonesian 5G warehouses see 25% faster pick-and-pack cycles. Regional data-center capacity hit 12,206 MW in 2024, with another 14,338 MW under development, fed by AI compute clusters and multi-cloud adoption. Amazon Web Services alone committed USD 15.4 billion (2.26 trillion JPY) to Japan by 2027, while CapitaLand is building a USD 700 million facility in Osaka. Second-tier cities now outbid capitals for server farms due to cost and power-grid headroom. Across the APAC infrastructure market, fiber densification underpins these deployments, anchoring private-equity interest in duct banks and tower portfolios.
Green & Sovereign-Wealth Capital Pivot to APAC
Sustainability mandates are converting boardroom pledges into shovel-ready projects. Australia approved a USD 19 billion solar farm that will export electricity to Singapore along a 4,300-kilometer undersea cable, redefining the scale of cross-border renewables. Japan’s Green Transformation Plan channels nearly EUR 1 trillion into decarbonization by 2035, funded by EUR 131.5 billion in transition bonds. Singapore’s Keppel forged a USD 1.5 billion alliance with the Asian Infrastructure Investment Bank for resilient assets across emerging markets. Meanwhile, ASEAN’s Power Grid Financing Facility backs multi-country transmission lines that could serve 670 million citizens. These flows widen the investor base for the APAC infrastructure market and add depth to secondary-market refinancing[2]John Martin, “ASEAN Power Grid Financing Facility Launch,” Asian Development Bank Institute Working Paper, adb.org.
Restraint Impact Analysis*
| Restraint | % Impact on CAGR Forecast | Geographic Relevance | Impact Timeline |
|---|---|---|---|
| Land-acquisition & permitting delays | -1.2% | India, Indonesia, Philippines | Medium term (2-4 years) |
| Public-debt & budget constraints | -0.8% | Global, acute in smaller ASEAN economies | Short term (≤ 2 years) |
| Skilled-labor shortfalls in megaprojects | -0.6% | Japan, South Korea, Singapore | Short term (≤ 2 years) |
| Heightened geopolitical risk premiums | -0.4% | China-dependent supply chains, cross-border projects | Medium term (2-4 years) |
| Source: Mordor Intelligence | |||
Land-Acquisition & Permitting Delays
Regulatory bottlenecks extend timelines and inflate costs. Japan’s Hokuriku Shinkansen extension now exceeds USD 36 billion, more than double the original outlay, after protracted community negotiations. Southeast Asia’s USD 100 billion super-grid faces multiple sovereignty approvals before any cable is laid. Even renewables hit hurdles: Australian solar and wind farms must clear heritage surveys, flora scans, and marine assessments despite federal fast-track lists. Local land-rights consultations add two to three years to project schedules in Indonesia and the Philippines. These frictions shave growth from the APAC infrastructure market unless digital permitting portals and standardized right-of-way frameworks scale rapidly.
Skilled-Labor Shortfalls in Megaprojects
Demographics and safety laws squeeze construction headcounts. Japan’s workforce shrank 20% in a decade; 36% of remaining workers are 55 or older, jeopardizing Expo 2025 deadlines. New overtime caps compound what the industry calls the “2024 problem,” as night-shift premiums no longer attract retirees back to sites. South Korea’s semiconductor cluster must train thousands of electricians and fit-out technicians within two years to keep fab equipment schedules. Contractors now deploy robotic rebar tiers, drone surveys, and modular building systems to reduce man-hours. If labor productivity lags, it could subtract meaningful points from the APAC infrastructure market CAGR.
*Our forecasts treat driver/restraint impacts as directional, not additive. The impact forecasts reflect baseline growth, mix effects, and variable interactions.
Segment Analysis
By Infrastructure Segment: Transportation Extends Lead Through Smart Mobility
Transportation captured 38.35% of 2025 spending and posts the fastest 8.15% CAGR, giving it a commanding position within the APAC infrastructure market. China’s network already spans 80% of the planned 50,000-kilometer high-speed grid and will add 3,800 kilometers this year. Vietnam’s USD 67 billion line targets a six-hour Hanoi-Ho Chi Minh trip time, while Thailand’s Eastern Economic Corridor channels USD 18.3 billion into airport-to-port rail loops. Smart-ticketing, predictive maintenance, and 5G-enabled driverless metros elevate operating margins and rider experience. Utilities follow as governments chase secure water and energy. China funded 1,488 water-conservancy projects in 2023, lifting spending by 41.7% for that vertical. Social infrastructure sees steady gains as aging demographics require hospitals and elder-care campuses; India’s new AIIMS campus spans 1.5 million ft² and serves as a prototype for tech-enabled healthcare. Extraction assets receive targeted boosts from low-carbon retrofits, such as Indonesia’s USD 7 billion CCUS at Tangguh that will bury 15 million tons of CO₂. Transportation’s dominance thus mirrors both connectivity imperatives and the smart-mobility premium embedded in the APAC infrastructure market.
Segment growth also benefits from financing innovations. Asset-recycling funds in Australia package mature toll roads into listed vehicles, freeing capital for inland freight routes. Digital-twin platforms help optimize rail and port layouts before ground breaks, cutting change orders by 30%. Collectively, these advances reinforce transportation’s outsized role in the APAC infrastructure market while opening niches for specialized contractors and software suppliers.


By Construction Type: Renovation Surges on Aging Stock
New builds retained 71.86% share in 2025 as governments green-light mega dams, chip fabs, and greenfield ports that align with industrial-policy goals. However, renovation grows at 7.78% CAGR because asset lifecycles in mature economies have crossed the 30-year threshold, triggering mandatory retrofits. Japan’s Green Transformation Plan dedicates nearly EUR 1 trillion to overhaul legacy bridges, tunnels, and district heating grids for carbon neutrality. China’s USD 551 billion “hidden infrastructure” campaign modernizes sewers, cable ducts, and smart-grid nodes beneath existing streets. Renovation projects attract specialized capital that values steady cash flows from concession renewals. Digital sensors and AI diagnostics now extend asset life by predicting fatigue cracks well before failure. Singapore’s Bishan-Ang Mo Kio Park proves nature-based riverbanks can replace concrete linings, saving 15% and lifting biodiversity by 30%. These examples signal why the renovation wave is reshaping procurement criteria, contractor skills, and risk models across the APAC infrastructure market.
By Investment Source: Private Capital Gains Momentum
Public treasuries still supplied 62.92% of 2025 outlays, anchored by China’s USD 554 billion local-government bond issuances and India’s USD 134 billion federal package. Yet private capital records a 8.55% CAGR as pension funds, sovereign wealth vehicles, and buy-out firms diversify into contracted-revenue assets. DigitalBridge’s USD 470 million purchase of JTOWER and CK Hutchison’s USD 22.8 billion port divestiture to a BlackRock-TiL consortium illustrate scale and appetite. Risk-sharing PPP structures now bundle availability payments with carbon-abatement bonuses to satisfy both fiduciary and ESG mandates. CapitaLand’s USD 700 million Osaka data center reaches financial close under a build-to-core schedule that enables recycling within five years. Indonesia’s Trans-Java Toll Road financing pulled USD 2.75 billion from Dutch and Gulf institutions on the back of traffic guarantees. These examples reinforce how private funding complements sovereign budgets to keep the APAC infrastructure market growth curve intact.
Geography Analysis
China held 50.12% of 2025 expenditure and retains structural advantages through scaled state-owned enterprises that secure domestic and foreign contracts. Fixed-asset investment hit 51.4 trillion yuan (USD 7.9 trillion) in 2024, with 5.6% growth in core infrastructure lines and 39.1% in water-management spending. The USD 167 billion Tibet hydropower project alone eclipses many national budgets and anchors supply chains from cement to advanced turbines. Belt and Road rail links such as the China-Laos route cut freight costs by 30% and consolidate regional influence.
India stands out as the fastest riser with an 7.74% CAGR, underpinned by unprecedented highways, power-grid corridors, and port-led industrial parks. The federal USD 134 billion 2025-26 allocation elevates infrastructure to 3.4% of GDP, while state governments add complementary metro and irrigation schemes. Technology-enabled contractors such as Sterlite Power now prefab transmission towers off-site, reducing right-of-way hours by 38%.
Japan and South Korea concentrate on high-tech, climate-safe assets. Japan’s USD 27 billion semiconductor incentives mesh with AWS’s USD 15.4 billion cloud cluster, bringing advanced logistics and district cooling to secondary prefectures. South Korea’s USD 471 billion semiconductor mega-site seeds housing, subways, and hydrogen fueling, integrating land-use with industrial policy. Across ASEAN, USD 206 billion in 2023 FDI funds inland ports, airport expansions, and resilience projects that address flood and power-grid vulnerabilities. The tiered growth landscape thus widens opportunity sets within the APAC infrastructure market.
Competitive Landscape
Consolidation remains moderate. The top five Chinese state-owned enterprises, China State Construction, China Railway Group, PowerChina, China Communications Construction, and China Energy Engineering, collectively manage roughly 48% of regional backlogs, yet face more contestable bids overseas. Landmark wins include a USD 2.1 billion mixed-use contract in Saudi Arabia and the USD 3.8 billion Changi Terminal 5 package, both secured against global competitors. Indian conglomerate L&T shipped the world’s heaviest EO reactor at 2,306 tons, showcasing heavy-lift expertise that complements on-site construction.
Strategic alliances help bridge technology gaps: Infravision pairs drones with Sterlite Power to string conductors across valleys, while Keppel teams with AIIB to originate sustainable-project pipelines worth USD 1.5 billion. BIM, AI scheduling, and low-carbon concrete adoption are now pre-qualifiers on mega-RFPs. Data-center specialists such as CapitaLand and Korea Investment enter the field through hyperscale builds, nudging traditional builders to acquire MEP and commissioning talent. Political risk and export-credit backing continue to shape bidder pools, meaning the APAC infrastructure market remains contestable yet favors players with deep balance sheets and technology stacks.
Infrastructure In Asia Pacific Industry Leaders
China State Construction Engineering (CSCEC)
China Communications Construction Company (CCCC)
Power Construction Corporation of China (PowerChina)
Samsung C&T
Obayashi Corporation
- *Disclaimer: Major Players sorted in no particular order

Recent Industry Developments
- July 2025: China started construction of the USD 167 billion Yarlung Tsangpo hydropower dam, expected to generate 300 billion kWh annually and create up to 200,000 jobs.
- June 2025: Singapore’s Keppel Corporation and Asian Infrastructure Investment Bank set up a USD 1.5 billion platform for climate-resilient projects in the Asia Pacific.
- May 2025: Changi Airport Group awarded USD 4.75 billion in Terminal 5 contracts; the largest USD 3.8 billion package went to China Communications Construction and Obayashi Singapore.
- March 2025: CK Hutchison closed the USD 22.8 billion sale of port stakes to the BlackRock-TiL consortium, covering 43 facilities across 23 countries.


Infrastructure In Asia Pacific Market Report Scope
Infrastructure is the backbone of domestic and international commerce and industrial and agricultural production. It is the fundamental organizational and physical framework necessary to operate a firm successfully. The infrastructure sector focuses on major infrastructure such as power, roads and bridges, dams, and urban infrastructure.
A complete background analysis of the market, including the assessment of the economy and contribution of sectors in the economy, market overview, market size estimation for key segments, and emerging trends in the market segments, market dynamics, and geographical trends is covered in the report.
The APAC infrastructure market is segmented by the infrastructure segment (social infrastructure, transportation infrastructure, extraction infrastructure, manufacturing infrastructure) and by country (China, India, Japan, South Korea, Philippines, and the rest of Asia-Pacific). The report offers market size and forecast values (USD) for all the above segments.
By Infrastructure Segment
| Transportation Infrastructure |
| Utilities Infrastructure |
| Social Infrastructure |
| Extraction Infrastructure |
By Construction Type
| New Construction |
| Renovation |
By Investment Source
| Public |
| Private |
By Geography
| China |
| India |
| Japan |
| South Korea |
| ASEAN (Indonesia, Thailand, Philippines, Malaysia, Vietnam) |
| Rest of Asia Pacific |
| By Infrastructure Segment | Transportation Infrastructure |
| Utilities Infrastructure | |
| Social Infrastructure | |
| Extraction Infrastructure | |
| By Construction Type | New Construction |
| Renovation | |
| By Investment Source | Public |
| Private | |
| By Geography | China |
| India | |
| Japan | |
| South Korea | |
| ASEAN (Indonesia, Thailand, Philippines, Malaysia, Vietnam) | |
| Rest of Asia Pacific |


Key Questions Answered in the Report
How large is the APAC infrastructure market in 2026?
It currently stands at USD 1.71 trillion, on track to grow to USD 2.33 trillion by 2031 at a 6.32% CAGR.
Which segment grows fastest within the region?
Transportation infrastructure shows the strongest 8.15% CAGR, driven by new high-speed rail and smart-mobility investments.
What role does private capital play?
Private financing is expanding at a 8.55% CAGR as pension funds and sovereign wealth vehicles fund data centers, toll roads, and renewable grids.
Which country adds the most infrastructure value?
China contributes 50.12% of 2025 spending, underpinned by mega-dams, rail expansion, and smart-city underground utilities.
Page last updated on:


