
Aluminum Market Analysis by Mordor Intelligence
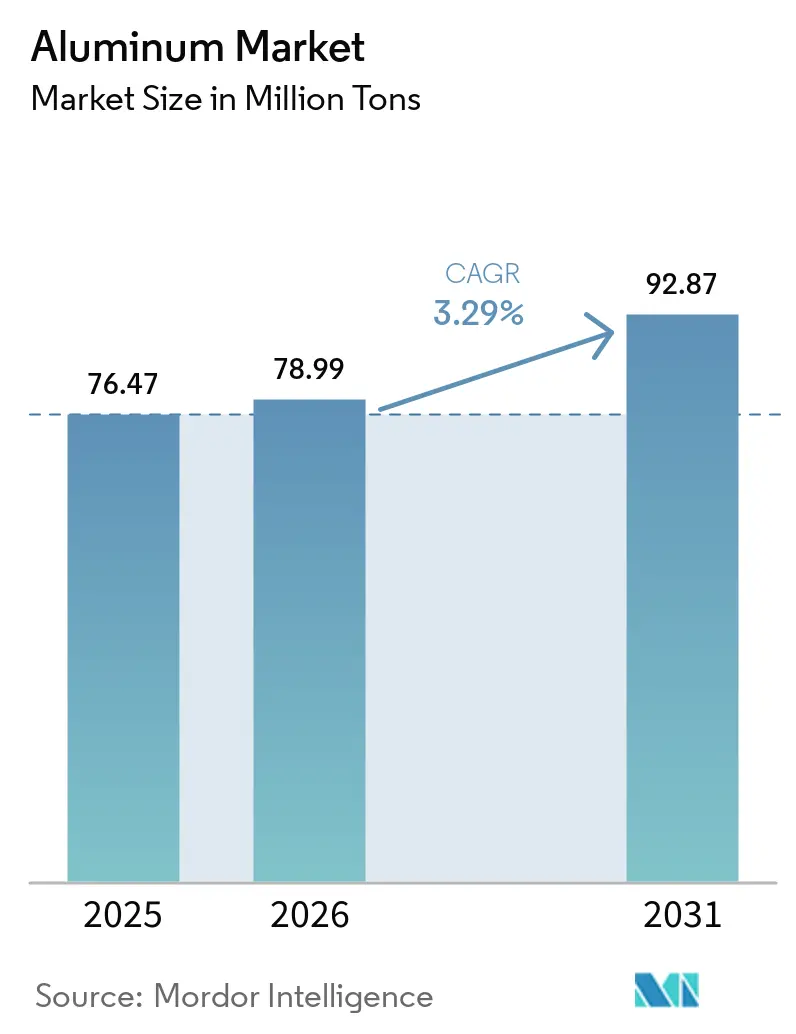
The aluminum market size is expected to grow from 78.99 million tons in 2026 to 81.59 million tons in 2027 and is forecast to reach 94.68 million tons by 2032 at 3.02% CAGR over 2027-2032.
Public infrastructure work in India, higher automotive aluminum intensity and solar-frame demand broaden the volume base. Automotive component design and integrated solar-frame production link that demand to specific conversion capabilities. Recycling investment can widen usable scrap inputs, but feedstock costs limit what added capacity alone can earn. The Iran conflict and Strait of Hormuz shipping disruption starting in February 2026 raised European energy-cost exposure. European conversion margins face particular pressure when electricity and border-carbon costs rise against globally benchmarked metal revenues.
Key Report Takeaways
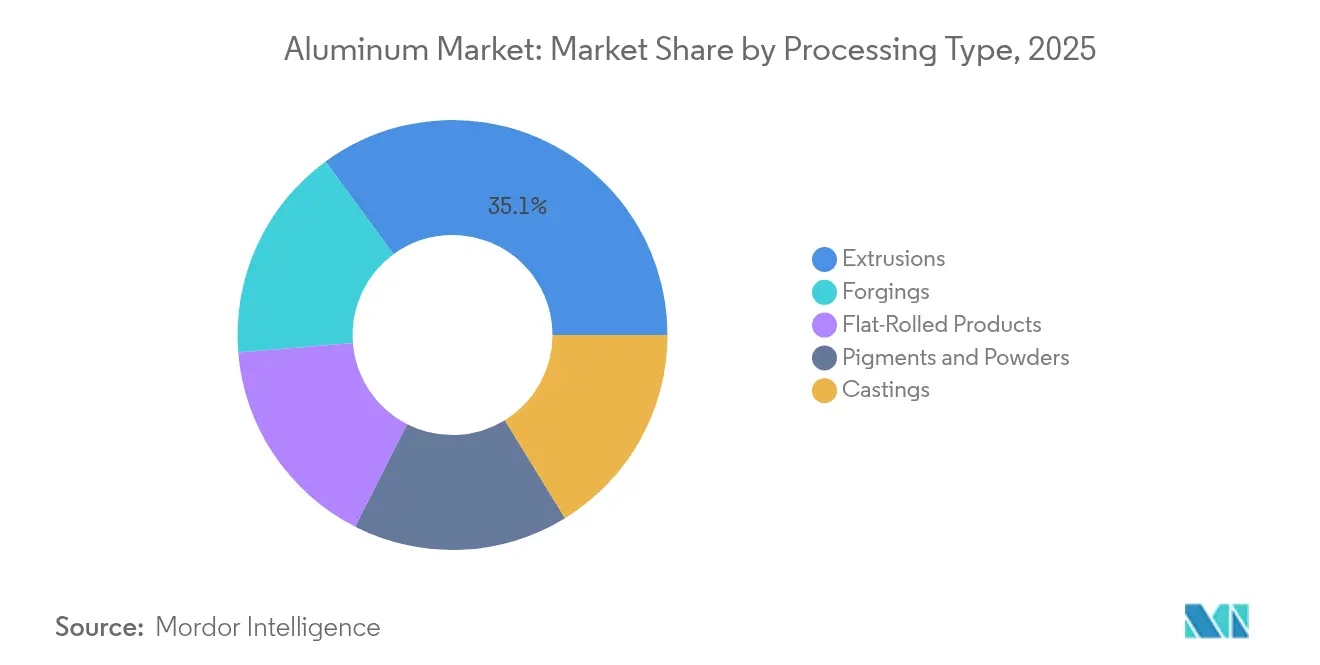
- By processing type, extrusions led with a 35.06% aluminum market share in 2026, while castings are forecast to grow fastest at a 3.3% CAGR over 2027-2032.
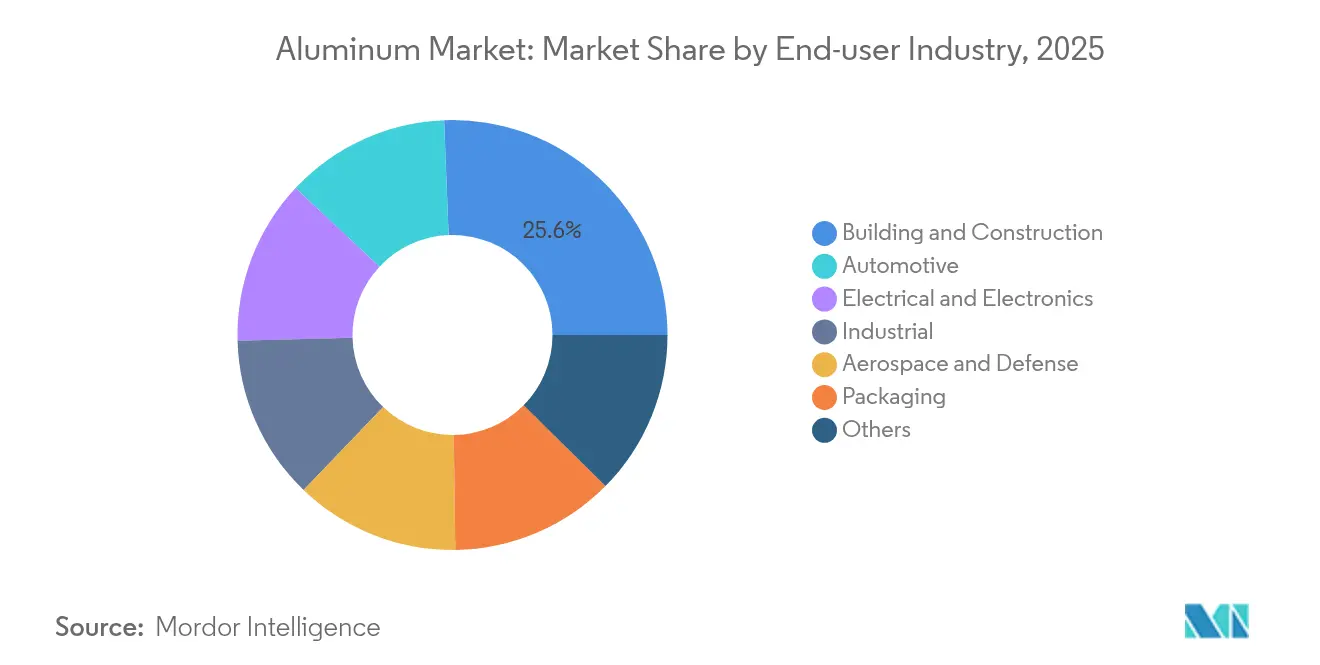
- Among end-user industries, the building and construction segment led with a 25.92% share of the aluminum market size in 2026 and is forecast to grow fastest at a 4.2% CAGR over 2027-2032.
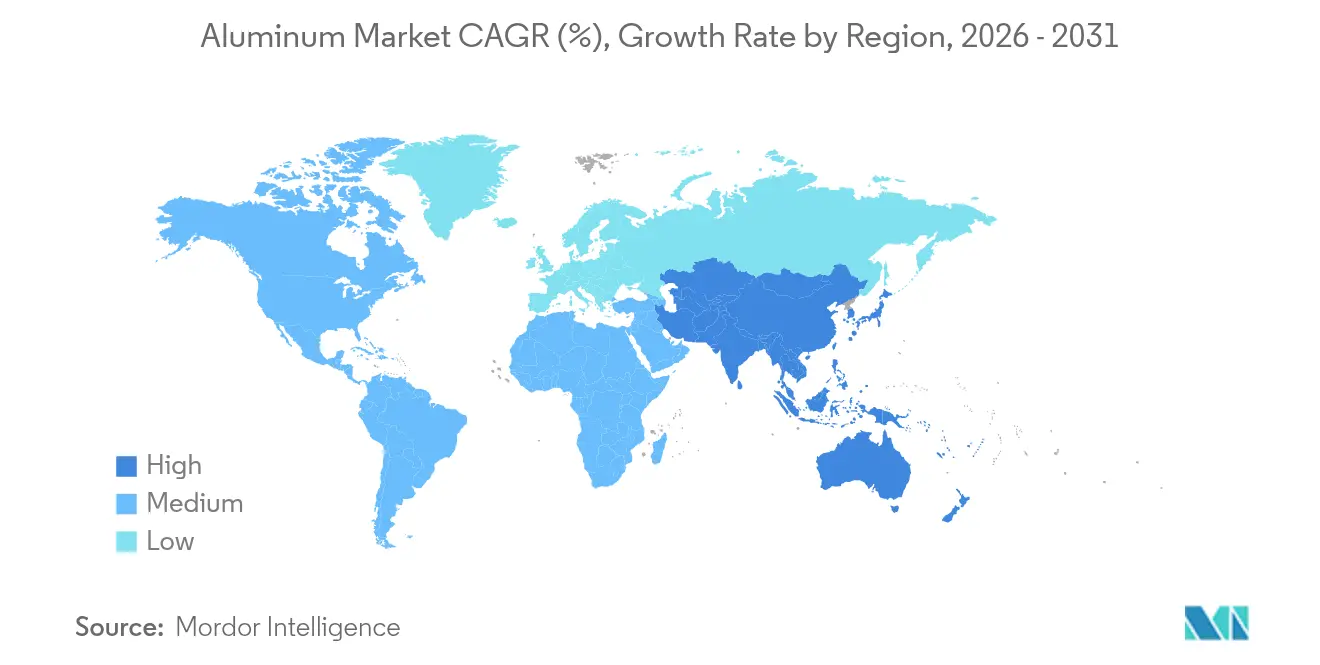
- Geographically, Asia-Pacific led with 69.74% of global processed-aluminum demand in 2026 and is forecast to grow fastest at a 3.25% CAGR over 2027-2032.
Note: Market numbers in this report are based on Mordor Intelligence's proprietary estimation framework, which combines nine months of actuals with Q4 projections for base year 2026.
Market Trends and Insights
Drivers Impact Analysis of Aluminum Market*
| Driver | (~) % Impact on CAGR Forecast | Geographic Relevance | Impact Timeline |
|---|---|---|---|
| Surging EV-Led Lightweighting Demand | +1.1% | European passenger-car markets | Medium term (2-4 years) |
| APAC Infrastructure Boom | +1.3% | India’s national infrastructure network | Medium term (2-4 years) |
| Renewable-Energy Aluminum Demand | +0.9% | India and Türkiye | Medium term (2-4 years) |
| Sustainable Packaging Shift | +0.7% | Brazil and Senegal | Short term (≤ 2 years) |
| Hydrogen-Ready Green Smelting Capacity | +0.2% | Alba smelter in Bahrain | Long term (≥ 4 years) |
| Source: Mordor Intelligence | |||
Surging EV-Led Lightweighting Demand
Electric vehicle (EV) lightweighting creates aluminum demand through higher material intensity and component designs that use space more efficiently. Average European passenger-car aluminum content nearly doubled from 121 kilograms in 2005 to 229 kilograms by November 2025.[1] The same Transport & Environment report expects average European battery electric vehicle aluminum content to reach 275 kilograms by 2035. In its FY2025 initiatives, AISIN reported that Toyota Motor Corporation electric vehicles had adopted its lighter, more space-efficient aluminum rocker material for collision management. For component suppliers, resolving collision-management packaging constraints creates a route into EV programs through component design as well as vehicle assembly volumes.
APAC Infrastructure Boom
Infrastructure renewal creates aluminum demand within established transport networks as well as through new construction. India’s finance minister proposed increasing overall public capital expenditure to INR 12.2 trillion (USD 133 billion) for FY 2026-27 as part of a continued infrastructure push. By July 2025, Metro Railway Kolkata had completed replacement of steel third rail with aluminum third rail across a 19.6-kilometer phase of its North-South Metro line. The work took place during noncommercial night hours without affecting daily operations. An aluminum third-rail retrofit must fit the operator’s night access windows, so the viable installation sequence constrains which material-replacement work can be delivered.
Renewable-Energy Aluminum Demand
Rising solar deployment increases demand for aluminum module frames and racking systems, according to the International Aluminium Institute’s 2026 assessment. India’s installed solar capacity increased from 97.86 GW in 2024 to 135.81 GW in 2025. CW Enerji’s Antalya aluminum-frame facility had entered mass production by May 15, 2025, and reported monthly capacity of 1,000 tons for the first half of 2026. The company had completed its first export shipment by its June 2026 report. With 80% of output designed for internal requirements and 20% planned for export, most frame-conversion demand is intended for CW Enerji’s own operations, leaving a smaller external sales channel.
Sustainable Packaging Shift
Certified sourcing gives aluminum packaging suppliers a route to compete beyond the physical can specification. On March 16, 2026, Ball partnered with Grupo Mariza to launch Nutrinéctar as Brazil’s first canned juice using aluminum certified by the Aluminium Stewardship Initiative (ASI).[2] The can carried the ASI Responsible Aluminium Sourcing label, linking the material claim directly to the packaged product. Scaling such products creates a role for suppliers able to preserve that specific sourcing claim across successive can deliveries.
Restraints Impact Analysis of Aluminum Market*
| Restraint | (~) % Impact on CAGR Forecast | Geographic Relevance | Impact Timeline |
|---|---|---|---|
| Energy-Price Volatility | -0.7% | Major European Union markets | Short term (≤ 2 years) |
| Carbon-Border Adjustment Costs and ESG Scrutiny | -0.4% | European Union import destinations | Medium term (2-4 years) |
| Graphene-Coated Steel Threat in Cans | |||
| Source: Mordor Intelligence | |||
Energy-Price Volatility
The Iran conflict and Strait of Hormuz shipping disruption starting in February 2026 increased European energy-cost exposure. European Aluminium reported that wholesale electricity prices in major European Union (EU) markets rose around 20% to 30% from February 28 through early March 2026.[3] The association said European producers and downstream manufacturers could not pass higher energy costs through because aluminum is globally priced. That mismatch can weaken the economics of supplying additional processed metal even when demand is available. In 2025, Norsk Hydro ASA used smelter power contracts lasting up to 20 years, mainly at fixed prices, supplemented by derivatives to manage volatility. Unprotected conversion activity faces the remaining risk that higher electricity bills absorb the margin earned from processing metal.
Carbon-Border Adjustment Costs and ESG Scrutiny
The EU Carbon Border Adjustment Mechanism (CBAM) adds a separate cost exposure to aluminum entering European supply chains. From January 1, 2026, EU importers or their indirect customs representatives importing more than 50 metric tons of CBAM goods must apply for authorized declarant status, and authorized declarants buy certificates. Aluminum is among the covered goods, which makes this an operating obligation for qualifying import flows. European Aluminium warned in July 2025 that the premium planned for January 2026 would raise raw-material and end-customer costs in Europe. With revenues tied to the global benchmark, European producers exposed to high energy and regulatory costs would bear the expected feedstock increase through narrower margins.
*Our forecasts treat driver/restraint impacts as directional, not additive. The impact forecasts reflect baseline growth, mix effects, and variable interactions.
Aluminum Market Segment Analysis
By Processing Type:
Scale and Process Investment Shape ConversionExtrusions accounted for a 35.06% share of the aluminum market size in 2026. The largest segment’s operating scale is illustrated by Norsk Hydro ASA’s 978,000 metric tons of external sales in its Extrusions business area in 2025. A replacement HybrEx extrusion line at Hydro’s Gainesville, Georgia, facility began operating in February 2026. Equipment supplier SMS group described the hybrid drive as using over 30% less energy than conventional extrusion presses. This replacement illustrates how an established extrusion business can pursue conversion-cost competitiveness through equipment renewal, creating commercial room within its existing production footprint.
Castings are forecast to be the fastest-growing segment at a 3.3% CAGR over 2027-2032. By September 2026, Volvo Cars was using 2 Bühler die-casting cells at Torslanda, Sweden, to produce a single aluminum rear underbody for the EX60. The part replaced about 100 conventionally manufactured and assembled components. Kobe Steel decided in July 2026 to expand Daian Works’ aluminum and magnesium sand-casting capacity, serving mainly commercial aircraft and defense customers, with mass production scheduled for 2028. Automotive structural die casting and aircraft sand casting direct foundry investment toward different equipment and customer programs.

By End-user Industry:
Construction Connects Demand to Project DeliveryBuilding and construction represented a 25.92% aluminum market share in 2026 and is forecast to be the fastest-growing segment at a 4.2% CAGR over 2027-2032. RUSAL reported that infrastructure projects increased aluminum demand in North America in 2025. Europe’s construction market stabilized as pent-up housing demand and rising government spending supported activity. China’s construction sector continued to decline that year. North American public works and European housing recovery provide separate routes to construction sales when national building cycles diverge.
Construction demand also reaches aluminum through project-specific façade packages that connect material processing with installation responsibilities. TGM installed Reynaers Aluminium’s ElementFaçade 7 at Eindhoven’s Eurostaete tower, using 58 prefabricated components per floor and an integrated window for natural ventilation. In February 2026, developer Van Deursen Group reported construction complete, with most of the project’s 479 apartments and ground-floor commercial space in use. AFI is an aluminum-façade contractor backed by an aluminum extrusion producer. The commercial opening extends from supplying processed profiles to delivering a façade package that a construction contractor can assign to one specialist.
Geography Analysis
Asia-Pacific Aluminum Market
Asia-Pacific held a 69.74% aluminum market share in 2026 and is forecast to be the fastest-growing region at a 3.25% CAGR over 2027-2032. RUSAL reported that China’s primary-aluminum consumption increased 3.4% to 46.5 million metric tons in 2025, providing a large national demand base within the region. The producer attributed the increase to government incentive measures, linking the expansion to a policy-supported consuming base. Indonesian producer Inalum reported nearly flat company-wide aluminum sales in January-August 2026 compared with the same period in 2025.
In North America, preliminary 2025 demand estimates for the United States and Canada included domestic producer shipments plus imports. Extrusion demand fell 3.1%, while sheet and plate, foil, and electrical wire and cable demand showed modest growth. In Europe, production of aluminum foil below 60 micrometers, mainly used in flexible packaging and household applications, increased 3% in 2025 from 2024. Demand for that foil category weakened in the fourth quarter, separating the full-year output result from year-end buying conditions. In Norway, Statkraft and Alcoa signed power agreements in June 2026 supporting continued operation of Alcoa’s Lista aluminum plant, anchoring supply to secured electricity.
In South America, Brazil’s electricity-sector aluminum consumption grew 10.2% in 2025, driven by transmission and distribution investment resulting from ANEEL auctions. Chile’s legally defined packaging producers must join a management system for collection and recovery obligations covering aluminum packaging waste. United Arab Emirates (UAE)-based Emirates Global Aluminium PJSC (EGA) reported worldwide cast-metal output of 1.01 million metric tons in H1 2026 versus 1.42 million in H1 2025, mainly reflecting reduced Al Taweelah production after Iranian attacks on Khalifa Economic Zone Abu Dhabi forced its March 28, 2026 shutdown. On September 30, 2026, EGA and Gulftainer agreed on prospective UAE East Coast export routing, with Gulftainer to develop port capabilities. For export customers in Middle-East and Africa, supply reliability hinges on both smelting recovery and the development of usable port channels.
Regulatory Framework and Outlook
The selected jurisdictions comparison assesses the cost and predictability of production and market-access requirements for aluminum suppliers serving each country’s customers. China included 97 aluminum-smelting entities in national carbon-market quota management in 2025. In the United States, Annex I-A duties apply from April 6, 2026, to goods entered for consumption or withdrawn from warehouses for consumption, subject to product and origin exceptions. Under the same entry conditions, the temporary Annex I-C schedule operates from June 8, 2026, through December 31, 2027, subject to its specific product and origin exceptions.
Regulatory Table of Aluminum Market
| Decision factor | China | United States | Germany | Brazil | South Africa |
|---|---|---|---|---|---|
| Primary authority | Ministry of Ecology and Environment | CBP for customs administration; Commerce for monitoring | European Commission for the EU framework | Ministry of Finance, Extraordinary Secretariat for the Carbon Market (SEMC) for initial implementation | South African Revenue Service |
| Key instruments or direction | National emissions market; free intensity-based 2026 allocation for listed smelters | Section 232, Annex I-A and Annex I-C schedules | EU carbon-border regime for covered imports; Emissions Trading System (ETS) free allocation | Law 15.042/2024, Brazilian emissions-trading system (SBCE); proposed monitoring, reporting and verification (MRV) for primary aluminum | Carbon Tax Act; scheduled statutory rate increases |
| Commercial effect | Emissions compliance for covered smelting processes | Additional duties of 50% for Annex I-A and 25% for Annex I-C, subject to product and origin exceptions | Authorization and certificate costs for qualifying imports; declining free-allowance protection for covered producers | Reporting preparation for proposed primary-aluminum coverage | Emissions levy for qualifying facilities, subject to thresholds and allowances |
| Current policy attractiveness | Medium | Low | Medium | Medium | Medium |
| Future direction of policy attractiveness | No change | No change | Hardening | Hardening | Hardening |
| Source: Mordor Intelligence | |||||
Free allocation and the unchanged 2026 method support near-term continuity in China, whereas Germany faces gradual withdrawal of free ETS protection for CBAM-covered sectors over 2026-2038. US duty schedules stand alongside a July 20, 2026 direction to Commerce to establish reduced-duty primary-aluminum imports for approved domestic investment plans, with annual quantities linked to anticipated completed-project output, construction-start commitments by January 20, 2029, and refurbishment relief limited by investment value. Brazil’s July 2026 proposal would add primary-aluminum monitoring, reporting and verification from 2027, a phase of compliance work separate from emissions-cap and reconciliation duties. South Africa’s qualifying facilities face enacted statutory rate increases from 2027 through 2030, with thresholds and allowances determining how those headline rates translate into individual liabilities.
Value Chain Stages
The value chain comparison connects feedstock availability, metal production and downstream conversion with the earnings and constraints at each stage. Alcoa’s unaudited 2025 segment figures included USD 3.71 billion in third-party alumina sales and USD 2.11 billion in intersegment alumina sales. In 2025, Emirates Global Aluminium PJSC secured alternative bauxite supply options from Australia, Ghana and Brazil after Guinea terminated its basic agreement and revoked the mining license of Guinea Alumina Corporation (GAC). On October 5, 2026, EGA reported that a first bauxite shipment under its renewed agreement with Compagnie des Bauxites de Guinée was en route to the UAE after loading at Kamsar in late August.
Value Chain Analysis Table of Aluminum Market
| Primary activity | Key participants | Value capture | Bottleneck | Resilience response |
|---|---|---|---|---|
| Bauxite mining and alumina refining | Miners and refiners such as Alcoa Corporation, Rio Tinto | Bauxite and refined-alumina sales | Dependence on individual licensed supply sources | Diversify bauxite sources and preserve sourcing options |
| Primary smelting and casting | Smelters such as Alcoa Corporation, Rio Tinto | Primary-metal and cast-product sales | Alignment of usable alumina supply with smelting needs | Maintain alternative refined-feedstock sources |
| Recycling and remelting | Recycling operators such as Norsk Hydro ASA, Novelis Inc. | Recycled-product sales and processing value | Scrap-cost pressure relative to finished-product demand | Improve sorting to access lower-grade scrap |
| Rolling and extrusion | Rollers such as Novelis Inc.; extruders such as Norsk Hydro ASA | Product sales; Novelis conversion premiums | Recovery of conversion costs alongside metal-price exposure | Separate metal pass-through from conversion pricing |
| Source: Mordor Intelligence | ||||
Novelis’s fiscal 2026 pricing model separated aluminum pass-through from a conversion premium covering conversion costs plus margin for nearly all its flat-rolled products. Hydro reported pressure on recycled extrusion-ingot and foundry-alloy margins in 2025 from weak end-product demand and tight scrap markets. Novelis also reported stronger scrap competition and reduced scrap-use benefits in fiscal 2025, followed by improvement in certain spot scrap spreads. Sorting capability can protect recycling value by widening usable scrap grades when competition for feedstock compresses the benefit from remelting.
Competitive Landscape
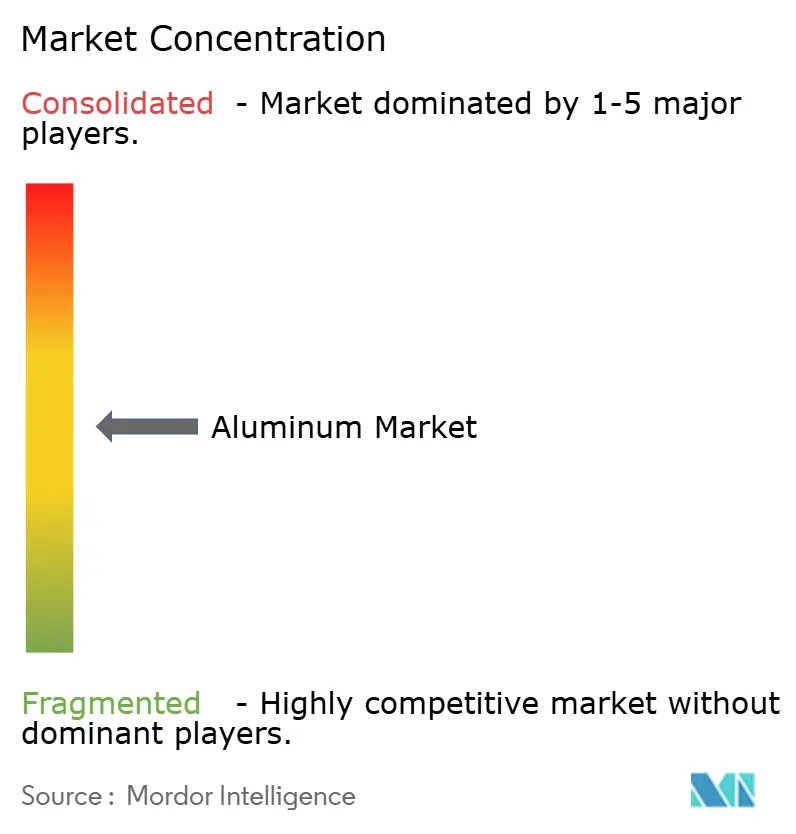
The competitive structure combines multi-million-metric-ton producer sales with customer-specific supply agreements built around low-carbon aluminum. Aluminum Corporation of China Limited (Chalco) sold 8.07 million metric tons of self-produced primary aluminum and alloy externally in 2025, up 6.18% year over year. China Hongqiao Group Limited sold approximately 2.81 million metric tons of aluminum alloy products in the first half of 2026, down approximately 3.3% from the corresponding 2025 period. In 2025, Norsk Hydro ASA signed a partnership with European cable producer NKT to guarantee supply of low-carbon aluminum. For cable manufacturers, that supply commitment connects the metal’s low-carbon specification to an agreed customer relationship, beyond the large-volume sales model.
On September 28, 2026, Rio Tinto agreed to exclusively market billet produced by RevoCast at Langley, British Columbia, for North American extrusion customers. RevoCast’s facility, commissioned in August 2026, combines Rio Tinto primary aluminum with recycled aluminum, separating the casting operator’s role from the marketer’s role. RUSAL began industrial production of higher-recycled-content alloys for automotive and packaging applications in the first half of 2025. The agreement gives specialist casting a route to extrusion customers through Rio Tinto’s marketing, while RUSAL broadens its automotive and packaging offer through alloy development.
On September 10, 2026, Emirates Global Aluminium PJSC (EGA) completed its acquisition of an 80% stake in Italian aluminum recycler Eco Green. The Scappini family retained minority ownership and management roles. With Eco Green, EGA reported more than 400,000 metric tons of annual recycling capacity across the UAE, the United States, Germany and Italy. For covered EU aluminum flows from 2026, carbon-border obligations and the gradual withdrawal of free ETS protection add a regulatory dimension to supplier selection. EGA can compete for European recycled-metal customers through an acquired production base, with regulatory exposure determined at the applicable import or production stage.
Aluminum Industry Leaders
-
Aluminum Corporation of China Limited (Chalco)
-
China Hongqiao Group Limited
-
Norsk Hydro ASA
-
Rio Tinto
-
RUSAL
- *Disclaimer: Major Players sorted in no particular order
Aluminum Market Companies Covered in this Report
- Alcoa Corporation
- Aluminium Bahrain B.S.C. (Alba)
- Aluminum Corporation of China Limited (Chalco)
- China Hongqiao Group Limited
- East Hope Group
- Emirates Global Aluminium PJSC
- Novelis Inc.
- Norsk Hydro ASA
- Rio Tinto
- RUSAL
- Xinfa Group
- Vedanta Aluminium
- Century Aluminum Company
Key Opportunities for Market Participants
The opportunities compare qualifying aluminum products for Canadian federal projects with recyclable packaging for EU customers. Canada’s policy has applied since December 16, 2025, to covered federal construction and defense-goods contracts of at least CAD 25 million (USD 18.18 million), including taxes. Canadian aluminum is required when expected aluminum use reaches CAD 250,000 (USD 181,845), subject to framework coverage and approved exceptions. For materials other than sheets and plates, the largest volume of contained primary aluminum must have been produced in Canada, while sheets and plates qualify with any percentage of Canadian primary aluminum.
Market Opportunities Table of Aluminum Market
| Opportunity | Why now | Buyer / lead segment | Recommended play | Main barrier | Likely beneficiaries |
|---|---|---|---|---|---|
| Origin-qualified extrusions for federal construction | Canadian-material conditions apply to covered federal construction | Construction contractors serving Canadian federal buyers | Bundle qualifying profiles with material-origin evidence | Establishing origin through subsequent fabrication | Qualifying Canadian-primary-aluminum extrusion producers and processors |
| Qualifying sheet and plate for defense goods | Covered Canadian defense contracts require qualifying aluminum | Contractors supplying Canadian federal defense goods | Build the sheet and plate offer around its applicable Canadian-primary-content test | Aligning material eligibility with each contract’s coverage | Sheet and plate suppliers using qualifying Canadian primary aluminum |
| Recyclability-qualified aluminum packaging | EU Regulation 2025/40 began phased application in August 2026; all-packaging recyclability requirements apply from 2030 | EU packaging producers and brand owners | Develop aluminum formats validated against applicable recyclability criteria | Demonstrating the finished format’s recyclability | Aluminum packaging converters able to meet the criteria |
| Source: Mordor Intelligence | |||||
Exceptions require the relevant minister’s approval, plus additional approval for common-service-provider procurements, and cover documented overall cost increases of at least 25%, public interest, Canadian availability or quality shortfalls, critical defense or national-security equipment delays, and commercial or military off-the-shelf products. EU Regulation 2025/40 began phased application on August 12, 2026, and requires all packaging to be recyclable from 2030. The central opening across both regimes is aluminum product supply backed by evidence that the finished product meets its applicable eligibility test. Canadian federal projects are the nearer opening because the origin rule has applied since December 16, 2025, while the EU all-packaging recyclability test applies from 2030.
Recent Industry Developments in Aluminum Market
- Oct 2026: Novelis Inc. produced its first cold-mill coil at the Bay Minette, Alabama, aluminum recycling and rolling plant. Commissioning continued, with commercial shipments expected in the second quarter of 2027.
- Oct 2026: Rio Tinto and the Australian and Tasmanian governments agreed to secure continued operation of Bell Bay Aluminium in northern Tasmania through the end of 2031.
- Sep 2026: Volvo Cars began series production of the EX60’s single-piece aluminum rear underbody using 2 Bühler Carat 840 die-casting cells at its Torslanda plant in Sweden.
Aluminum Market Report Scope and Research Methodology
Market Definition and Coverage
The Aluminum market measures annual volume, in tons, of aluminum products consumed globally. It covers demand for aluminum products across the report's processing classifications and end-user industries.
Scope exclusions: Bauxite and alumina, aluminum scrap sold separately as feedstock, finished goods containing aluminum, and fabrication, installation, recycling or repair services sold separately are excluded.
Segments Covered in This Report
- By Processing Type
- Castings
- Extrusions
- Forgings
- Flat-Rolled Products
- Pigments and Powders
- By End-user Industry
- Automotive
- Aerospace and Defense
- Building and Construction
- Electrical and Electronics
- Packaging
- Industrial
- Others
- By Geography
- Asia-Pacific
- China
- India
- Japan
- South Korea
- Rest of Asia-Pacific
- North America
- United States
- Canada
- Mexico
- Europe
- Germany
- United Kingdom
- France
- Italy
- Russia
- Rest of Europe
- South America
- Brazil
- Argentina
- Rest of South America
- Middle-East and Africa
- Saudi Arabia
- South Africa
- Rest of Middle-East and Africa
- Asia-Pacific
Data Sources, Market Sizing, and Validation
Desk Research
Public sources such as International Aluminium Institute statistics, the U.S. Geological Survey's Mineral Commodity Summaries, United Nations Comtrade records for aluminum trade, and World Bank Commodity Markets data help analysts examine production, trade, prices and material flows. These sources provide independent signals for checking annual global demand and the movement of aluminum products across regions.
Company annual reports and investor materials can clarify shipment trends and end-market exposure, while reputable business press helps track capacity changes and material events for comparison with public statistics. These named sources are not exhaustive, and further sources inform collection, validation and clarification.
Primary Interviews and Surveys
Structured interviews and surveys would include primary producers, secondary processors, fabricators, distributors and buyers in major aluminum-consuming industries across APAC, EMEA and the Americas. Respondents would test secondary-source interpretations of product flows, end-use demand and regional shares, and clarify discrepancies in how shipments and consumption are recorded. When evidence is missing or inconsistent, analysts would document the gap, seek clarification from knowledgeable participants and compare the response with trade, production and company disclosures before using it in the estimate.
Distribution of primary research fieldwork respondents
| Company type | Respondent position | Region |
|---|---|---|
| Top tier: 30% | CXOs: 20% | APAC: 45% |
| Mid tier: 45% | Functional/Unit leaders: 35% | EMEA: 30% |
| Smaller Players: 25% | Managers: 45% | Americas: 25% |
Market-Sizing & Forecasting
A top-down model estimates global annual tons of processed aluminum demand from published consumption and shipment measures, then checks the total against selected producer and fabricator shipment roll-ups. Vehicle production and aluminum intensity, construction activity, packaging output, electrical infrastructure investment, and trade in aluminum products help explain and forecast demand. Production and scrap-use indicators help distinguish primary supply from total product availability. Scenario analysis translates these drivers into a forecast under alternative assumptions for end-market activity and supply conditions, while sampled supplier and channel checks test whether the implied product volumes are plausible. Product, end-use and regional shares are built from shipment, trade and end-market evidence, with adjustments for the same aluminum moving through successive fabrication stages so it is counted once. Where sampled roll-ups or source series are incomplete, analysts record the coverage gap, use the nearest comparable public indicators and test the effect of reasonable alternatives. Interviews can check variable-level assumptions before forecasts are finalized.
Data Validation & Update Cycle
Analysts triangulate market totals and segment shares across production, trade, shipment and end-use signals, then investigate material differences in coverage, timing or units. They check outliers and year-over-year movements against independent indicators, correct or explain anomalies before sign-off, and re-contact a source when a key definition or reported change remains unclear. The series is refreshed annually, revisited between cycles when a material event changes supply or demand, and reviewed again in a fresh pre-delivery pass.
Mordor Intelligence's Aluminum Market Sizing Compared With Other Published Estimates
Published estimates can differ in the transactions and products they count and the inputs used to model demand. The Aluminum market measures annual volume, in tons, of aluminum products consumed globally.
Key Gap Drivers include the study's defined coverage and market-specific modeling choices. Production and scrap-use indicators help distinguish primary supply from total product availability.
Benchmark comparison
| Source | Market Size | Gaps in Research Methodology |
|---|---|---|
| Mordor Intelligence | 81.59 million tons (2027) | |
| Market Research Publisher A | 75 million tons (2025) | At its 2025 base, this estimate is 8.1% below this report's 2027 value of 81.59 million tons, 2 years later. Its reported base year is earlier than the comparison year, and its stated forecast period describes continued market growth. |
| Producer Annual Report A | 73.5 million tons (2025) | At its 2025 base, this estimate is 9.9% below this report's 2027 value of 81.59 million tons, 2 years later. The estimate covers primary aluminum demand, a narrower material basis than total demand for processed products, including recycled aluminum. |
Mordor Intelligence's analysts triangulate market totals and segment shares across production, trade, shipment and end-use signals, then investigate material differences in coverage, timing or units.
Key Questions Answered in the Report
What is the aluminum market size and growth outlook?
The size is projected at 81.59 million tons in 2027 and 94.68 million tons by 2032, with a 3.02% CAGR over 2027-2032.
What is driving demand for processed aluminum?
EV lightweighting, infrastructure, solar frames and certified packaging are demand drivers. India’s installed solar capacity reached 135.81 GW in 2025.
Which processing type leads global processed-aluminum demand?
Extrusions led with a 35.06% share in 2026, while castings are forecast to grow fastest at a 3.3% CAGR over 2027-2032.
Which companies are major aluminum suppliers?
Major suppliers include Aluminum Corporation of China Limited (Chalco), China Hongqiao Group Limited, Norsk Hydro ASA, Rio Tinto and RUSAL.
What is a key challenge for aluminum processors?
Energy-cost volatility pressures conversion economics. European Aluminium reported around 20% to 30% higher wholesale electricity prices in major EU markets from February 28 through early March 2026.
Where is processed-aluminum demand most concentrated?
Asia-Pacific held a 69.74% share in 2026 and is forecast to grow at a 3.25% CAGR over 2027-2032, the fastest regional pace.