
Market Overview
| Study Period | 2021 - 2031 |
|---|---|
| Market Size (2026) | USD 10.46 Billion |
| Market Size (2031) | USD 13.70 Billion |
| Growth Rate (2026 - 2031) | 5.55 % |
| Fastest Growing Market | Asia Pacific |
| Largest Market | Asia Pacific |
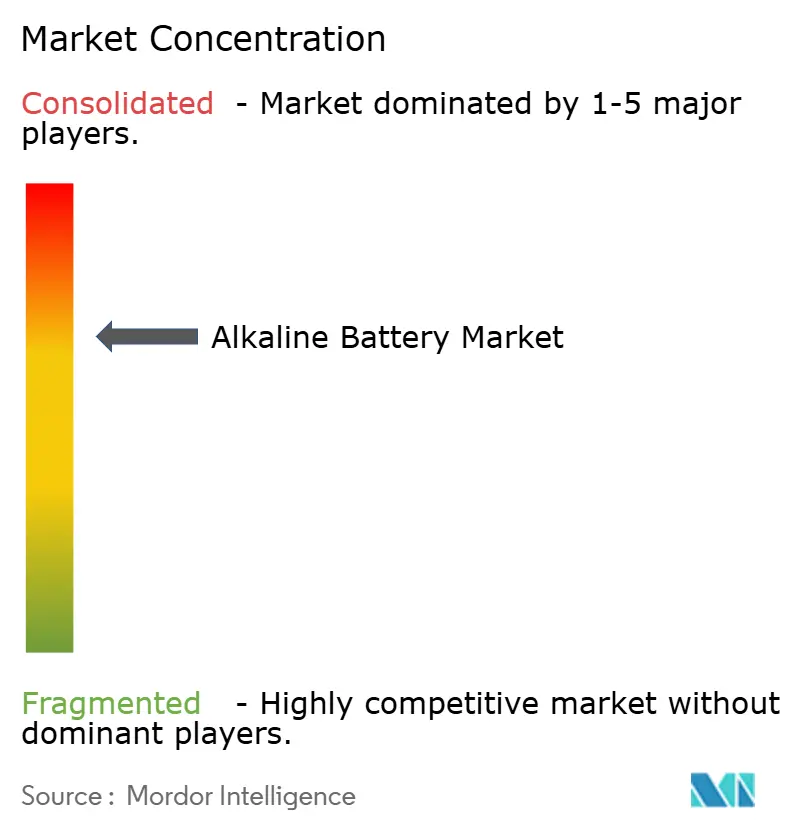
| Market Concentration | Medium |
Major Players *Disclaimer: Major Players sorted in no particular order Image © Mordor Intelligence. Reuse requires attribution under CC BY 4.0. | |
Alkaline Battery Market Analysis by Mordor Intelligence
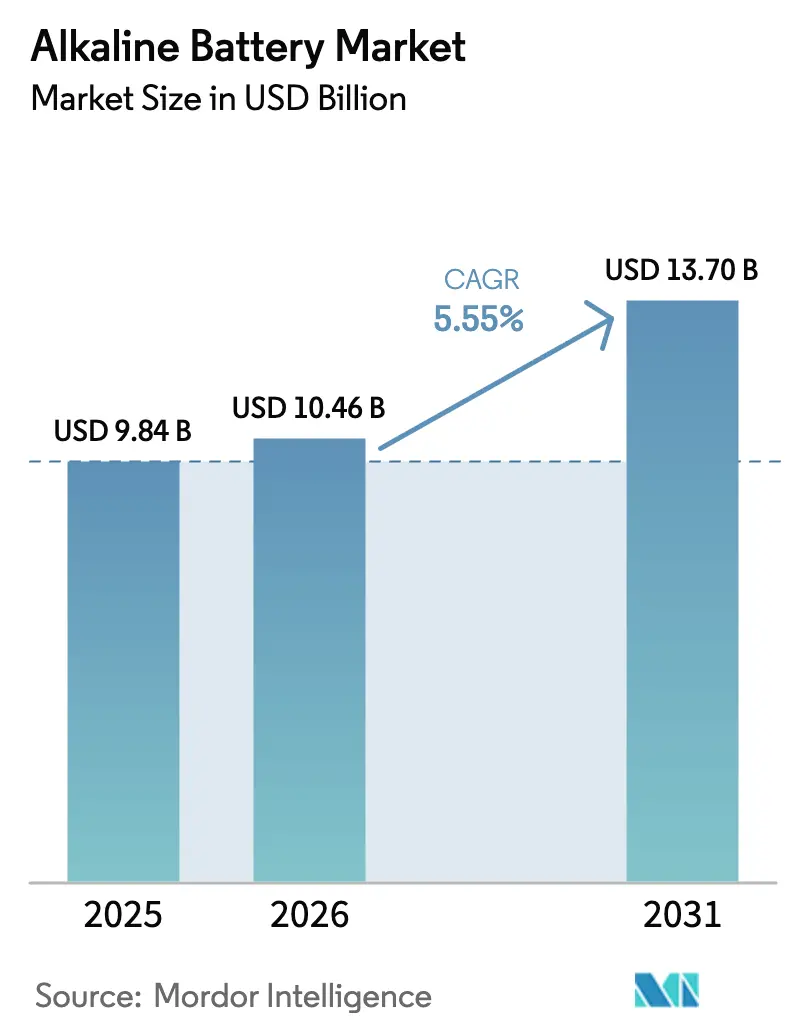
The Alkaline Battery Market size was valued at USD 9.84 billion in 2025 and is estimated to grow from USD 10.46 billion in 2026 to reach USD 13.70 billion by 2031, at a CAGR of 5.55% during the forecast period (2026-2031).
Growth rests on three structural pillars: the durability that low-drain IoT sensors require, widening use in affordable medical diagnostics, and rising demand for emergency-preparedness kits that favor long shelf-life chemistries. Premium brands protect price points through leak-proof seals, while organized retail expansion in India, Brazil, and parts of the Middle East broadens consumer access.[1] Supply-chain resilience remains a watchpoint because zinc and manganese ores are geographically concentrated, yet regional players continue to enter, attracted by stable demand curves across consumer and institutional channels.
Key Report Takeaways
- By battery type, primary cells controlled 74.5% of the alkaline battery market share in 2025, and secondary rechargeable formats are projected to expand at an 8.9% CAGR through 2031.
- By size, AA held a 43.9% share of the alkaline battery market in 2025, while 9-volt units are expected to post a 9.2% CAGR to 2031.
- By application, consumer electronics led with 45.6% revenue share in 2025; medical devices are forecast to record the fastest 9.5% CAGR through 2031.
- By geography, Asia-Pacific captured 38.3% of the alkaline battery market in 2025 and is set to grow at 6.4% annually up to 2031.
Note: Market size and forecast figures in this report are generated using Mordor Intelligence’s proprietary estimation framework, updated with the latest available data and insights as of January 2026.
Market Trends and Insights
Drivers Impact Analysis of Alkaline Battery Market*
| Driver | (~) % Impact on CAGR Forecast | Geographic Relevance | Impact Timeline |
|---|---|---|---|
| Rising demand for disposable power in consumer electronics | +1.2% | Global, strongest in Asia-Pacific and North America | Medium term (2-4 years) |
| Penetration of low-drain IoT sensing devices | +1.5% | Global, APAC core with spill-over to North America and Europe | Long term (≥ 4 years) |
| Expansion of organized retail in emerging economies | +0.9% | Asia-Pacific, Latin America, Middle East | Medium term (2-4 years) |
| Growing off-grid emergency-preparedness spend | +0.7% | North America, Middle East, Africa, ASEAN | Short term (≤ 2 years) |
| Military need for wide-temperature-range primary cells | +0.5% | North America, Europe, Middle East | Long term (≥ 4 years) |
| Post-mercury regulations opening new retail channels | +0.6% | Global, accelerated in EU and North America | Medium term (2-4 years) |
| Source: Mordor Intelligence | |||
Rising Demand for Disposable Power in Consumer Electronics
Consumer electronics retained a 45.6% share in 2025, yet usage is splitting between premium gadgets adopting lithium-ion and a large installed base of low-drain peripherals, remote controls, clocks, and smart-home sensors that still prefer alkaline for cost and reliability.[2] India’s retail modernization placed branded batteries on organized shelves, lifting unit volumes as shoppers traded up from zinc-carbon packs. Panasonic and Duracell now market extended-life AA and AAA lines with 10-year leak-proof guarantees aimed at smart-home hubs. Although USB-rechargeable devices proliferate in affluent segments, volume growth in entry-level gadgets across Asia and Latin America preserves a robust replacement cycle. The net result is a stable demand core that underpins the alkaline battery market even while lithium-ion expands elsewhere.
Penetration of Low-Drain IoT Sensing Devices
City governments in Singapore, Shenzhen, and Seoul deploy thousands of air-quality or parking sensors that draw micro-amp currents, a sweet spot where alkaline delivers better cost-per-watt than zinc-carbon without the hazardous-waste labeling lithium-primary chemistries require. Compliance with IEC 60086 enables interchangeable sourcing, an advantage during component shortages. Vendors adopt standardized AA cartridges so field crews can swap cells without proprietary tools, reducing truck-roll costs. Research in 2024 confirmed alkaline’s higher energy density under low loads versus zinc-carbon, though pulse-current limitations remain a boundary in wireless telemetry. Energy-harvesting modules could trim replacement rates later in the decade, yet municipal tenders still default to primary alkaline today, bolstering long-term volume visibility.
Expansion of Organized Retail in Emerging Economies
Hypermarkets, pharmacy chains, and convenience superstores commanded 14% of India’s retail sales in 2024, a near-doubling from ten years earlier. Modern shelves favor branded multipacks, shrinking counterfeit incidence and raising average selling prices. Similar dynamics play out in Brazil, Mexico, and the UAE, where structured planograms place alkaline SKUs adjacent to flashlights and toys, driving impulse purchases. Manufacturers finance eye-level displays and bundle offerings that nudge consumers from single-cell buys toward family packs, improving per-trip profitability. Organized retail also shortens cash cycles, allowing distributors to reinvest in cold-chain logistics that protect battery integrity in hot climates. These levers collectively lift revenue despite modest unit growth, sustaining margins for global and regional brands alike.
Growing Off-Grid Emergency-Preparedness Spend
Hurricanes in 2024 and 2025 elevated public awareness of the Federal Emergency Management Agency’s 72-hour battery guideline for household survival kits, prompting surges in D and C cell sales before storm seasons. Middle Eastern governments stockpile wide-temperature-range primary cells for shelters, a multiyear procurement pipeline favoring alkaline’s indefinite shelf-life. African NGOs continue distributing alkaline-powered torches where solar lantern penetration is uneven, underscoring the chemistry’s resilience in low-infrastructure contexts. Premium brands promote corrosion-resistant steel cans to military buyers who demand performance from –20 °C to +55 °C. These dispersed yet recurring purchases cushion the alkaline battery market against cyclical softness in consumer electronics.
Restraints Impact Analysis of Alkaline Battery Market*
| Restraint | (~) % Impact on CAGR Forecast | Geographic Relevance | Impact Timeline |
|---|---|---|---|
| Performance gap versus lithium-ion rechargeables | –1.8% | Global, most acute in North America and Europe premium segments | Medium term (2-4 years) |
| Rising e-commerce counterfeit battery incidents | –0.9% | Global, concentrated in Asia-Pacific and Latin America | Short term (≤ 2 years) |
| Municipal landfill restrictions on single-use cells | –0.6% | Europe, North America, select Asia-Pacific cities | Long term (≥ 4 years) |
| Supply volatility of zinc and manganese ores | –0.7% | Global, supply concentrated in China, Australia, South Africa | Medium term (2-4 years) |
| Source: Mordor Intelligence | |||
Performance Gap Versus Lithium-Ion Rechargeables
Lithium-ion delivers 3-5× the energy density of primary alkaline in high-drain devices, pushing alkaline out of flagship cameras and game controllers. Rechargeable alkaline offers only 25–50 cycles, limiting adoption despite a safer aqueous electrolyte. R&D into zinc-manganese dioxide rechargeables made lab progress in 2024, yet dendrite formation still curtails mass-market readiness. Brands respond with “ultimate” alkaline lines that squeeze incremental runtime gains, but physics favors lithium-ion for pulse-current profiles. As premium gadgets march toward USB-C standardization, alkaline cells must pivot to low-drain niches to remain relevant.
Rising E-Commerce Counterfeit Battery Incidents
A 2024 study found counterfeit Duracell and Energizer cells masquerading online, some filled with cheaper zinc-carbon paste that leaks prematurely. Brands now embed QR codes and holograms, while Amazon’s Transparency program verifies unit-level authenticity. Enforcement obstacles persist where intellectual-property laws are weak, lowering consumer trust and pressuring margins as shoppers shift to discount packs or rechargeables. The alkaline battery industry has responded with traceable blockchain pilots, but global harmonization remains elusive.
*Our forecasts treat driver/restraint impacts as directional, not additive. The impact forecasts reflect baseline growth, mix effects, and variable interactions.
Alkaline Battery Market Segment Analysis
By Battery Type:
Primary Cells Anchor Revenue, Rechargeables Target Niche CyclesPrimary alkaline cells retained 74.5% revenue share in 2025, underlining their dominance in the alkaline battery market. Their zero-maintenance nature aligns with emergency kits, smoke detectors, and IoT sensors. Military buyers specify a 10-year shelf-life that rechargeable formats cannot match. The alkaline battery market size for primary cells is poised to reach USD 10.1 billion by 2031, maintaining healthy cash generation for incumbents.
Secondary alkaline variants, while only a sliver today, are set to grow at an 8.9% CAGR to 2031 as environmentally minded households seek midway solutions between disposables and lithium-ion. Manufacturers emphasize safe aqueous electrolytes and familiar form factors to overcome consumer skepticism. Early adopters are schools and offices that cycle through moderate-drain devices like laser pointers. However, until cycle life approaches 100 charges, secondary formats will complement rather than cannibalize primary sales, supporting balanced growth inside the alkaline battery market.


By Size:
AA Dominance Meets 9-Volt Renaissance in Safety and Medical SegmentsAA cells captured 43.9% of the alkaline battery market share in 2025 due to ubiquity across remote controls, toys, and IoT nodes.[3] Manufacturers refine seal technologies to promise a 10-year shelf-life, an important specification for smart-home gateways installed inside walls. The alkaline battery market size for AA cells is forecast to top USD 4.5 billion by 2031, supported by standardized designs that simplify procurement at scale.
9-volt units are on track for a 9.2% CAGR through 2031 as smoke-detector replacement mandates proliferate and portable medical devices standardize around this compact, high-voltage format.[4] Guitar pedals and professional audio gear also keep 9-volt demand resilient. Meanwhile, C and D formats decline in household use but stay relevant in industrial flashlights. Coin and specialty cells hold a premium niche governed by tight IEC dimensional tolerances, allowing producers to command outsized margins per gram of active material.
By Application:
Consumer Electronics Lead, Medical Devices Accelerate on Regulatory TailwindsConsumer electronics generated 45.6% of 2025 revenue, cementing the sector’s lead within the alkaline battery market. Remote controls, wall clocks, and budget toys still default to alkaline owing to low unit pricing and universal availability. Brands support the segment with bulk pack promotions in organized retail, offsetting unit erosion as premium gadgets turn rechargeable.
Medical devices are the breakout category, projected to log a 9.5% CAGR between 2026 and 2031 as home-based diagnostics scale in aging societies. FDA 510(k) clearances for portable ECG and glucose meters specify leak-proof, mercury-free chemistries, a direct boost to the alkaline battery market. Hospitals favor 9-volt and AA layouts for ease of inventory, and telemedicine kits shipped to patients often pre-install branded alkaline cells to assure compliance. This regulatory-driven pull positions healthcare as a stable growth driver for the next decade.

Geography Analysis
APAC Alkaline Battery Market
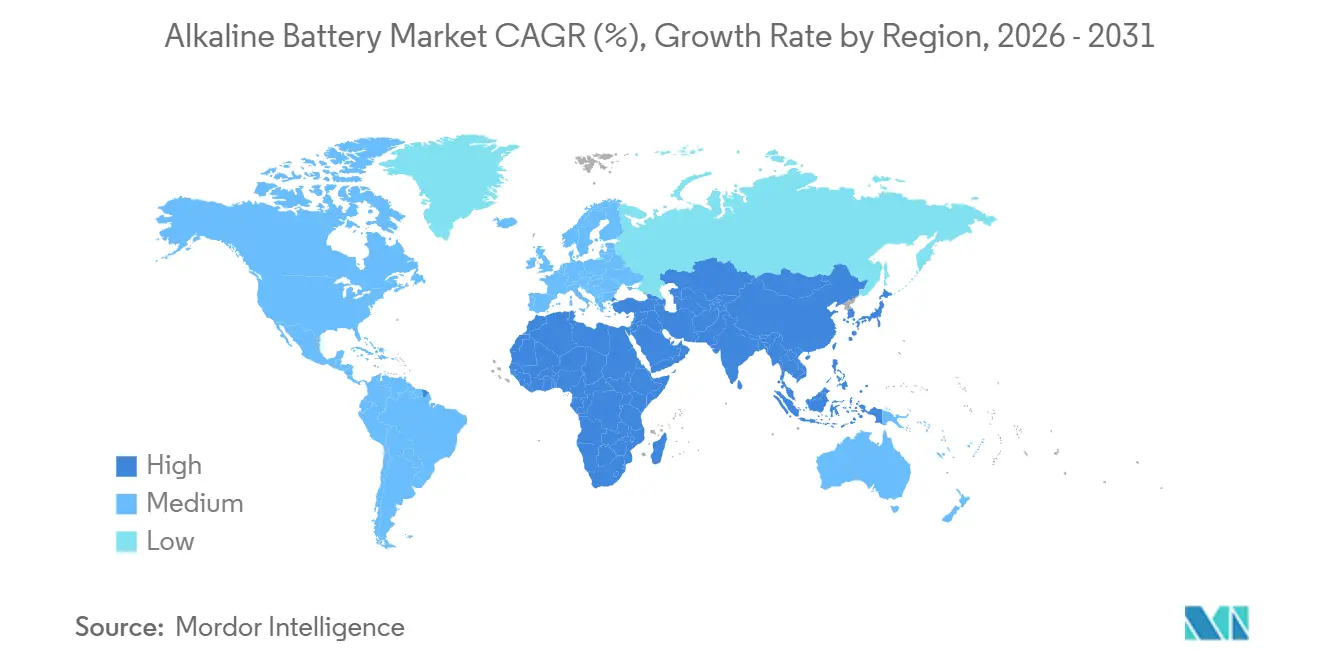
Asia-Pacific dominated with 38.3% share in 2025 and should post 6.4% annual growth to 2031, fueled by China’s manufacturing heft and India’s retail modernization. China supplies roughly 70% of global alkaline output, underpinned by integrated zinc and manganese supply chains. Indian consumers increasingly buy branded multipacks in hypermarkets, widening addressable demand. ASEAN smart-city deployments add steady volumes for low-drain AA sensors, and governments encourage standard form factors to facilitate maintenance.
North America and Europe Alkaline Battery Market
North America and Europe are mature but profitable arenas. Brands command premium prices via anti-counterfeit packaging and long-life claims. EU regulations enforce a 65% collection rate by 2025, compelling producers to invest in recycling yet opening grocery channels once barred by hazardous labeling. U.S. military procurement for wide-temperature D and C cells stabilizes industrial demand despite consumer shifts to rechargeable alternatives.
South America and MEA Alkaline Battery Market
South America and the Middle East-Africa corridor expand from smaller bases. Brazil and Mexico gain shelf space in modern retail, yet rural cash-and-carry dominance limits penetration. The UAE and Saudi Arabia incorporate alkaline batteries into civil-defense kits, while African NGOs distribute torches powered by primary cells where solar-charger reach is sporadic. Supply-chain friction, port congestion, and currency swings add cost, but rising urbanization provides a long-run tailwind for the alkaline battery market.
Regulatory Landscape
In the European Union, Regulation (EU) 2023/1542 continues to tighten requirements around battery sustainability, labeling/marking, and end-of-life management, with implementing and delegated acts adding operational detail. Commission Implementing Regulation (EU) 2025/2289 (November 2025) set reporting formats and assessment methods for waste-battery treatment data, while Regulation (EU) 2025/1561 (July 2025) amended timelines by postponing certain due diligence obligations to August 2027 and shifting select economic-operator deadlines to 26 July 2026. A corrigendum published in April 2026 further clarified Annex XIII marking requirements, affecting how consumer primary batteries are labeled for compliance in EU retail channels.
Waste classification and collection rules also shape alkaline battery handling and producer programs. Commission Delegated Decision (EU) 2025/934 updates the EU list of waste for batteries and becomes effective on 9 November 2026, including explicit waste codes used for alkaline-based batteries, which feeds into downstream logistics, documentation, and treatment pathways. In the United States, the Environmental Protection Agency is building a national policy foundation through guidance and reporting, including its Battery Collection Best Practices Report to Congress (May 2026), alongside work on a voluntary battery EPR framework and voluntary labeling guidelines. Together, these steps reinforce producer accountability and clearer consumer-facing markings across chemistries.
Competitive Landscape
Duracell, Energizer, and Panasonic retain leadership, but regional challengers such as Nanfu, GP Batteries, and VARTA seize share with cost advantages and localized distribution. Energizer’s USD 2 billion buyout of Spectrum Brands’ battery unit consolidated Rayovac and VARTA consumer labels, though EU regulators mandated specific divestitures to keep national competition healthy. VARTA completed a recapitalization in April 2025, erasing EUR 285 million in debt and securing fresh equity from Porsche and investor Michael Tojner, strengthening its push into premium alkaline and energy-storage systems.
Strategically, incumbents invest in leak-proof gaskets and QR-code authentication to defend margins against e-commerce counterfeits. R&D also explores zinc-based rechargeable chemistries, though commercialization remains years away. Direct-to-consumer subscription pilots aim to bypass counterfeit-prone third-party sellers, while organized retail tie-ups in emerging markets broaden legitimate channels.
White-space opportunities include bundled power solutions for IoT deployments and circular-economy take-back programs that monetize recycled zinc and manganese. Patent filings cluster around electrolyte additives for extreme temperatures and gas-vent seal designs, signaling incremental rather than disruptive innovation. Market discipline persists: price wars flare regionally, but global leaders avoid races to the bottom that could erode brand equity in the alkaline battery market.
Alkaline Battery Industry Leaders
-
Duracell Inc
-
Energizer Holdings Inc
-
Panasonic Corporation
-
Nanfu Battery Co Ltd
-
GP Batteries International Ltd
- *Disclaimer: Major Players sorted in no particular order
Alkaline Battery Market Companies Covered in this Report
- Duracell Inc
- Energizer Holdings Inc
- Panasonic Corporation
- GP Batteries International Ltd
- Nanfu Battery Co Ltd
- VARTA AG
- Koninklijke Philips NV
- Fujitsu Ltd
- Maxell Holdings Ltd
- Sony Group (Murata Manufacturing battery business)
- Spectrum Brands (Rayovac)
- Toshiba Corporation
- Camelion Battery Co
- Shenzhen PKCELL Battery Co Ltd
- Eveready Industries India Ltd
- Zhejiang Must Power Co Ltd
- Sunbeam Products Inc
- Amperex Technology Ltd (ATL) – Primary division
- Union Battery Corporation
- Euroforce Battery Co
Market Opportunities and Future Outlook
Collection, take-back, and traceability programs are a practical whitespace for alkaline brands and distributors as EPR-style requirements expand and retailers raise shelf-placement thresholds for battery products. The EU battery framework (Regulation (EU) 2023/1542) and its 2025 implementing methodology for calculating and verifying recycling efficiency and material recovery for waste batteries (entering into force on 24 July 2025) push producers toward more structured reporting, standardized data formats, and audited treatment outcomes. This, in turn, supports demand for compliant logistics partners, labeled packaging workflows, and consolidated multi-brand collection schemes.
Localized manufacturing and import-substitution initiatives also offer a pathway for both incumbents and regional challengers, particularly in fast-growing emerging retail markets. In April 2026, Eveready Industries commissioned India's first domestic alkaline battery manufacturing facility in Jammu, backed by an investment of INR 200 crore and designed for peak annual production capacity of 360 million units. The facility expands domestic supply options for AA/AAA formats and creates a more direct basis for private-label and contract manufacturing discussions. Parallel compliance moves around EPR collection targets in India (2025-2026) are steering manufacturers toward shared collection mechanisms and partnerships, which can help formal-channel penetration and give premium branded multipacks an advantage over counterfeit and informal supply.
Recent Industry Developments in Alkaline Battery Market
- June 2026: Duracell rolled out limited-edition Lionel Messi battery packs at major North American retailers including Walmart, Amazon, and Lowes. The retail-focused launch supports premium brand visibility and helps sustain price positioning in the primary consumer battery aisle as private labels and counterfeits pressure mix.
- March 2025: Energizer closed its acquisition of Advanced Power Solutions NV, adding additional AA and AAA production and portfolio depth in Europe. The integration expands Energizer's ability to supply core alkaline form factors through expanded manufacturing and distribution footprint.
- December 2024: Changhong New Energy Technology announced plans to start construction of an alkaline battery plant in Chonburi province, Thailand, with an initial phase comprising five production lines and over 700 million cells of annual capacity. The project signals incremental regional capacity in Southeast Asia and can shorten lead times for organized retail and OEM demand in nearby APAC markets.
Alkaline Battery Market Report Scope and Research Methodology
Market Definition and Coverage
This market includes revenue generated from alkaline batteries sold for end use across consumer, commercial, and institutional needs, where the chemistry is based on an alkaline electrolyte and common zinc and manganese dioxide materials.
Scope exclusions: We exclude most rechargeable lithium-ion and nickel-based rechargeable batteries, and we also exclude upstream raw materials that are not sold as finished alkaline batteries.
Segments Covered in This Report
- By Battery Type
- Primary
- Secondary (Rechargeable Alkaline)
- By Size
- AA (LR6)
- AAA (LR03)
- 9-Volt
- C
- D
- Coin and Specialty
- By Application
- Consumer Electronics
- Industrial and Commercial Devices
- Medical Devices
- Toys and Entertainment
- Lighting and Flashlights
- By Geography
- North America
- United States
- Canada
- Mexico
- Europe
- Germany
- United Kingdom
- France
- Italy
- NORDIC Countries
- Russia
- Rest of Europe
- Asia-Pacific
- China
- India
- Japan
- South Korea
- ASEAN Countries
- Australia and New Zealand
- Rest of Asia-Pacific
- South America
- Brazil
- Argentina
- Colombia
- Rest of South America
- Middle East and Africa
- Saudi Arabia
- United Arab Emirates
- South Africa
- Egypt
- Rest of Middle East and Africa
- North America
Data Sources, Market Sizing, and Validation
Desk Research
We started with desk research to frame demand drivers and to set realistic boundaries for what should count as alkaline battery revenue. Public sources were used to understand device usage trends and trade flows for batteries, and then those inputs were translated into demand signals by region.
Typical references included sources such as UN Comtrade for import and export patterns, USITC data for tariff and trade classifications, Eurostat for EU trade statistics, and International Energy Agency materials for portable energy and device context. We also reviewed standards and safety references such as IEC publications for product terminology, along with company filings and investor presentations to understand product mix, channel focus, and pricing commentary. Where needed, we supplemented public information using paid subscriptions for company financials and intelligence, news and financials, and shipment-level import and export checks. The desk sources listed here are not exhaustive, and additional public and commercial references were used for data collection, validation, and clarification.
Primary Interviews and Surveys
Primary work was used to pressure test the desk assumptions on pricing, mix, and substitution with other chemistries in key applications such as toys, flashlights, small medical devices, and basic consumer electronics. We spoke with a spread of stakeholders across manufacturing, distribution, and large buyers so regional demand patterns and channel markups could be quantified and corrected when desk signals were incomplete.
Distribution of primary research fieldwork respondents
| Company type | Respondent position | Region |
|---|---|---|
| Top tier: 37% | CXOs: 18% | APAC: 51% |
| Mid tier: 44% | Functional/Unit leaders: 29% | EMEA: 29% |
| Smaller Players: 19% | Managers: 53% | Americas: 20% |
Market-Sizing & Forecasting
The core model is built using a top-down approach where device and usage demand pools are reconstructed by region, followed by applying penetration and replacement rates for alkaline batteries in common use cases. To keep the totals grounded, we checked results through selective bottom-up approximations, including supplier revenue roll-ups for alkaline-heavy portfolios, channel checks on retail and institutional volumes, and sampled average selling price (ASP) multiplied by observed volume ranges.
Key inputs used in the model included alkaline battery size mix (AA, AAA, 9-Volt, C, D, and specialty), the split between primary alkaline and rechargeable alkaline where relevant, regional retail versus institutional share, observed ASP bands by pack format, and substitution pressure from rechargeable options in high-drain devices. Where country-level information was thin, we filled gaps using proxy indicators like trade intensity, device ownership patterns, and interview-based channel splits, and then normalized outputs so regional totals stayed consistent.
For forecasting, we used scenario analysis supported by variable-level expert views, since demand can shift quickly with pricing, consumer behavior, and rechargeability adoption. Assumptions were refreshed year by year for mix and pricing, and then the outlook was extended using conservative, base-case, and faster-substitution paths. These were reconciled back to practical adoption signals shared by interviewees.
Data Validation & Update Cycle
Validation was done in layers so the final totals are traceable and explainable. Model outputs were compared against independent signals such as trade patterns, public company commentary on category performance, and regional channel feedback, and then large variances were investigated before numbers were finalized.
We also ran anomaly checks on implied ASP movements, size-mix shares, and growth rates so unusual jumps could be explained by a real driver rather than a modeling artifact. When gaps were found, follow-up outreach was triggered with relevant participants to confirm whether the issue was scope, pricing, or an application shift. Reports are refreshed annually, with interim updates when material events occur, and a final pre-delivery pass is completed so clients receive the most current view.
Mordor Intelligence's Alkaline Battery Market Size Compared Against Other Published Estimates
Published market sizes for alkaline batteries can differ even when they look similar on the surface, because the boundaries around what is counted are not always consistent. Differences usually come from how primary versus rechargeable alkaline is treated, how pack pricing is converted into revenue, and how regional totals are built when public data is incomplete.
By tracking pack-format ASP bands and replacement-rate assumptions and refreshing them through interview checks, Mordor Intelligence keeps the total tied to finished alkaline battery revenue, rather than mixing in adjacent primary battery chemistries or upstream materials that inflate totals. Another common gap is the time and currency basis used for conversion, since some estimates apply a single exchange-rate snapshot or an aggressive price trend without validating if retail promotions and bulk channel pricing move differently.
Benchmark comparison
| Source | Market Size | Gaps in Research Methodology |
|---|---|---|
| Mordor Intelligence | USD 9.84 B (2025) | |
| Global Consultancy A | USD 10.90 B (2025) | This estimate appears to roll up a wider primary-battery bucket and then allocate to alkaline using broad shares, which can unintentionally include zinc-carbon or other non-alkaline chemistries. |
| Trade Journal B | USD 8.70 B (2025) | This estimate likely emphasizes tracked retail sales and standard pack pricing, which can undercount institutional and industrial channels and miss specialty sizes sold outside mass retail. |
The spread in values is mostly explained by scope boundaries and how revenue is reconstructed from volume and pricing. When the model is anchored on clear alkaline-only inclusion rules, realistic ASP bands by pack format, and region-level channel validation, the market size becomes easier to replicate and to use in planning.
Key Questions Answered in the Report
How large is the alkaline battery market in value terms today?
The alkaline battery market size stood at USD 10.46 billion in 2026.
Which battery format dominates global alkaline sales?
AA cells led with 43.9% share in 2025 thanks to widespread use in remote controls, IoT sensors, and toys.
Why are 9-volt alkaline batteries growing faster than other sizes?
Smoke-detector replacement rules and portable medical certifications drive a forecast 9.2% CAGR for 9-volt units through 2031.
What is the key growth application outside consumer electronics?
Portable medical devices, supported by FDA and CE approvals, are expected to expand at a 9.5% CAGR to 2031.
Which region contributes the most revenue to alkaline batteries?
Asia-Pacific generated 38.3% of 2025 revenue and should sustain 6.4% annual growth through 2031.
How are manufacturers tackling counterfeit alkaline batteries online?
Brands deploy QR-code authentication, holographic seals, and Amazon Transparency tracking to verify genuine units.