
Aircraft Synthetic Vision Systems Market Size and Share
Market Overview
| Study Period | 2020 - 2031 |
|---|---|
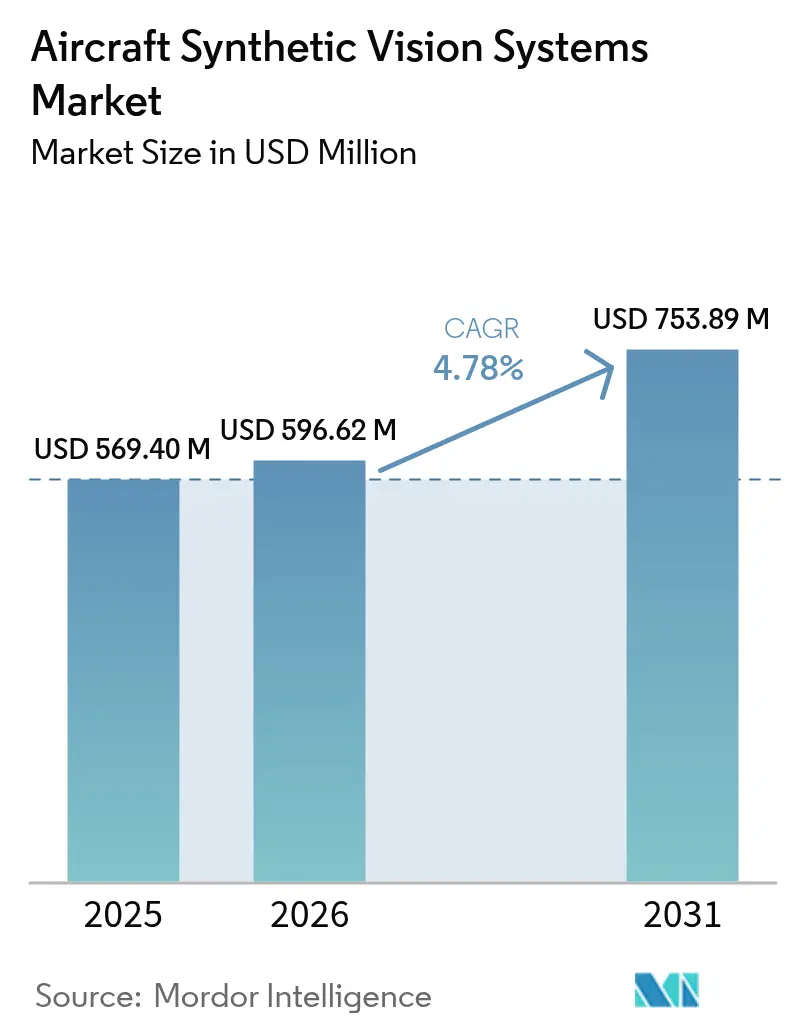
| Market Size (2026) | USD 596.62 Million |
| Market Size (2031) | USD 753.89 Million |
| Growth Rate (2026 - 2031) | 4.78 % |
| Fastest Growing Market | Asia Pacific |
| Largest Market | North America |
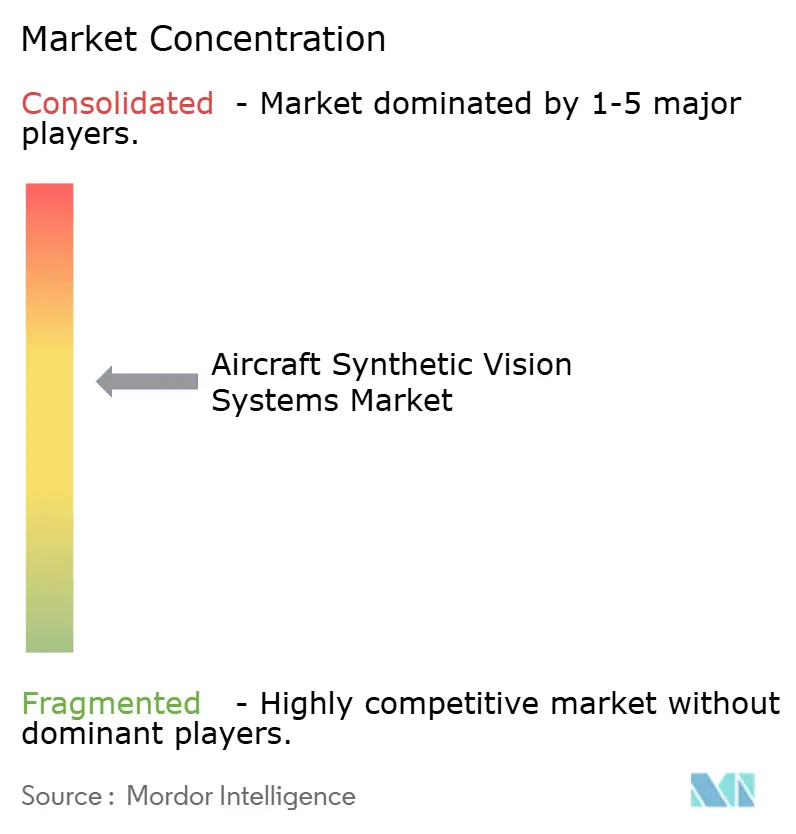
| Market Concentration | Medium |
Major Players *Disclaimer: Major Players sorted in no particular order Image © Mordor Intelligence. Reuse requires attribution under CC BY 4.0. | |
Aircraft Synthetic Vision Systems Market Analysis by Mordor Intelligence
The aircraft synthetic vision systems market size is expected to grow from USD 569.40 million in 2025 to USD 596.62 million in 2026 and is forecast to reach USD 753.89 million by 2031 at 4.78% CAGR over 2026-2031. Adoption is accelerating as US and European regulators mandate cockpit upgrades that deliver higher situational awareness during low-visibility operations. Airline and business-jet operators view synthetic vision as the most cost-effective path to compliance because the software can be embedded in existing flight-deck architectures, minimising downtime. Concurrently, air-framer partnerships focused on AI-driven terrain-rendering engines are lowering pilot workload while opening ancillary revenue streams for data-subscription services. Growth prospects are also buoyed by advanced air-mobility programs and sixth-generation fighter projects that treat synthetic vision as a core safety layer. These factors underpin a solid outlook for the Aircraft Synthetic Vision Systems market across OEM line-fit and retrofit channels.
Key Report Takeaways
- By type, primary flight displays held 45.02% of the aircraft synthetic vision systems market share in 2025, while heads-up and helmet-mounted displays are projected to grow at 10.82% CAGR from 2026 to 2031.
- By component, display systems commanded 39.68% revenue share in 2025; software/terrain-obstacle databases are forecasted to expand at a 9.09% CAGR through 2031.
- By platform, fixed-wing aircraft accounted for 52.74% of the aircraft synthetic vision systems market size in 2025, whereas advanced air-mobility/eVTOL platforms are poised to rise at 9.78% CAGR.
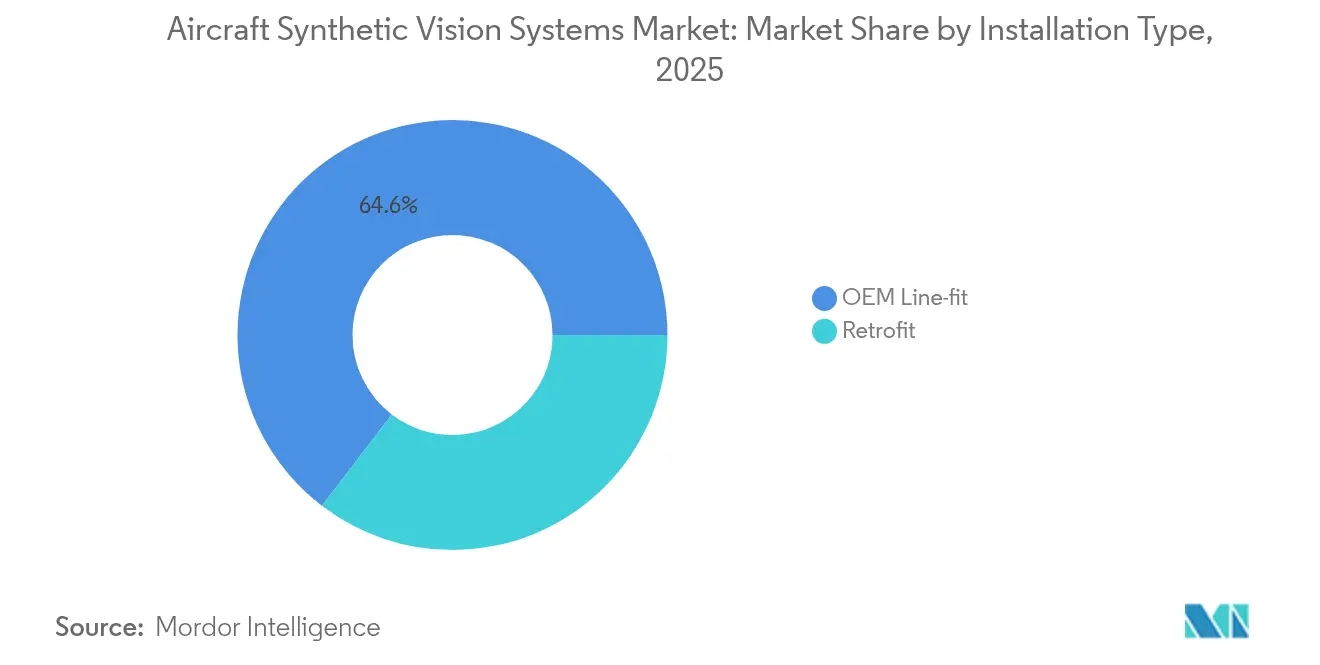
- By installation type, OEM line-fit solutions led with a 64.61% share of the aircraft synthetic vision systems market size in 2025; retrofit programs will advance at a 7.27% CAGR.
- By end user, military applications retained a 35.21% share in 2025, but general aviation is the fastest-growing segment, with a 6.89% CAGR.
- By geography, North America dominated with a 34.92% revenue share in 2025; Asia-Pacific is the fastest-growing region, with an 8.33% CAGR.
Note: Market size and forecast figures in this report are generated using Mordor Intelligence’s proprietary estimation framework, updated with the latest available data and insights as of 2026.
Market Trends and Insights
Drivers Impact Analysis of Aircraft Synthetic Vision Systems Market*
| Driver | (~) % Impact on CAGR Forecast | Geographic Relevance | Impact Timeline |
|---|---|---|---|
| Rising business-jet deliveries with factory-fitted combined vision suites | +0.8% | North America and Europe; spill-over to APAC | Medium term (2-4 years) |
| Rapid adoption of SVS-enabled HUDs in Gen-6 fighter cockpits | +0.6% | North America and Europe | Long term (≥ 4 years) |
| Demand for low-visibility approach credits at Tier-2 airports | +0.5% | Global; early gains in APAC secondary cities | Medium term (2-4 years) |
| Urban-air-mobility eVTOL programs requiring high-integrity SVS | +0.7% | Global; concentrated in North America and Europe | Long term (≥ 4 years) |
| OEM partnerships around AI-based terrain-rendering engines | +0.4% | Global | Short term (≤ 2 years) |
| Mandated retrofit of SVS under FAA NextGen and EASA SESAR timelines | +0.9% | North America and Europe | Short term (≤ 2 years) |
| Source: Mordor Intelligence | |||
Rising Business-Jet Deliveries with Factory-Fitted Combined Vision Suites
Deliveries of new business jets now routinely include combined vision suites that merge synthetic and enhanced vision on a single display. Bombardier’s Global 8000 and Cessna’s Citation Ascend integrate these features as baseline equipment, eliminating costly aftermarket installations.[1]Bombardier, “Global 8000 Programme Details,” bombardier.com Operators benefit from lower pilot workload, while manufacturers capture recurring upgrade revenue on legacy fleets scheduled for retrofits in 2025-2026.
Rapid Adoption of SVS-Enabled Huds in Gen-6 Fighter Cockpits (US And EU)
Sixth-generation fighter programs like the NGAD F-47 rely on helmet-mounted displays that fuse tactical data with real-time terrain imagery. Collins Aerospace’s Gen III helmet for the F-35 already demonstrates how synthetic vision replaces night-vision gear, paving the way for wider military adoption.[2]Collins Aerospace, “Gen III Helmet Mounted Display,” collinsaerospace.com Subsequently, civil platforms inherit these hardened technologies, shortening certification cycles.
Demand for Low-Visibility Approach Credits at Tier-2 Airports
Regulators now allow synthetic-vision-equipped aircraft to use lower minima without adding instrument-landing systems. The FAA’s Enhanced Low Visibility Operations rules and EASA’s All Weather Operations guidance let smaller airports boost capacity without infrastructure outlays.[3]Federal Aviation Administration, “Enhanced Flight Vision System Regulations,” faa.gov Airlines gain schedule resilience, and equipment makers tap a fresh retrofit market.
Urban-Air-Mobility eVTOL Programs Requiring High-Integrity SVS
eVTOL developers need synthetic vision to navigate congested low-altitude corridors with minimal pilot input. Honeywell’s Anthem flight deck targets failure rates 10^-9 for partners such as Vertical Aerospace, Archer, and Lilium. Certification special conditions issued by EASA explicitly reference synthetic vision as a primary navigation aid for urban operations.
Restraints Impact Analysis of Aircraft Synthetic Vision Systems Market*
| Restraint | (~) % Impact on CAGR Forecast | Geographic Relevance | Impact Timeline |
|---|---|---|---|
| Certification bottlenecks for database-centric vision algorithms | -0.7% | Global; stringent in North America and Europe | Medium term (2-4 years) |
| Cost sensitivity in turboprop and light-helicopter retrofits | -0.5% | Global; focused in emerging markets | Short term (≤ 2 years) |
| Limited GPU thermal budgets in cockpit-mounted hardware | -0.3% | Global | Medium term (2-4 years) |
| Cyber-hardening gaps in connected avionics buses | -0.4% | Global; heightened in defence | Long term (≥ 4 years) |
| Source: Mordor Intelligence | |||
Certification Bottlenecks for Database-Centric Vision Algorithms
Machine-learning terrain databases do not fit neatly into deterministic DO-178C frameworks, prolonging approvals and raising development costs. In some cases, OEMs and avionics vendors limit the complexity of SVS features to reduce certification risk. Thus, features like dynamic terrain rendering, urban 3D modeling, or integration with EO/IR feeds are delayed. For instance, Mercury Systems’ image-integrity tools provide partial relief but still require Design Assurance Level C validation, a hurdle for smaller suppliers. Certification costs are passed on to operators in most cases, making SVS upgrades more expensive. This limits their commercial viability in the markets for small turboprop aircraft and helicopters.
Cost Sensitivity in Turboprop and Light-Helicopter Retrofits
Upgrade costs often exceed residual aircraft values in price-sensitive markets. For instance, full integration may exceed USD 60,000 to USD 100,000 for light helicopters with analog cockpits, making SVS retrofits highly cost-sensitive. Aircraft already undergoing panel modernization are the most likely to adopt SVS as part of a bundled upgrade strategy. Universal Avionics and Genesys have introduced lower-cost bundles, yet adoption lags in the business jet and airline segments.
*Our forecasts treat driver/restraint impacts as directional, not additive. The impact forecasts reflect baseline growth, mix effects, and variable interactions.
Aircraft Synthetic Vision Systems Market Segment Analysis
By Type:
Primary Flight Displays Dominate IntegrationPrimary flight displays held 45.02% of the aircraft synthetic vision systems market share in 2025 because pilots rely on these central screens for all critical flight cues. Heads-up and helmet-mounted displays exhibit the fastest growth at 10.82% CAGR, largely due to defence orders and the trickle-down of military technology into civil variants. Garmin’s SVT upgrade path shows operators adding 3-D terrain onto existing PFDs without re-wiring the cockpit. The aircraft synthetic vision systems market size for helmet-mounted solutions is projected to increase by 2031 as advanced air-mobility platforms favour wearable displays for weight savings.
The segment’s momentum extends to integrated combined-vision products that overlay infrared imagery onto synthetic terrain, delivering all-weather capability without added monitors. Universal Avionics’ ClearVision set a precedent for wearable HUD adoption in commercial jets, while Collins Aerospace adapts fighter-grade helmets for civil rotorcraft. These developments reinforce the aircraft synthetic vision systems market as a technology continuum rather than a discrete product, enabling cross-platform learning and volume efficiencies.




By Component:
Display Systems Lead, Software AcceleratesDisplay hardware captured 39.68% revenue in 2025 because every installation still needs certified screens. Yet software and terrain-obstacle databases are growing at 9.09% CAGR, reflecting a pivot toward AI-rich content that refreshes during flight. This shift explains why the aircraft synthetic vision systems market size linked to software is forecast to overtake hardware-only packages in the late 2020s.
Suppliers increasingly licence rendering engines separate from displays, allowing operators to swap in lower-cost commercial-off-the-shelf monitors. Honeywell’s MEMS-based KSG7200 reference system highlights a broader trend toward sensor-fusion modules that package processing power within existing LRUs. Database subscriptions create recurring cash flows and cement customer relationships, underscoring software’s strategic value in the aircraft synthetic vision systems industry.
By Platform:
Fixed-Wing Dominance, eVTOL AccelerationFixed-wing aircraft maintained 52.74% market dominance in 2025 because commercial airlines and business jet fleets already possess certified installation paths. Advanced air mobility and eVTOL platforms, however, are on track for a 9.78% CAGR, signalling a rapid broadening of the addressable aircraft synthetic vision systems market.
Urban air-taxi developers design synthetic vision from day one, bypassing legacy retrofit hurdles. Rotorcraft adoption remains driven by mission-critical operations in emergency medical and offshore transport. Unmanned aircraft increasingly depend on synthetic perception for beyond-visual-line-of-sight approvals, again enlarging the future aircraft synthetic vision systems market.
By Installation Type:
OEM Integration PreferredOEM line-fit solutions claimed 64.61% revenue share in 2025 because integrating synthetic vision during production avoids expensive downtime later. Retrofits grow at 7.27% CAGR as regulators compel legacy fleets to comply with NextGen and SESAR standards. Collins Aerospace’s King Air modernisation bundle demonstrates how a single STC covering synthetic vision can extend asset life by a decade.
Component miniaturisation and standardised data buses will lower installation time, encouraging operators to modernise rather than retire. Therefore, the Aircraft Synthetic Vision Systems market size linked to retrofit kits is set to climb steadily, albeit from a lower base.
By End User:
Military Leadership, General Aviation GrowthMilitary customers accounted for 35.21% of revenue in 2025, reflecting defence priorities around contested airspace where visibility aids support survivability. General aviation leads growth at 6.89% CAGR as affordable retrofit packages enter the piston-twin and turboprop segments. As price points fall, the synthetic-vision benefit of shorter decision times and fewer weather diversions resonates with charter operators and flight schools.
Commercial airlines balance synthetic-vision deployments against other cockpit-upgrade initiatives, yet rising Tier-2 airport operations tilt the economics to favor adoption. Accordingly, the aircraft synthetic vision systems market diversifies, reducing over-reliance on military budgets.
Geography Analysis
North America Aircraft Synthetic Vision Systems Market
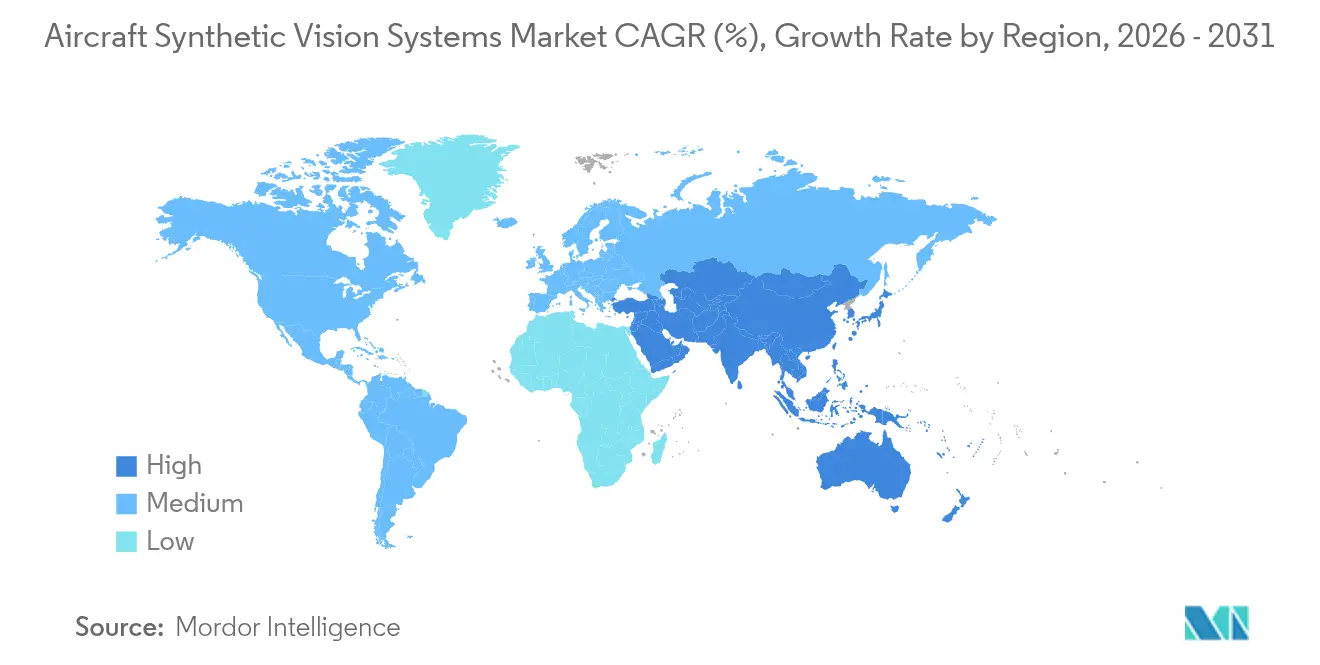
North America generated 34.92% of global sales in 2025, supported by the FAA's clear rules on Enhanced Flight Vision and robust business-jet utilisation. Operators embrace synthetic vision to secure approach credits that keep schedules intact during winter storm activity. Defence contracts such as the F-47 program deepen the regional expertise pool, allowing suppliers to amortise R&D across civil and military lines.
APAC Aircraft Synthetic Vision Systems Market
Asia-Pacific is the fastest-growing arena at 8.33% CAGR because governments in China, India, and Indonesia are upgrading secondary airports while encouraging ACMI carriers to expand fleets. The aircraft synthetic vision systems market finds fertile ground in these nations, where low-visibility procedures were once the preserve of flagship hubs. Satellite-based augmentation and new GNSS constellations further boost uptake as ground-based ILS rollouts slow.
Europe Aircraft Synthetic Vision Systems Market
Europe grows steadily on the back of SESAR directives and strong defence programs. EASA's All Weather Operations framework gives carriers economic incentives to add synthetic vision without installing CAT II/III ground systems. Sustainability goals add another driver: optimised flight paths enabled by accurate terrain models cut fuel burn and CO₂. These factors sustain a balanced expansion of the continent's aircraft synthetic vision systems market.

Regulatory Landscape
Aircraft synthetic vision systems (SVS) certification and operating credit are governed by airworthiness and all-weather operations frameworks led by the FAA and EASA. In the United States, FAA Advisory Circular AC 20-167B is a key reference for performance-based compliance for installing vision-system functions (including SVS-related architectures) under Parts 23, 25, 27, and 29, while AC 20-185A covers airworthiness approval for Synthetic Vision Guidance Systems (SVGS). Operational use cases that deliver approach and landing credit depend on the equipment approval basis and operating rules, including Enhanced Flight Vision System (EFVS) provisions under 14 CFR 91.176, which ties credit to certified design, crew procedures, and training.
In Europe, EASA has codified requirements for all-weather operations and vision systems through CS-AWO Issue 2, introduced via ED Decision 2022/007/R, covering HUD, SVGS, and combined-vision-related certification expectations. Industry standards bodies support harmonization and technical baselines, with RTCA Special Committee SC-213 maintaining system performance standardization work for SVS and vision technologies to align with regulator expectations and to address database integrity and navigation performance dependencies. Across jurisdictions, regulatory emphasis on terrain, obstacle, and aeronautical database integrity and performance-based criteria shapes product roadmaps toward provable data assurance, human factors validation, and interoperable navigation architectures aligned with performance-based navigation concepts.
Value Chain Analysis
The SVS value chain spans terrain and obstacle data providers, software and database-integrity developers, certified processing hardware and display manufacturers, avionics integrators, aircraft OEMs, and aftermarket installers that carry out line-fit and retrofit programs. Upstream inputs include navigation-grade terrain, obstacle, and aeronautical datasets, GPU or equivalent certified compute modules, and cockpit display ecosystems (PFD, HUD, helmet-mounted, and combined-vision-capable displays), which suppliers such as Honeywell, Collins Aerospace, Garmin, Thales, and specialist retrofit-focused vendors (for example, Genesys Aerosystems and Aspen Avionics) integrate into approved avionics line replaceable units and flight-deck architectures.
Certification and operational approval gate progress across the chain, affecting design partitioning, software assurance planning, and installation pathways. FAA guidance such as AC 20-185A (SVGS) and AC 20-167B (vision-system airworthiness guidance), along with EASA CS-AWO Issue 2 (ED Decision 2022/007/R), shape how integrators package SVS functions, validate databases, and document compliance for OEM and STC programs. Downstream, distribution runs through OEM procurement for factory-installed suites and through MROs, avionics dealers, and STC holders for retrofit, with recurring software and database updates increasingly tying operators to vendor ecosystems and support networks.
Competitive Landscape
Competitive intensity is moderate, with collaboration eclipsing outright consolidation. Honeywell’s USD 17 billion strategic pact with Bombardier anchors a joint roadmap for AI-ready avionics, while the NXP tie-up secures semiconductor supply for next-generation GPUs. Collins Aerospace partners with military primes to advance helmet-mounted systems, then adapts the technology for civil rotorcraft, illustrating a virtuous cycle between defence and commercial lines.
Software-centric newcomers such as Daedalean and Lynx exploit gaps in AI certification and cloud-connected data services. Their algorithms offer finer obstacle detection, challenging legacy players to accelerate their own roadmaps. Meanwhile, Universal Avionics and Astronics focus on affordability, targeting mid-life business jets with constrained capital budgets. The Aircraft Synthetic Vision Systems market, therefore, rewards firms that master both regulatory nuance and real-time graphics processing.
Looking forward, white-space remains in Tier-2 airport operations and autonomous eVTOL corridors where incumbents lack local relationships. Expect joint ventures between avionics majors and regional service providers to capture these opportunities, further blurring the line between equipment vendor and data-service supplier.
Aircraft Synthetic Vision Systems Industry Leaders
Honeywell International Inc.
Thales Group
Collins Aerospace (RTX Corporation)
L3Harris Technologies, Inc.
Garmin Ltd.
- *Disclaimer: Major Players sorted in no particular order
Aircraft Synthetic Vision Systems Market Companies Covered in this Report
- Honeywell International Inc.
- Collins Aerospace (RTX Corporation)
- Garmin Ltd.
- Thales Group
- Elbit Systems Ltd.
- L3Harris Technologies, Inc.
- Mercury Systems, Inc.
- Aspen Avionics, Inc.
- Avidyne Corporation
- ENSCO Inc.
- Astronics Corporation
- Universal Avionics Systems Corporation
- Esterline Technologies (TransDigm Group Incorporated)
- BAE Systems plc
- Genesys Aerosystems (Moog, Inc.)
- Saab AB
Read Analysis of Aircraft Synthetic Vision Systems Companies

Market Opportunities and Future Outlook
White-space shows up where regulators and operators seek more consistent low-visibility access without heavy ground infrastructure investment, which makes certified vision capabilities a lever for operational continuity at secondary airports and across mixed fleets. FAA guidance anchored around EFVS and related approval pathways, together with EASA CS-AWO Issue 2 (ED Decision 2022/007/R), provides a clearer certification scaffold for SVGS, HUD, and CVS-aligned functions. This, in turn, supports more standardized upgrade programs and reduces friction for operators that need documented operational credit rather than situational awareness alone.
OEM line-fit programs that bundle SVS with flight-deck modernization also create a near-term pathway for broader adoption and subsequent retrofit pull-through. A clear signal is the April 2026 triple certification (ANAC, FAA, EASA) for Embraer’s Praetor 600E, which includes an integrated vision configuration combining a head-up display with a synthetic vision guidance system. Operationally, database-centric procedure enablement is expanding, including Honeywell’s May 2026 announcement that its FMS Guided Visual approaches, integrated into its navigation database for about 100 airports, received endorsement from the Starr Safety Partnership. Military modernization programs that fund synthetic-vision-related technical refresh and degraded-visual-environment architectures also continue to feed transferable compute, sensor-fusion, and display integration know-how into civil and rotorcraft offerings, broadening the set of certified options across platforms and installation types.
Recent Industry Developments in Aircraft Synthetic Vision Systems Market
- May 2026: Honeywell reported that its Anthem integrated flight deck, which runs synthetic vision as a software application on shared computing hardware, is flying in certification programs including the Dassault Falcon 10X. This reinforces the shift from stand-alone SVS boxes toward software-defined vision functions embedded into next-generation avionics architectures, improving upgradeability and lifecycle support.
- December 2025: Transport Canada posted a procurement for a Collins Aerospace SVC-3000 Synthetic Vision Computer under the Air Services Directorate, structured as a time-bound contract. The purchase activity highlights continuing government and special-mission demand for certified synthetic vision compute modules, supporting sustained aftermarket volumes alongside OEM line-fit programs.
- September 2024: Aviation Today published an industry review covering the evolution of enhanced and synthetic vision, emphasizing ongoing certification and operational-credit pathways as a central adoption driver. The discussion underscores how all-weather operational use cases, not just display upgrades, are shaping procurement priorities and supplier roadmaps for combined-vision-capable cockpits.


Aircraft Synthetic Vision Systems Market Report Scope and Research Methodology
Market Definition and Coverage
This market covers aircraft synthetic vision systems used in the cockpit to create a real time 3-D digital view of terrain, obstacles, runways, and surrounding airspace. It includes SVS software, cockpit display integration, and the terrain and obstacle databases supporting low visibility operations.
Scope exclusions: Enhanced or combined vision units that mainly depend on external infrared or radar sensors without an embedded 3-D database are excluded.
Segments Covered in This Report
- By Type
- Primary Flight Display
- Navigation Display
- Heads-up and Helmet-mounted Display
- Other Types
- By Component
- Synthetic Vision Computer/Processing Unit
- Air-data and GPS Sensor Suite
- Display System
- Software/Terrain-Obstacle Databases
- Other Components
- By Platform
- Fixed-Wing Aircraft
- Rotary-Wing Aircraft
- Unmanned Aerial Vehicles (UAV)
- Advanced Air-Mobility/eVTOL
- By Installation Type
- OEM Line-fit
- Retrofit
- By End User
- Military
- Commercial
- General Aviation
- By Geography
- North America
- United States
- Canada
- Mexico
- Europe
- Germany
- United Kingdom
- France
- Russia
- Rest of Europe
- Asia-Pacific
- China
- Japan
- India
- South Korea
- Rest of Asia-Pacific
- South America
- Brazil
- Rest of South America
- Middle East and Africa
- Middle East
- United Arab Emirates
- Saudi Arabia
- Rest of Middle East
- Africa
- Egypt
- South Africa
- Rest of Africa
- Middle East
- North America
Data Sources, Market Sizing, and Validation
Desk Research
Desk work started with building the demand picture for SVS across aircraft deliveries, retrofit activity, and avionics upgrade cycles, then mapping that to typical SVS content on the flight deck. For public sources, we leaned on items such as FAA airworthiness and avionics guidance, EASA certification and safety publications, ICAO standards material, and manufacturer technical publications and manuals that explain capability differences and installation realities.
To anchor volumes and macro signals, we also reviewed aircraft fleet and delivery commentary from industry sources, selected government trade and customs releases for avionics related flows, and peer reviewed papers on synthetic vision performance in degraded visual environments. Company filings, investor presentations, and reputable aviation press were used to cross check product positioning and retrofit timing. Paid subscriptions were used in a limited way for company financial intelligence, news screening, and patent databases to spot product cycles and confirm technology direction. The sources listed here are illustrative only, and many other public and paid references were also used for data collection, validation, and clarification.
Primary Interviews and Surveys
Primary work was used to pressure test adoption rates, typical per aircraft pricing ranges, and the split between line fit and retrofit demand, because these inputs move the model more than broad industry headlines. We spoke with a mix of avionics specialists, integration and MRO stakeholders, and aircraft operators across the Americas, EMEA, and APAC, then reconciled differences until a stable set of assumptions was reached.
Distribution of primary research fieldwork respondents
| Company type | Respondent position | Region |
|---|---|---|
| Top tier: 34% | CXOs: 13% | APAC: 43% |
| Mid tier: 49% | Functional/Unit leaders: 28% | EMEA: 37% |
| Smaller Players: 17% | Managers: 59% | Americas: 20% |
Market-Sizing & Forecasting
Sizing was built using top-down and bottom-up logic, where aircraft deliveries and active fleet by platform were converted into an addressable SVS install pool through penetration rates and upgrade triggers, then translated into value using typical system pricing and database content assumptions. Because SVS is tied to cockpit configurations, the model was further filtered by fitment suitability, retrofit feasibility, and the pace at which older displays get replaced.
Key inputs used in the worksheets include aircraft production and delivery trends, the active installed fleet and utilization patterns, retrofit and avionics modernization cycles, OEM line fit share versus aftermarket share, and typical price movement for display and software packages over time. When the market signal was unclear, the estimate was cross checked using selective bottom-up approximations, such as sampled program level content per aircraft and channel checks on average selling prices, then the totals were adjusted to remove double counting between bundled cockpit upgrades and standalone SVS additions.
For forecasting, scenario analysis was applied around aircraft delivery recovery, retrofit timing, and certification driven adoption, since these drivers can move in different directions across regions. The final year-by-year path was then smoothed using exponential smoothing on the baseline demand pool, with primary feedback used to keep assumptions realistic when visibility on near-term deliveries or retrofit spend changed.
Data Validation & Update Cycle
Outputs were checked against independent signals such as aircraft deliveries, fleet size movement, and avionics upgrade activity, then compared with what interviewees described as typical installation pace and pricing. Variances were investigated by tracing them back to a small set of drivers, then corrected through another review pass before sign off.
The work is reviewed in steps so that definition, inputs, and calculations are each checked separately, and re contact is triggered when a new certification update, program delay, or major retrofit push creates a meaningful swing in assumptions. Reports are refreshed annually, and interim checks are made when material events occur. Before delivery, a final analyst pass is completed so clients receive the most current view that can be supported by the same repeatable model logic.
Mordor Intelligence's Aircraft Synthetic Vision Systems Market Sizing Compared With Other Published Estimates
Published market sizes for aircraft synthetic vision systems can look far apart, even when the topic sounds identical, because each publisher can count a different product set, apply a different year as the starting point, or use different pricing and install rate assumptions. The spread is also influenced by whether the estimate leans more on aircraft delivery math, retrofit dynamics, or broader avionics spending proxies.
Enhanced or combined vision units that mainly depend on external infrared or radar sensors without an embedded 3-D database sit outside Mordor Intelligence's scope, and that exclusion can pull totals down versus figures that blend SVS with sensor heavy vision suites. Other differences come from how line fit bundles are separated from cockpit upgrade packages, how unmanned platforms are treated in the install base, and whether price curves are held flat or stepped down as display and computing hardware mature. Some published timelines also anchor to 2024 or 2025 and then inflate forward without rechecking delivery shifts and retrofit pace.
Benchmark comparison
| Source | Market Size | Gaps in Research Methodology |
|---|---|---|
| Mordor Intelligence | USD 596.62 M (2026) | |
| Global Consultancy A | USD 496.31 M (2024) | Uses a 2024 base year and a wider display and platform taxonomy, which can change the aircraft count considered eligible and the pricing mix assumed across line fit and retrofit. |
| Industry Publisher B | USD 514.40 M (2025) | Blends SVS with adjacent vision categories in the product split and applies a longer forecast window, which can smooth out year specific effects from deliveries, upgrades, and certification related adoption. |
The table indicates that scope cutoffs, base year selection, and how installation and pricing are refreshed tend to explain most of the spread. When the demand pool is rebuilt from deliveries, active fleet upgrades, and realistic per aircraft content, the final number stays traceable to inputs that can be repeated and updated consistently.


Key Questions Answered in the Report
What is the present size of the Aircraft Synthetic Vision Systems market?
The market was valued at USD 596.62 million in 2026 and is projected to reach USD 753.89 million by 2031, reflecting a 4.78% CAGR.
Which segment holds the largest Aircraft Synthetic Vision Systems market share?
Primary flight displays led with 45.02% share in 2025, underscoring their centrality in cockpit upgrades.
Why is Asia-Pacific the fastest-growing region?
Infrastructure modernisation and fleet expansion across China, India and Southeast Asia drive an 8.33% regional CAGR, with regulatory support for low-visibility operations accelerating adoption.
How do regulations influence market growth?
FAA NextGen and EASA SESAR mandates require enhanced situational awareness, creating non-discretionary demand for synthetic-vision retrofits and OEM installations.
What technological trend is reshaping competition?
AI-based terrain-rendering engines running on certified GPUs are shifting value creation toward software and data services rather than display hardware alone.
Page last updated on:


 Your data is secure and never sold or shared.


