
Agriculture In Uganda Market Analysis by Mordor Intelligence
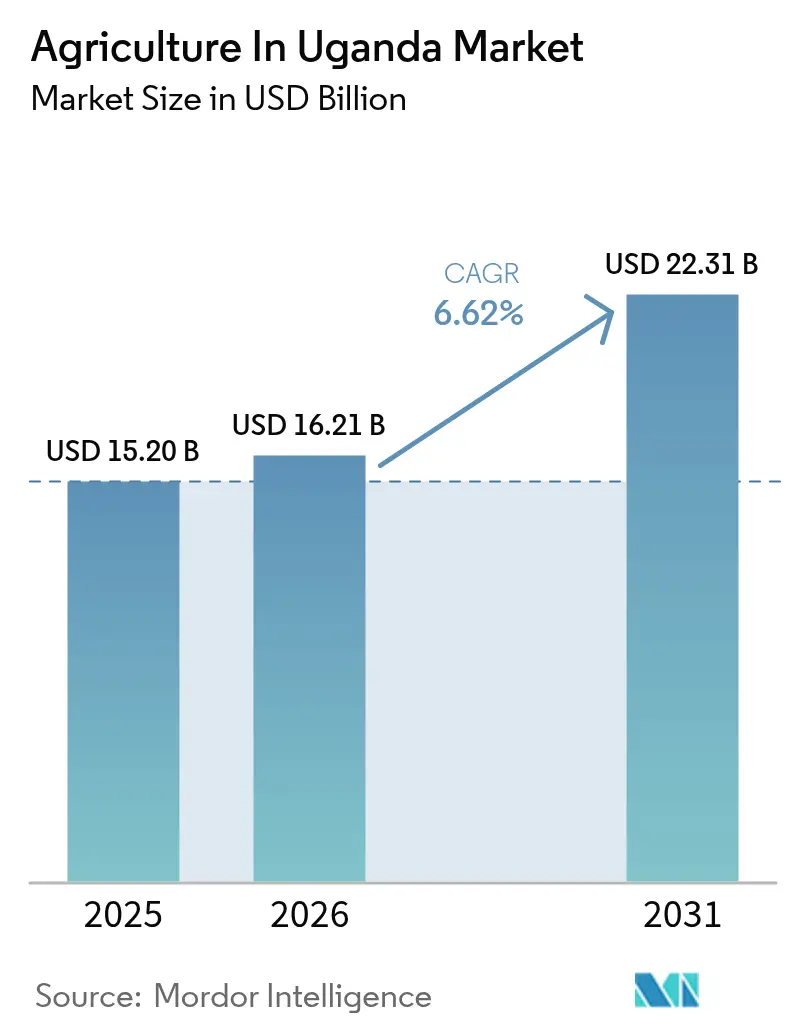
Agriculture in Uganda market size in 2026 is estimated at USD 16.21 billion, growing from 2025 value of USD 15.20 billion with 2031 projections showing USD 22.31 billion, growing at 6.62% CAGR over 2026-2031. Government funding, infrastructure upgrades, and digital agriculture programs are reshaping farming practices, expanding access to inputs, and catalyzing commercialization across all major crop groups. Public-private financing partnerships, including the one in 2022, a World Bank’s USD 96 million climate-smart agriculture project, and Stanbic Bank’s commitment of UGX 750 billion (USD 203 million), provide the capital base required to modernize production and post-harvest systems [1].Source: Ministry of Finance Planning and Economic Development, “Finance Minister Kasaija Delivers Budget Strategy for FY 2025/2026,” finance.go.ug Rising regional demand for cereals, tariff-free access for horticulture, and fast-growing livestock feed requirements reinforce positive price signals, while widespread digital adoption lowers transaction costs and improves market transparency. Together, these elements sustain a strong growth runway for the agriculture market in Uganda through 2030.
Key Report Takeaways
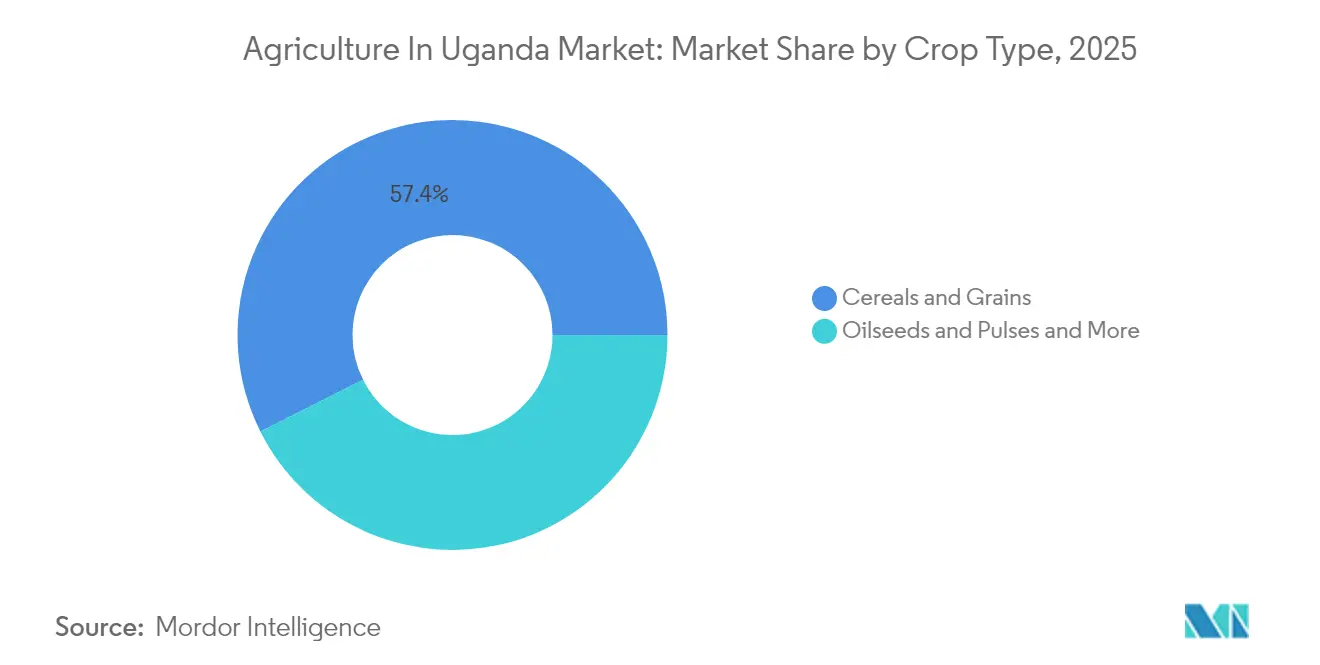
- By crop type, cereals and grains led with a 57.40% share in the Uganda market in 2025, while fruits and vegetables are forecast to expand at a robust 8.92% CAGR through 2031.
Note: Market size and forecast figures in this report are generated using Mordor Intelligence’s proprietary estimation framework, updated with the latest available data and insights as of 2026.
Agriculture In Uganda Market Trends and Insights
Drivers Impact Analysis*
| Driver | (~) % Impact on CAGR Forecast | Geographic Relevance | Impact Timeline |
|---|---|---|---|
| Government PDM funding accelerates smallholder commercialization | +1.8% | National, central and eastern regions | Medium term (2-4 years) |
| Cold-chain build-out at Entebbe and regional hubs | +1.2% | National, spillover to East Africa | Medium term (2-4 years) |
| Mobile price/logistics apps expand market access | +0.9% | National, highest adoption in central regions | Short term (≤ 2 years) |
| Anti-tick and livestock health programs spur oilseed demand | +0.7% | National, cattle corridor regions | Medium term (2-4 years) |
| Digital grain-trade platforms (EAGC GSoko) cut transaction costs | +0.6% | National, commercial farming areas | Short term (≤ 2 years) |
| Tariff-free access for Hass avocado and exotic fruits | +0.5% | National, southwestern highlands | Long term (≥ 4 years) |
| Source: Mordor Intelligence | |||
Government PDM Funding Accelerates Smallholder Commercialization
The Parish Development Model represents Uganda's most ambitious rural transformation initiative, deploying over UGX 2 trillion (USD 540 million) to shift 6.78 million livestock-keeping households from subsistence to commercial agriculture [2]Source: Uganda Bureau of Statistics, “National Livestock Census 2021,” ubos.org . This funding mechanism directly addresses the historical constraint of limited access to inputs and extension services, with 56.5% of livestock-keeping households now accessing extension services compared to previous coverage gaps. The program's impact extends beyond direct beneficiaries, as increased market participation by smallholders creates upstream demand for processing facilities and downstream supply for urban markets, fundamentally altering value chain dynamics across cereals, oilseeds, and horticultural crops.
Cold-Chain Build-Out at Entebbe and Regional Hubs
Infrastructure investments in cold storage and logistics are unlocking Uganda's export potential, particularly for high-value horticultural products that previously faced post-harvest losses exceeding 40%. The Entebbe Airport expansion, nearing completion in 2024, includes enhanced cargo handling facilities specifically designed for fresh produce exports, positioning Uganda to capture growing European and Middle Eastern demand for tropical fruits. Private sector investments complement government infrastructure, with companies like Alvan Blanch installing multiple 1,000 metric tons grain storage facilities across Busunju, Masindi, and Kampala, equipped with advanced drying and cleaning systems that maintain quality standards required for export markets.
Mobile Price/Logistics Apps Expand Market Access
In 2023, digital transformation in agriculture accelerates through targeted funding programs, with the AYuTe Africa Challenge distributing UGX 112 million (USD 30,000) in grants to Ugandan agritech startups developing mobile-based solutions for price discovery and logistics coordination [3].Source: Uganda Coffee Development Authority, “In the News,” ugandacoffee.go.ug These platforms address information asymmetries that historically disadvantaged smallholder farmers, enabling direct market access and reducing intermediary costs by an estimated 15-20%. The AIRTEA program, supported by EUR 298,000 (USD 322,000) in EU funding, demonstrates the international recognition of Uganda's digital agriculture potential, focusing on IoT and precision farming technologies that optimize resource use and improve yield predictability across diverse agro-ecological zones.
Anti-Tick and Livestock Health Programs Spur Oilseed Demand
Rising cattle, pig, and dairy herds need high-protein feed from soybean and sunflower meal, with animal health campaigns boosting productivity and increasing feed uptake, reinforcing growth in the market. Government-led animal health programs, including mass anti-tick and foot-and-mouth disease vaccination campaigns, improve livestock productivity and create sustained demand for high-protein feed supplements derived from soybean and sunflower processing. The sector's commercial orientation increases, with pig farming showing 50% commercial participation rates, while milk production surged fivefold to 3.73 billion liters annually, necessitating consistent feed supply chains that favor locally-produced oilseed cake over imported alternatives.
Restraints Impact Analysis*
| Restraint | (~) % Impact on CAGR Forecast | Geographic Relevance | Impact Timeline |
|---|---|---|---|
| Rainfall variability and drought-linked yield swings | -1.4% | Northern and eastern regions | Short term (≤ 2 years) |
| Less Than 1 % irrigated area limits scale-up | -1.1% | National, commercial farming areas | Long term (≥ 4 years) |
| Aflatoxin rejections in maize and groundnuts | -0.8% | Humid regions | Medium term (2-4 years) |
| High cost / low availability of hermetic storage | -0.6% | Remote farming areas | Medium term (2-4 years) |
| Source: Mordor Intelligence | |||
Rainfall Variability and Drought-Linked Yield Swings
Climate volatility poses the most immediate threat to agricultural productivity, with the March-May 2024 season recording one of the driest periods since 1981 in northern Uganda, causing widespread crop failures and livestock losses. The Katakwi District drought from November 2024 to March 2025 resulted in over 1,000 livestock deaths, highlighting the sector's vulnerability to weather extremes that can swing cereal output by more than 20% year-over-year. This variability undermines investment confidence and complicates supply chain planning, as processors and exporters struggle to maintain consistent volumes and quality standards required for international markets.
Less Than 1% Irrigated Area Limits Scale-Up
Uganda's irrigation coverage remains critically low at less than 1% of cultivated area, constraining the sector's ability to achieve consistent high-value crop production required for export market penetration. This infrastructure deficit becomes more pronounced as climate change intensifies rainfall variability, forcing farmers to rely on rain-fed production that limits crop selection and harvest timing flexibility. In 2022, the World Bank's USD 96 million Uganda Climate Smart Agriculture Transformation Project addresses this constraint through planned desilting of 300 dams and creation of water management infrastructure, but implementation timelines extend beyond the immediate forecast period.
*Our forecasts treat driver/restraint impacts as directional, not additive. The impact forecasts reflect baseline growth, mix effects, and variable interactions.
Segment Analysis
By Crop Type: Cereals Drive Volume, Fruits Capture Value
Cereals and grains contributed 57.40% of the market share in 2025, led by maize crops serving domestic and regional buyers in South Sudan, the Democratic Republic of Congo, and Kenya. Sorghum and millet acreage expands in northern districts as climate-resilient options, while wheat remains a niche. Input vouchers and extension agents under the Parish Development Model lower production costs, yet post-harvest losses weigh on farm margins, underscoring the need for quality storage.
Fruits and vegetables forecast to register 8.92% CAGR through 2031, benefiting from improved cold-chain logistics at Entebbe Airport. Banana and plantain production serve domestic consumption, while Hass avocados, pineapples, and specialty Arabica coffee command premium export prices. Contract farming, aggregation centers, and digital trading platforms continue to reinforce growth across all crop groups, sustaining momentum for the market.



Geography Analysis
The central region’s proximity to Kampala creates a dense cluster of commercial farms, feed mills, and processing plants that capture economies of scale and distribute output throughout the agriculture market channels in Uganda. Western Uganda, notably the Ankole sub-region, produced 1.2 billion liters of milk in 2024 and hosts large coffee estates such as Kaweri Coffee Plantation, underlining its role in value-added exports. Eastern districts dominate cereal acreage and face heightened climate risk, having endured the driest March-May season in four decades in 2024.
Northern Uganda, including Karamoja, receives intensive public and donor support. UNDP’s Green Belts initiative shows how women-led cooperatives scaled from six-acre plots to 400-acre operations cultivating sorghum, green gram, and sunflower, demonstrating the inclusiveness of the market. Cross-border trade continues to buoy grain income as Uganda exports maize and beans to Kenya and the Democratic Republic of Congo, though political disruptions occasionally interrupt flows. The southwestern highlands’ altitude favors specialty coffee and Hass avocado production, positioning the region to capitalize on EU tariff exemptions and premium pricing.
The agriculture in Uganda market also gains from expanded trade with China, India, and other non-traditional partners, cushioning the loss of some AGOA preferences in the United States. While logistics corridors are improving, remote district roads remain vulnerable during rainy seasons, keeping transport costs high. Implementation of regional infrastructure, such as the Standard Gauge Railway extension, is projected to further reduce freight costs and reinforce Uganda’s role as an agricultural supplier to East and Central Africa.
Regulatory Landscape
Uganda's agriculture sector is regulated through a mix of sector ministries and cross-cutting standards bodies, with the Ministry of Agriculture, Animal Industry and Fisheries (MAAIF) setting sector policy under the National Agriculture Policy and coordinating input and sanitary controls, while the Uganda National Bureau of Standards (UNBS) enforces inspection, clearance, and market surveillance requirements under its 2022 inspection and clearance regulations and 2021 market surveillance regulations. Quality and conformity controls increasingly shape commercialization, particularly for export-oriented horticulture and grains, where phytosanitary verification, residue risk surveillance, and post-harvest handling requirements influence packhouse practices, testing demand, and traceability systems.
Regulatory consolidation is also moving into view. In July 2026, Cabinet approved the Food and Agriculture Regulatory Authority Bill, 2026, proposing to merge food safety, veterinary, and agricultural input oversight under a single authority to reduce fragmentation and strengthen consumer protection and export competitiveness. On the livestock and feed side, the Animal Feeds Act, 2024 (assented in May 2024) established an Animal Feeds Committee to regulate the production, importation, storage, and sale of animal feeds, supporting formalization of feed manufacturing and tighter controls on quality and labeling for the expanding dairy, poultry, and pig value chains.
Value Chain Analysis
Uganda's agriculture value chain spans input supply (seed, fertilizer, crop protection, animal feed and veterinary services), farm production dominated by smallholders, aggregation via traders and cooperatives, processing across coffee, dairy, grains, oilseeds, and sugar, and distribution through domestic wholesale markets and regional export corridors. Public programs, including the Parish Development Model and MAAIF-led value chain initiatives, act as catalysts for commercialization by improving access to extension, input channels, and aggregation, while digital grain-trade and price/logistics platforms reduce information gaps between producers, traders, and processors.
Key bottlenecks persist around input integrity, climate exposure, and post-harvest infrastructure. Counterfeit and substandard inputs remain a structural constraint (with estimates indicating 30% to 40% of seeds on the market are counterfeit), while fertilizer distribution is fragmented and skewed toward estates (about 66% of consumption), limiting adoption among smallholders. On the physical chain, low irrigation coverage and variable rainfall elevate supply volatility for processors and exporters, and storage gaps raise losses and quality risk; in response, investment is flowing into irrigation and climate-resilience assets such as the USD 21 million Atari River Basin Irrigation Scheme (construction commenced in March 2025 in Bulambuli and Kween) and larger water-for-production programs (including MWACRID in Masindi and Kiryandongo and other schemes such as Unyama, Namalu, and Sipi) that strengthen the production base for cereals, horticulture, and oilseeds destined for processing and export.
Market Opportunities and Future Outlook
Agro-industrialization is creating concrete whitespace in processing, storage, and logistics that links directly to Uganda's main commodity chains. Government budgeting has elevated the Agro-Industrialisation Programme, and the FY 2026/27 allocation of Shs 2.26 trillion provides an anchor for irrigation, value addition, and research spending that can translate into bankable projects for processors, cold-chain operators, and input suppliers. Export compliance pressure is also pulling investment into testing, traceability, and post-harvest handling, reinforced by UNBS enforcement and the proposed consolidation under the Food and Agriculture Regulatory Authority Bill, 2026.
Named projects point to where capacity is being built and where suppliers can plug in. In July 2026, Nonda Commodities Limited and Ingazi Group International broke ground on a USD 248 million Coffee Value Park in Nakaseke to process coffee, cocoa, and vanilla, expanding demand for raw material sourcing, aggregation, and quality management services. Industrial-park and trade-finance initiatives also widen the opportunity set: the Lusenke Kayunga Agro-Industrial Park land allocation (1,200 acres, April 2026) signals new sites for fruit and food-crop processing, while UKEF-backed financing (EUR 192.9 million, January 2026) for agricultural modernization tied to processing, storage, and cold-chain infrastructure strengthens the pipeline for equipment vendors, EPC contractors, and off-takers. Climate-resilient water infrastructure remains a central lever for stabilizing supply to agro-processors, supported by AfDB's USD 140 million approval in June 2026 for the Uganda Multipurpose Water for Climate Resilient Irrigation Development and Agro-Industrialization Programme in the Bunyoro subregion.
Recent Industry Developments
- July 2026: Uganda's Cabinet approved the Food and Agriculture Regulatory Authority Bill, 2026, proposing a single regulator for food safety, veterinary oversight, agricultural chemicals, and animal feeds. The move responds to overlapping mandates and aims to tighten enforcement across input quality and export compliance. For processors and exporters, a unified framework can simplify certification pathways while raising the bar on traceability and residue controls.
- February 2026: Sukuma Commodities secured a USD 1.8 million expanded loan facility from Sahel Capital via the Social Enterprise Fund for Agriculture in Africa (SEFAA) to fund working capital and increase coffee export volumes. The financing strengthens procurement capacity at origin and supports more consistent fulfillment for specialty and bulk buyers. It also underscores the growing role of structured finance in scaling export-linked agribusinesses.
- June 2025: Talanta Finance Limited signed a 5,000 metric tonne simsim (sesame) offtake agreement for the China market, with an announced pathway to scale volumes linked to local processing infrastructure. The deal spotlights export demand translating into higher requirements for aggregation, cleaning, grading, and compliance documentation. It also reinforces incentives for investment in sesame value addition and quality assurance systems.


Research Methodology Framework and Report Scope
Market Definition and Coverage
For this report, the market covers the value of agricultural output in Uganda across major crop groups, tracked through production, consumption, trade, and price movements, and expressed in USD value terms for each year.
Scope exclusions: Livestock, fisheries, forestry, and downstream food processing are excluded from this market sizing.
Segmentation Overview
- By Crop Type (Production Analysis (Volume), Consumption Analysis (Volume and Value), Import Analysis (Volume and Value), Export Analysis (Volume and Value), and Price Trend Analysis)
- Cereals and Grains
- Oilseeds and Pulses
- Fruits and Vegetables
Data Sources, Market Sizing, and Validation
Desk Research
Desk research starts by building a fact base on Uganda agriculture volumes, farmgate price signals, and trade flows, and then aligns these inputs to the crop groups used in the model. We mostly rely on public sources such as FAOSTAT, the Uganda Bureau of Statistics, Ministry of Agriculture Animal Industry and Fisheries publications, World Bank indicators, and UN Comtrade for export and import references.
After the base numbers are assembled, we cross-check them against directional information from company filings, investor presentations, credible press coverage, and sector updates shared by industry associations. A paid database subscription is used in a limited way for company financials and for shipment level import and export screening when it helps validate trade-linked crops. These desk sources are illustrative, and other public and paid references are also used during data collection and clarification.
Primary Interviews and Surveys
We conduct interviews and surveys with growers, aggregators, produce traders, processors, input distributors, functional leaders, managers, and public-sector agriculture specialists in Uganda. Responses test crop volumes, prices, import dependence, channel margins, and missing periods before assumptions are checked against desk data.
Distribution of primary research fieldwork respondents
| Company type | Respondent position |
|---|---|
| Top tier: 29% | CXOs: 19% |
| Mid tier: 46% | Functional/Unit leaders: 31% |
| Smaller Players: 25% | Managers: 50% |
Market-Sizing & Forecasting
Sizing begins with a top-down reconstruction where official production volumes and trade statistics are mapped to the covered crop groups, and then multiplied by observed price series to convert output into annual USD values. Since single sources can miss informal flows, we corroborate results with selective bottom-up checks, such as sampled crop volumes from aggregators and exporters, channel checks on farmgate versus wholesale spreads, and a sanity check using cropped-area and yield movements.
Key inputs used in the model include harvested area, average yields, farmgate and wholesale price trends, exportable surplus patterns, and currency timing for USD conversion, which together explain year-to-year value changes beyond volume swings. Forecasting uses scenario analysis supported by a light multivariate regression, where drivers such as yield trend, rainfall variability, policy support signals, and trade demand are stress-tested with expert feedback. When bottom-up datapoints are sparse for a crop, we fill gaps through range-based assumptions anchored to neighboring seasons and validated again in follow-up calls.
Data Validation & Update Cycle
Outputs are validated through multiple checks so totals stay consistent with independent signals such as crop-specific export values, price seasonality, and known supply shocks. We investigate variances at the crop level first, then roll them up only after anomalies are explained, followed by an internal review before sign-off.
The report is refreshed on an annual cycle, and interim updates are triggered when there are material shifts such as extreme weather events, major policy changes, or sharp price movements. Before delivery, we do a final pass on recent public releases and re-contact selected experts if new information creates a meaningful change to assumptions.
Mordor Intelligence's Uganda Agriculture Market Sizing Compared With Other Published Estimates
Published estimates for Uganda agriculture often differ because analysts do not always measure the same activities, and they also vary on whether they size output value, traded value, or a wider agri-business definition. Differences in base year selection, currency conversion timing, and the way price trends are carried into forecasts also create visible gaps.
Livestock and fisheries are sometimes included inside a broader agriculture total, but they sit outside Mordor Intelligence's scope here, which keeps the number tied to crop production, consumption, trade, and price signals for the covered groups. Other gaps typically come from using retail food value instead of farm output, applying a single blended price to multiple crops, or using older production tables without re-validating informal market share and exportable surplus assumptions.
Benchmark comparison
| Source | Market Size | Gaps in Research Methodology |
|---|---|---|
| Mordor Intelligence | USD 15.20 B (2025) | |
| Global Consultancy A | USD 4.07 B (2023) | Uses a much wider sector framing that mixes in multiple agri-related activities and then reports a single value-only total, which can undercount crop output when production volumes and farmgate prices are not rebuilt crop by crop. |
| Industry Publisher B | USD 6.80 B (2026) | Runs a different scope that includes additional primary activities beyond crops and uses a longer forecast window, so the 2026 value is not directly comparable to a crop-output based total aligned to Uganda production and trade tables. |
Seen together, the spread mostly comes from scope mix and the value layer being measured, not just different growth expectations. By keeping the model traceable to crop volumes, crop-linked prices, and trade cross-checks, the estimate remains easier to audit and to reproduce when assumptions are updated.


Key Questions Answered in the Report
What is the anticipated value of Uganda agriculture sector by 2031?
Forecasts point to USD 22.31 billion in 2031, up from USD 15.20 billion in 2025.
How fast is the fruits and vegetables segment growing?
It is projected to post a 8.92% CAGR through 2031, the fastest among all crop groups.
Which crop group currently holds the largest share?
Cereals and grains lead with 57.40% share as of 2025.
What climate risk poses the biggest threat to production?
Rainfall variability and drought can swing cereal output by more than 20% year-over-year.
Page last updated on:


 Your data is secure and never sold or shared.


