Market Overview
| Study Period | 2021 - 2031 |
|---|---|
| Forecast Data Period | 2026 - 2031 |
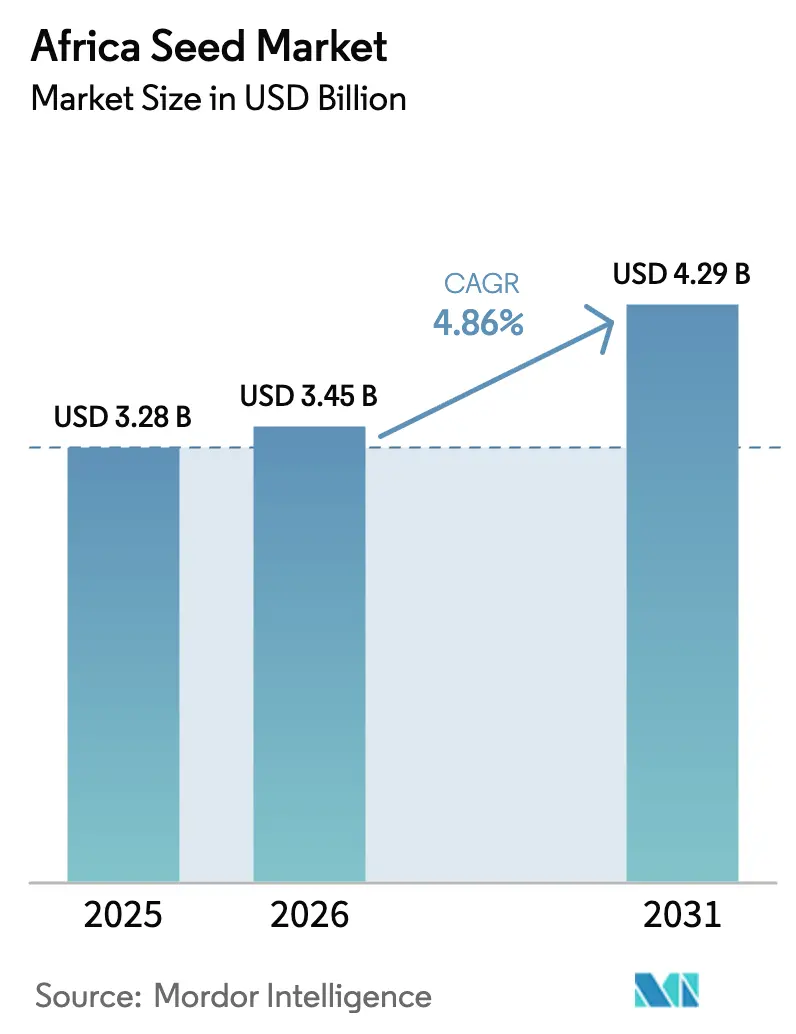
| Base Year Market Size (2025) | USD 3.28 Billion |
| Market Size (2026) | USD 3.45 Billion |
| Market Size (2031) | USD 4.29 Billion |
| Growth Rate (2026 - 2031) | 4.86% CAGR |
| Market Concentration | Low |
Major Players
*Disclaimer: Major Players sorted in no particular order Image © Mordor Intelligence. Reuse requires attribution under CC BY 4.0. |
|
Africa Seed Market Analysis by Mordor Intelligence
The Africa seed market size is USD 3.28 billion in 2025 to USD 3.45 billion in 2026 and is forecast to reach USD 4.29 billion by 2031 at a 4.86% CAGR over 2026-2031. The projected expansion rests on four structural pillars: growing preference for hybrid and stress-tolerant genetics, the steady roll-out of government-funded seed-replacement schemes, ongoing expansion of irrigated acreage, and the landmark regional seed-law harmonization that came into force under the African Continental Free Trade Area in 2024. Digitally enabled micro-pack distribution has further lowered entry barriers for smallholder farmers, who account for roughly 80% of regional production, while early field trials of gene-edited crops promise an additional pipeline of climate-resilient varieties. Together, these forces are tilting the balance away from informal exchange networks toward structured commercial channels that emphasize quality assurance, traceability, and faster varietal turnover.
Key Report Takeaways
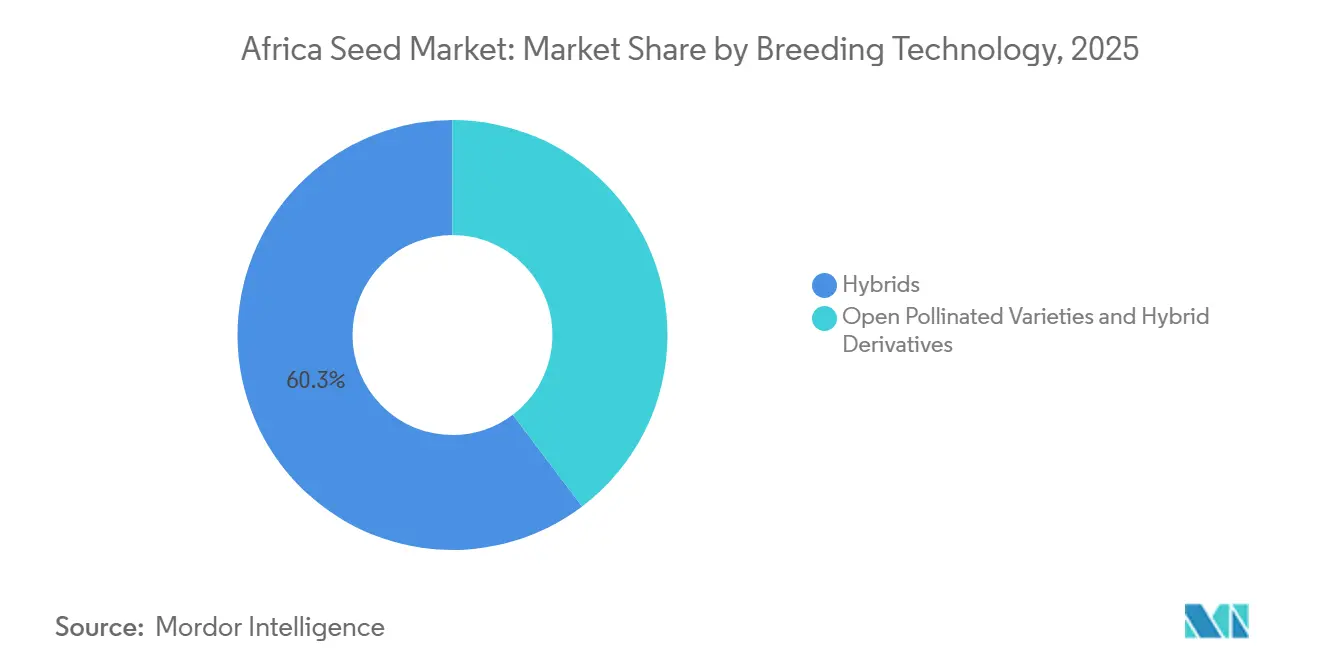
- By breeding technology, hybrids held 60.3% of the Africa seed market in 2025, while open-pollinated varieties and hybrid derivatives are projected to grow at a 4.9% CAGR through 2031.
- By cultivation mechanism, open field systems accounted for 99.9% of Africa's seed market size in 2025, and protected cultivation is projected to expand at a 7.6% CAGR through 2031.
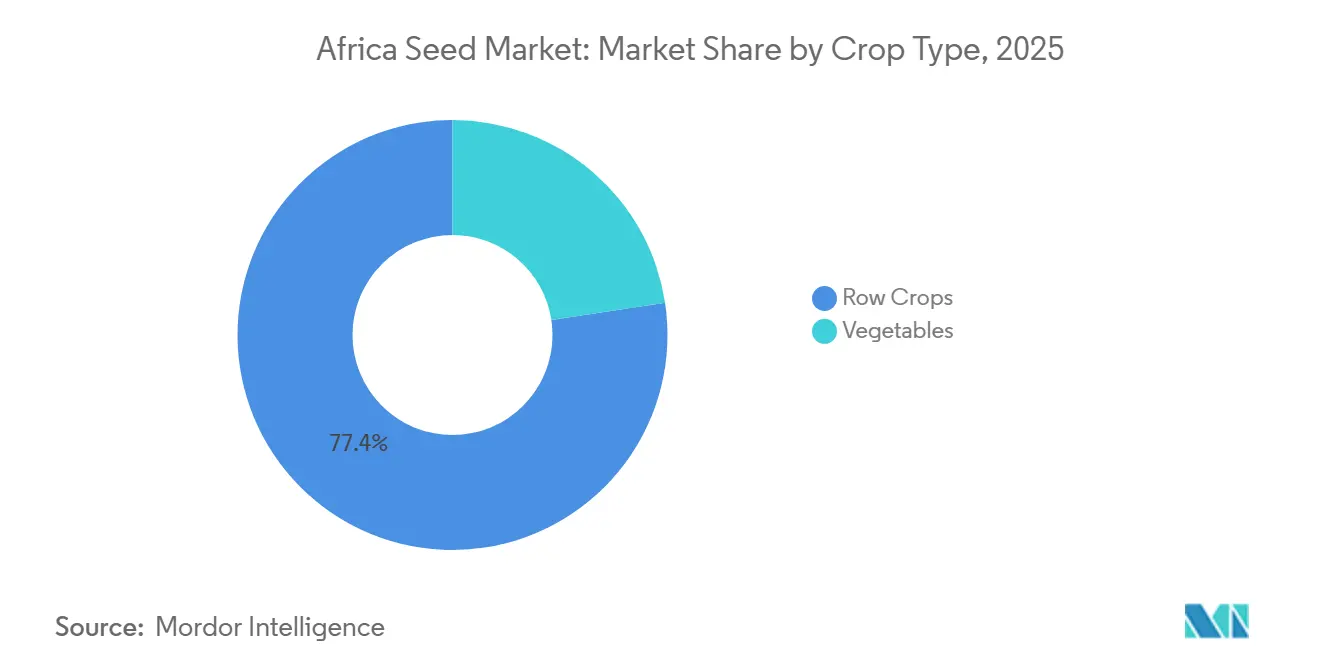
- By crop type, row crops held 77.4% of the Africa seed market in 2025, yet vegetables remain the fastest-growing segment, with a 5.4% CAGR to 2031.
- By geography, Nigeria leads the market with a 40.6% share in 2025, while Kenya is the fastest-growing country segment, with a CAGR of 6.2% to 2031.
Note: Market size and forecast figures in this report are generated using Mordor Intelligence’s proprietary estimation framework, updated with the latest available data and insights as of 2026.
Africa Seed Market Trends and Insights
Drivers Impact Analysis*
| Driver | (~) % Impact on CAGR Forecast | Geographic Relevance | Impact Timeline |
|---|---|---|---|
| Rising adoption of hybrid and stress-tolerant seed varieties | +1.2% | Nigeria, Kenya, South Africa, and Ghana | Medium term (2-4 years) |
| Government-funded input and seed-replacement programs | +0.8% | Nigeria, Ethiopia, Tanzania, and Kenya | Short term (≤ 2 years) |
| Expansion of irrigated land and protected cultivation | +0.6% | Egypt, South Africa, Kenya, Ghana | Long term (≥ 4 years) |
| Regional seed-law harmonization under AfCFTA (The African Continental Free Trade Area) | +0.7% | Tanzania and Kenya | Medium term (2-4 years) |
| Digital micro-pack seed sales via last-mile agro-dealers | +0.5% | Nigeria, Kenya, Ghana, Tanzania | Short term (≤ 2 years) |
| Gene-edited indigenous crops entering national trials | +0.4% | South Africa, Kenya, Nigeria | Long term (≥ 4 years) |
| Source: Mordor Intelligence | |||
Rising Adoption of Hybrid and Stress-Tolerant Seed Varieties
Climate volatility is encouraging farmers to adopt hybrids that offer improved yield stability, drought tolerance, and pest resistance compared to traditional open-pollinated varieties. In 2025, Nigeria reported a 35% increase in hybrid maize adoption, with stress-tolerant varieties accounting for 60% of new registrations.[1]Source: Nigeria Agricultural Seed Council, "Annual Seed Registration Report 2024," seedcouncil.gov.ng. Both multinational companies and local breeders are focusing on developing heat-tolerant wheat for Egypt's desert regions and drought-resistant sorghum for the Sahel, expanding the hybrid portfolio across various agro-ecological zones.
Government-Funded Input and Seed-Replacement Programs
Public programs continue to serve as a dependable driver of demand. Nigeria's Anchor Borrowers Programme, for instance, provided 2.3 million metric tons of certified seed in 2024[2]Source: Central Bank of Nigeria, "Anchor Borrowers Programme Report 2024," cbn.gov.ng. Ethiopia integrates annual seed vouchers into its Productive Safety Net Programme, effectively connecting social protection initiatives with varietal renewal. Tanzania has set a target to achieve a substantial replacement rate of traditional seed stocks by 2027, utilizing cooperatives to distribute subsidized seed packets. These initiatives not only ensure demand stability for suppliers but also contribute to improved genetic gains in agricultural production.
Expansion of Irrigated Land and Protected Cultivation
Access to water and micro-climate control are influencing seed preferences. Egypt manages 45,000 hectares of greenhouse area, supporting a specialized vegetable seed segment.[3]Source: Egyptian Ministry of Agriculture, "Protected Cultivation Statistics 2024," agriculture.gov.eg. In South Africa's Western Cape, there is modest annual growth in high-tech greenhouses, while Kenya's industry expanded its greenhouse area in 2025. As protected cultivation continues to grow, demand is increasingly focused on determinate growth habits, uniform maturity, and multi-disease resistance traits incorporated into next-generation hybrids designed for high-value horticultural production.
Regional Seed-Law Harmonization under AfCFTA (The African Continental Free Trade Area)
The 2024 African Continental Free Trade Area (AfCFTA) protocols allow registered products from one signatory nation to circulate in 21 markets without requiring additional testing, significantly reducing entry costs. This regulatory alignment reduces seed companies' market-entry costs by 40-60% and enables faster cross-border deployment of varieties. Additionally, the West African Economic and Monetary Union's unified seed certification system, introduced in 2024, establishes a streamlined market for farmers by streamlining the regulatory approval process. Furthermore, Vegetable breeders, such as Rijk Zwaan, utilize harmonized phytosanitary certificates to streamline the import of parent seeds from Europe and Asia. This harmonization expands the market potential for each new hybrid, enhances economies of scale, and contributes 0.5% to the growth of the African seed market.
Restraints Impact Analysis*
| Restraint | (~) % Impact on CAGR Forecast | Geographic Relevance | Impact Timeline |
|---|---|---|---|
| Dominance of informal seed systems supplying seed | -1.1% | Sub-Saharan Africa, rural areas | Long term (≥ 4 years) |
| Fragmented GMO regulations are delaying transgenic approvals | -0.7% | Nigeria, Ghana, Kenya, and Tanzania | Medium term (2-4 years) |
| Counterfeit seed eroding farmer trust | -0.6% | Nigeria, Kenya, Ghana, and Tanzania | Short term (≤ 2 years) |
| Rising hybrid-production costs | -0.4% | Global, affecting smallholder farmers | Medium term (2-4 years) |
| Source: Mordor Intelligence | |||
Dominance of Informal Seed Systems Supplying Seed
Traditional seed systems continue supplying farmers with seed requirements across sub-Saharan Africa, limiting commercial seed market penetration despite the quality and yield advantages of certified varieties. Ethiopia's Central Statistical Agency reported that most smallholder farmers rely on farm-saved seeds and informal exchanges, constraining hybrid adoption rates. This preference stems from cultural practices, economic constraints, and risk-averse farming strategies that prioritize seed security over yield maximization. Tanzania's informal seed networks supply traditional crop varieties, creating parallel distribution systems that compete directly with commercial channels while maintaining genetic diversity but limiting productivity gains.
Fragmented GMO Regulations Delaying Transgenic Approvals
Inconsistent biotechnology policies across African countries create regulatory uncertainty that delays transgenic crop commercialization and increases development costs for seed companies. Nigeria's National Biotechnology Development Agency approved Bt cotton and cowpea varieties in 2024, while neighboring Ghana maintains restrictive Genetically Modified Organism (GMO) policies that prevent similar technology deployment. Kenya's decade-long GMO moratorium, partially lifted in 2024, illustrates regulatory volatility that discourages long-term biotechnology investments. These policy inconsistencies fragment the continental market into biotechnology-friendly and restrictive zones, limiting economies of scale for transgenic seed development.
*Our forecasts treat driver/restraint impacts as directional, not additive. The impact forecasts reflect baseline growth, mix effects, and variable interactions.
Segment Analysis
By Breeding Technology: Hybrids Sustain Leadership amid Affordability Tension
Hybrids dominate the Africa seed market with a 60.3% share in 2025, driven by superior yield performance and increasing farmer awareness of productivity benefits. Open-pollinated varieties demonstrate faster growth, with a 4.9% CAGR through 2031, reflecting cost-conscious farmer preferences and breeding companies' focus on affordable variety development. Within hybrid categories, non-transgenic varieties maintain market leadership, while transgenic hybrids gain traction in biotechnology-friendly countries such as South Africa and Nigeria. Herbicide-tolerant hybrids show particular promise in mechanized farming systems, while insect-resistant varieties address pest pressure in cotton and maize production.
The breeding technology landscape reflects broader agricultural modernization trends, with farmers gradually transitioning from traditional varieties toward improved genetics. Kenya's experience demonstrates this evolution, where hybrid maize adoption increased, supported by government extension services and seed company demonstration plots, Kenya Agricultural and Livestock Research Organization.


By Cultivation Mechanism: Protected Systems Accelerate from a Tiny Base
Open-field cultivation commands 99.9% of Africa's seed market in 2025, reflecting Africa's predominantly smallholder farming structure and limited infrastructure for controlled-environment agriculture. Protected cultivation demonstrates exceptional growth potential, with a 7.6% CAGR through 2031, driven by high-value crop production and climate-adaptation strategies. Egypt leads in protected cultivation adoption, with greenhouse vegetable production, while South Africa's Western Cape province is experiencing rapid expansion in flower and vegetable greenhouse systems.
Protected cultivation growth correlates with urbanization trends and the increasing demand for year-round fresh produce. Kenya's greenhouse industry, which generated strong export revenues in 2024, demonstrates the economic viability of controlled environment agriculture in African contexts. Morocco's greenhouse cluster in Agadir province supplies European markets with off-season vegetables, illustrating the export potential of protected cultivation systems. These developments create specialized seed demand for greenhouse-adapted varieties that require specific characteristics, such as determinate growth habits, disease resistance, and uniform maturity patterns.
By Crop Type: Vegetables Surface as the Growth Engine
Row crops account for 77.4% of the Africa seed market in 2025, dominated by staple grains and cereals that form the foundation of the region's food security systems. Vegetables exhibit superior growth dynamics, with a 5.4% CAGR through 2031, driven by urbanization, dietary diversification, and the development of export markets. Within row crops, grains and cereals lead demand, followed by oilseeds benefiting from cooking oil processing expansion. Fiber crops, particularly cotton, face challenges from synthetic materials but remain important in West African economies.
The demand for vegetable seeds is influenced by shifting consumption patterns, as urban populations increasingly seek diverse and nutritious food options beyond traditional staples. In Nigeria, the tomato processing industry significantly drives demand for hybrid tomato seeds, fostering backward linkages with smallholder farmers through the Nigerian Tomato Growers Association. Among vegetables, Solanaceae varieties, such as tomatoes, peppers, and eggplants, exhibit the highest growth, followed by Brassicas and Cucurbits. Root and bulb vegetables, including onions and potatoes, are benefiting from advancements in the storage and processing industries. Additionally, unclassified vegetables like lettuce and spinach are gaining popularity due to their role in urban agriculture systems and export-oriented production.
Geography Analysis
The seed market in Nigeria remains a key growth area within Africa, with a share of 41.6% in 2025, supported by a national budget that prioritizes certified seeds for maize, rice, and cowpea. The government is utilizing mobile-based e-voucher systems to improve quality control. However, the formal market faces challenges due to the dominance of an informal seed sector and the prevalence of counterfeit products. In contrast, Egypt and South Africa are established hubs on the continent, with advanced biotechnology and protected cultivation driving specialization in high-value seeds.
South Africa continues to lead in large-scale commercial farming, benefiting from a well-developed biosafety framework for Bt maize and progress in gene-editing technologies. In Africa, Kenya is experiencing significant growth with a CAGR of 6.2% during the forecast period, driven by the Bottom-Up Economic Transformation Agenda and stringent certification processes enforced by national regulators. Kenya’s adoption of digital tools, including mobile advisory and fintech platforms, positions it as a leading testing ground for data-driven last-mile delivery models, which are now being scaled across the region.
Ethiopia and Tanzania present notable opportunities through dedicated irrigation corridors, such as Tanzania's southern highlands and Ethiopia's Blue Nile tributaries. In Ghana, the market has evolved following the environmental release of several GMO varieties, which has reduced previous biotech hesitancy and expanded grain production potential. Regional growth is increasingly supported by the AfCFTA seed protocols, which aim to harmonize regulations and enable companies to distribute research and development costs across larger, cross-border acreages.
Competitive Landscape
The African seed market has low market concentration, where numerous players compete for market share. The top five players, including Bayer AG, Syngenta Group, Corteva Agrisciences, East-West Seed, and Kenya Seed Company, hold a significant share due to their extensive product portfolios, strong distribution networks, and investments in research and development for the development of new seed varieties that are specifically to develop new seed varieties customized to African conditions.
Multinational corporations and local players operate in a fragmented market where regulatory compliance is as important as product performance. Bayer AG leverages its global research and development capabilities while increasingly localizing production. This approach is highlighted by the planned opening of a maize seed facility in Zambia in March 2025, aimed at meeting the African Continental Free Trade Area (AfCFTA) rules of origin and reducing foreign-exchange risks. Major companies are also investing in digital platforms, with Bayer reporting significant growth in African user engagement through its Climate FieldView and BayG.A.P. tools in 2025. Meanwhile, companies like East-West Seed and FICA Seeds (Uganda) focus on strong farmer relationships and adaptability, often outperforming larger competitors in specific regional markets, such as indigenous vegetables.
Innovation in distribution has emerged as a key competitive focus. Companies are striving to optimize micro-pack formats, integrate mobile payment systems, and enhance last-mile logistics to better serve smallholder farmers. Syngenta’s Cropwise and Centaur platforms have seen rapid expansion, with the company targeting millions of smallholders by 2025 through digital advisory services designed to build trust. Corteva Agriscience is strengthening its presence in Africa through strategic academic partnerships, such as its collaboration with the University of Pretoria, to improve local breeding capabilities and develop talent for long-term market growth.
The African Continental Free Trade Area (AfCFTA) seed protocols are transforming competitive dynamics by harmonizing seed regulations, enabling cross-border production efficiencies. This allows companies to centralize breeding efforts in regional centers of excellence while serving multiple markets under a single registration. Such changes benefit players with regional scale and advanced regulatory expertise, potentially driving industry consolidation. However, local specialists like Kenya Seed Company and Zamseed continue to address cultural and agro-ecological needs overlooked by global firms, particularly in climate-resilient crops such as sorghum, millet, and indigenous leafy greens.
Africa Seed Industry Leaders
-
BASF SE
-
Bayer AG
-
Corteva Agriscience
-
Groupe Limagrain
-
Syngenta Group
- *Disclaimer: Major Players sorted in no particular order


Recent Industry Developments
- September 2025: Bejo and Tropic Embark on Strategic Partnership to provide Durable Disease Resistance in Carrot seeds using GEiGS (Gene Silencing) technology. The collaboration aims to create non-GMO, sustainable, and durable resistance against soilborne and foliar pathogens in Bejo’s elite carrot germplasm, addressing yield losses.
- May 2025: East-West Seed established a vegetable seed production facility in Tanzania, targeting regional markets with client-resistant African eggplant hybrid seed varieties for smallholder farmers.
- March 2025: Bayer established a maize seed processing facility in Kabwe, Zambia. The new facility, named "Baya Itaba," aims to triple the company's seed production capacity in Zambia to provide smallholder farmers with increased access to high-quality maize seeds.


Africa Seed Market Report Scope
A seed is the fertilized, matured ovule of a flowering plant (angiosperm) or gymnosperm, containing an embryonic plant, stored nutrients (endosperm), and a protective outer coat (testa). The Africa Seed Market Report is Segmented by Breeding Technology (Hybrids and More), Cultivation Mechanism (Open Field and Protected Cultivation), Crop Type (Row Crops and Vegetables), and Geography (Egypt, Ethiopia, Ghana, and More). The Market Forecasts are Provided in Terms of Value (USD) and Volume (Metric Tons).
Breeding Technology
| Hybrids | Non-Transgenic Hybrids | |
| Transgenic Hybrids | Herbicide Tolerant Hybrids | |
| Insect Resistant Hybrids | ||
| Open Pollinated Varieties and Hybrid Derivatives | ||
Cultivation Mechanism
| Open Field |
| Protected Cultivation |
Crop Type
| Row Crops | Fiber Crops | Cotton |
| Other Fiber Crops | ||
| Forage Crops | Alfalfa | |
| Forage Corn | ||
| Forage Sorghum | ||
| Other Forage Crops | ||
| Grains and Cereals | Corn | |
| Rice | ||
| Sorghum | ||
| Wheat | ||
| Other Grains and Cereals | ||
| Oilseeds | Canola, Rapeseed and Mustard | |
| Soybean | ||
| Sunflower | ||
| Other Oilseeds | ||
| Pulses | ||
| Vegetables | Brassicas | Cabbage |
| Carrot | ||
| Cauliflower and Broccoli | ||
| Other Brassicas | ||
| Cucurbits | Cucumber and Gherkin | |
| Pumpkin and Squash | ||
| Other Cucurbits | ||
| Roots and Bulbs | Garlic | |
| Onion | ||
| Potato | ||
| Other Roots and Bulbs | ||
| Solanaceae | Chilli | |
| Eggplant | ||
| Tomato | ||
| Other Solanaceae | ||
| Unclassified Vegetables | Asparagus | |
| Lettuce | ||
| Okra | ||
| Peas | ||
| Spinach | ||
| Other Unclassified Vegetables | ||
Country
| Egypt |
| Ethiopia |
| Ghana |
| Kenya |
| Nigeria |
| South Africa |
| Tanzania |
| Rest of Africa |
| Breeding Technology | Hybrids | Non-Transgenic Hybrids | |
| Transgenic Hybrids | Herbicide Tolerant Hybrids | ||
| Insect Resistant Hybrids | |||
| Open Pollinated Varieties and Hybrid Derivatives | |||
| Cultivation Mechanism | Open Field | ||
| Protected Cultivation | |||
| Crop Type | Row Crops | Fiber Crops | Cotton |
| Other Fiber Crops | |||
| Forage Crops | Alfalfa | ||
| Forage Corn | |||
| Forage Sorghum | |||
| Other Forage Crops | |||
| Grains and Cereals | Corn | ||
| Rice | |||
| Sorghum | |||
| Wheat | |||
| Other Grains and Cereals | |||
| Oilseeds | Canola, Rapeseed and Mustard | ||
| Soybean | |||
| Sunflower | |||
| Other Oilseeds | |||
| Pulses | |||
| Vegetables | Brassicas | Cabbage | |
| Carrot | |||
| Cauliflower and Broccoli | |||
| Other Brassicas | |||
| Cucurbits | Cucumber and Gherkin | ||
| Pumpkin and Squash | |||
| Other Cucurbits | |||
| Roots and Bulbs | Garlic | ||
| Onion | |||
| Potato | |||
| Other Roots and Bulbs | |||
| Solanaceae | Chilli | ||
| Eggplant | |||
| Tomato | |||
| Other Solanaceae | |||
| Unclassified Vegetables | Asparagus | ||
| Lettuce | |||
| Okra | |||
| Peas | |||
| Spinach | |||
| Other Unclassified Vegetables | |||
| Country | Egypt | ||
| Ethiopia | |||
| Ghana | |||
| Kenya | |||
| Nigeria | |||
| South Africa | |||
| Tanzania | |||
| Rest of Africa | |||


Market Definition
- Commercial Seed - For the purpose of this study, only commercial seeds have been included as part of the scope. Farm-saved Seeds, which are not commercially labeled are excluded from scope, even though a minor percentage of farm-saved seeds are exchanged commercially among farmers. The scope also excludes vegetatively reproduced crops and plant parts, which may be commercially sold in the market.
- Crop Acreage - While calculating the acreage under different crops, the Gross Cropped Area has been considered. Also known as Area Harvested, according to the Food & Agricultural Organization (FAO), this includes the total area cultivated under a particular crop across seasons.
- Seed Replacement Rate - Seed Replacement Rate is the percentage of area sown out of the total area of crop planted in the season by using certified/quality seeds other than the farm-saved seed.
- Protected Cultivation - The report defines protected cultivation as the process of growing crops in a controlled environment. This includes greenhouses, glasshouses, hydroponics, aeroponics, or any other cultivation system that protects the crop against any abiotic stress. However, cultivation in an open field using plastic mulch is excluded from this definition and is included under open field.
| Keyword | Definition |
|---|---|
| Row Crops | These are usually the field crops which include the different crop categories like grains & cereals, oilseeds, fiber crops like cotton, pulses, and forage crops. |
| Solanaceae | These are the family of flowering plants which includes tomato, chili, eggplants, and other crops. |
| Cucurbits | It represents a gourd family consisting of about 965 species in around 95 genera. The major crops considered for this study include Cucumber & Gherkin, Pumpkin and squash, and other crops. |
| Brassicas | It is a genus of plants in the cabbage and mustard family. It includes crops such as carrots, cabbage, cauliflower & broccoli. |
| Roots & Bulbs | The roots and bulbs segment includes onion, garlic, potato, and other crops. |
| Unclassified Vegetables | This segment in the report includes the crops which don’t belong to any of the above-mentioned categories. These include crops such as okra, asparagus, lettuce, peas, spinach, and others. |
| Hybrid Seed | It is the first generation of the seed produced by controlling cross-pollination and by combining two or more varieties, or species. |
| Transgenic Seed | It is a seed that is genetically modified to contain certain desirable input and/or output traits. |
| Non-Transgenic Seed | The seed produced through cross-pollination without any genetic modification. |
| Open-Pollinated Varieties & Hybrid Derivatives | Open-pollinated varieties produce seeds true to type as they cross-pollinate only with other plants of the same variety. |
| Other Solanaceae | The crops considered under other Solanaceae include bell peppers and other different peppers based on the locality of the respective countries. |
| Other Brassicaceae | The crops considered under other brassicas include radishes, turnips, Brussels sprouts, and kale. |
| Other Roots & Bulbs | The crops considered under other roots & bulbs include Sweet Potatoes and cassava. |
| Other Cucurbits | The crops considered under other cucurbits include gourds (bottle gourd, bitter gourd, ridge gourd, Snake gourd, and others). |
| Other Grains & Cereals | The crops considered under other grains & cereals include Barley, Buck Wheat, Canary Seed, Triticale, Oats, Millets, and Rye. |
| Other Fibre Crops | The crops considered under other fibers include Hemp, Jute, Agave fibers, Flax, Kenaf, Ramie, Abaca, Sisal, and Kapok. |
| Other Oilseeds | The crops considered under other oilseeds include Ground nut, Hempseed, Mustard seed, Castor seeds, safflower seeds, Sesame seeds, and Linseeds. |
| Other Forage Crops | The crops considered under other forages include Napier grass, Oat grass, White clover, Ryegrass, and Timothy. Other forage crops were considered based on the locality of the respective countries. |
| Pulses | Pigeon peas, Lentils, Broad and horse beans, Vetches, Chickpeas, Cowpeas, Lupins, and Bambara beans are the crops considered under pulses. |
| Other Unclassified Vegetables | The crops considered under other unclassified vegetables include Artichokes, Cassava Leaves, Leeks, Chicory, and String beans. |


Research Methodology
Mordor Intelligence follows a four-step methodology in all our reports.
- Step-1: IDENTIFY KEY VARIABLES: In order to build a robust forecasting methodology, the variables and factors identified in Step-1 are tested against available historical market numbers. Through an iterative process, the variables required for market forecast are set and the model is built on the basis of these variables.
- Step-2: Build a Market Model: Market-size estimations for the forecast years are in nominal terms. Inflation is not a part of the pricing, and the average selling price (ASP) is kept constant throughout the forecast period.
- Step-3: Validate and Finalize: In this important step, all market numbers, variables and analyst calls are validated through an extensive network of primary research experts from the market studied. The respondents are selected across levels and functions to generate a holistic picture of the market studied.
- Step-4: Research Outputs: Syndicated Reports, Custom Consulting Assignments, Databases, and Subscription Platforms


