South Africa Confectionery Market Size and Share
Market Overview
| Study Period | 2021 - 2031 |
|---|---|
| Forecast Data Period | 2026 - 2031 |
| Historical Data Period | 2021 - 2024 |
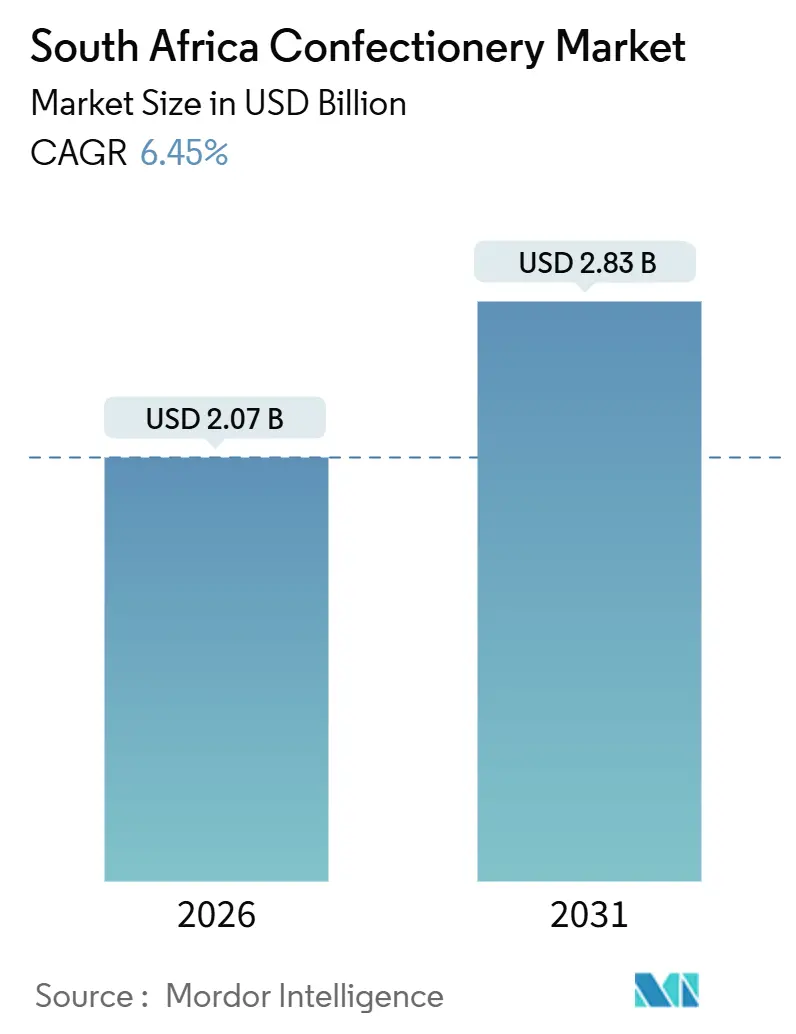
| Market Size (2026) | USD 2.07 Billion |
| Market Size (2031) | USD 2.83 Billion |
| Growth Rate (2026 - 2031) | 6.45% CAGR |
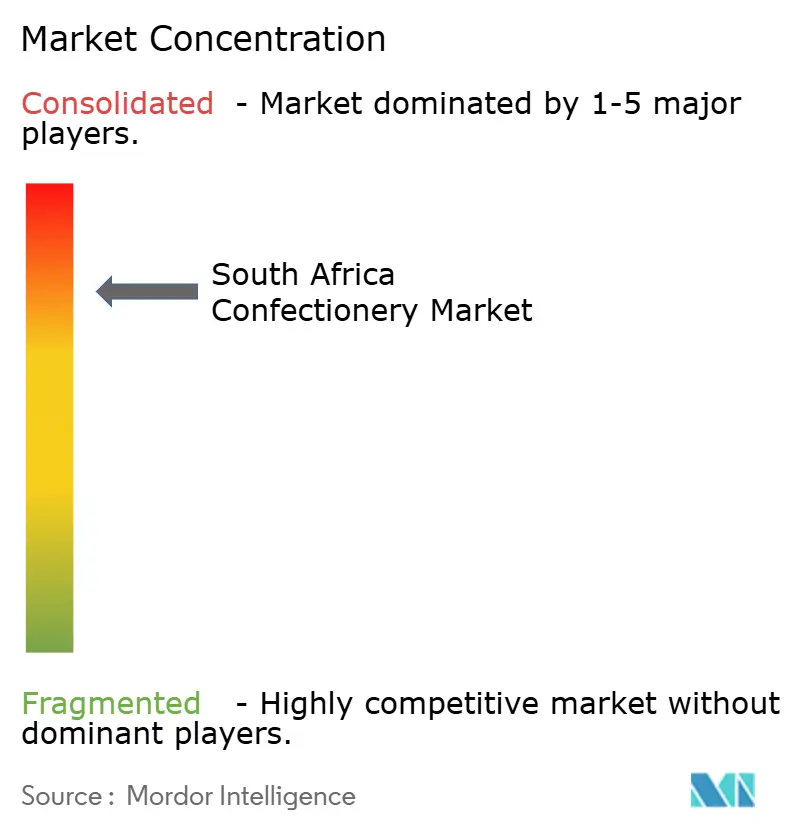
| Market Concentration | High |
Major Players
*Disclaimer: Major Players sorted in no particular order Image © Mordor Intelligence. Reuse requires attribution under CC BY 4.0. |
|
South Africa Confectionery Market Analysis by Mordor Intelligence
The South Africa confectionery market is valued at USD 2.07 billion in 2026 and is expected to grow to USD 2.83 billion by 2031, registering a CAGR of 6.45% during the forecast period. The market is driven by increasing disposable incomes, a growing trend of premium gifting, and the rising availability of convenient single-serve packaging. These factors are boosting consumer demand despite challenges posed by sugar-reduction policies, which have increased the cost of reformulating products. Chocolate continues to dominate the market in terms of volume; however, snack bars are gaining popularity due to their functional benefits and appeal to health-conscious consumers, particularly those seeking gym-friendly options. Regulatory measures such as the Health Promotion Levy and new front-of-pack labeling requirements are pushing manufacturers to innovate. Companies are increasingly using natural colors, plant-based sweeteners, and heat-stable fat blends to meet these regulations and cater to evolving consumer preferences. The market is highly consolidated, with a few major players holding significant market shares, which intensifies competition and drives innovation in the sector.
Key Report Takeaways
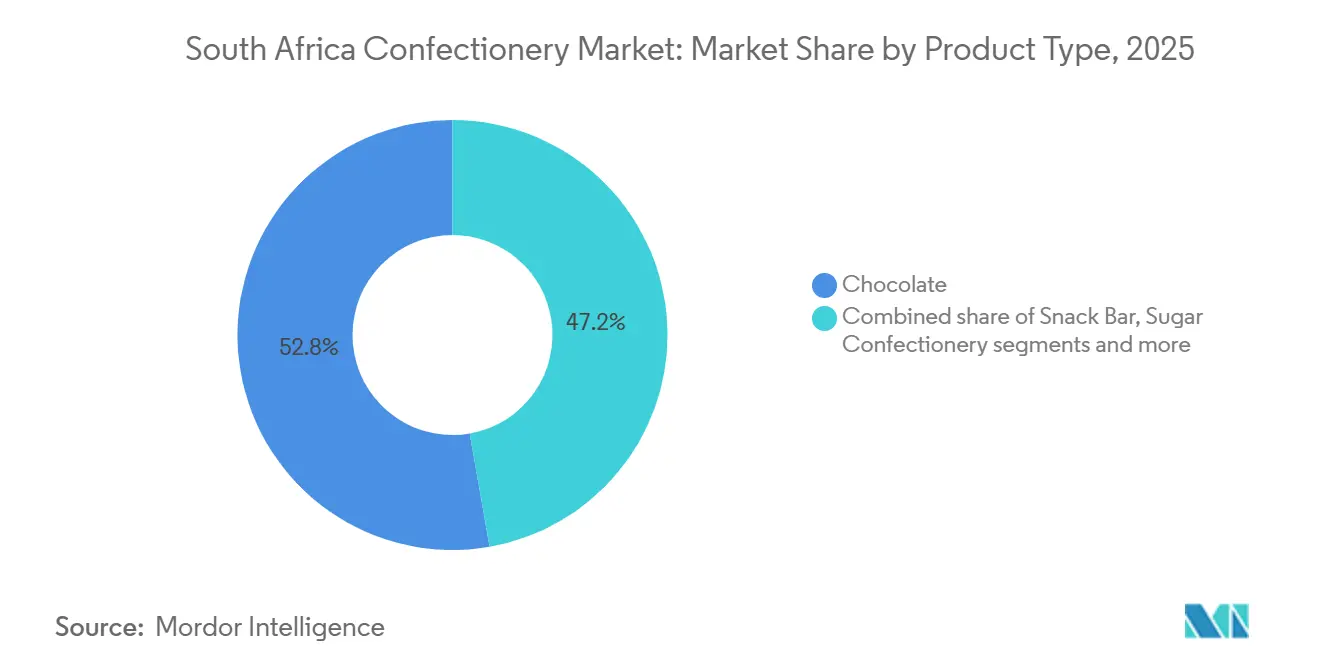
- By product type, chocolate led with 52.76% of the South Africa confectionery market share in 2025, while snack bars are forecast to record a 10.54% CAGR through 2031.
- By packaging, single-serve formats captured 66.73% of 2025 revenue, whereas multipacks are advancing at a 9.25% CAGR.
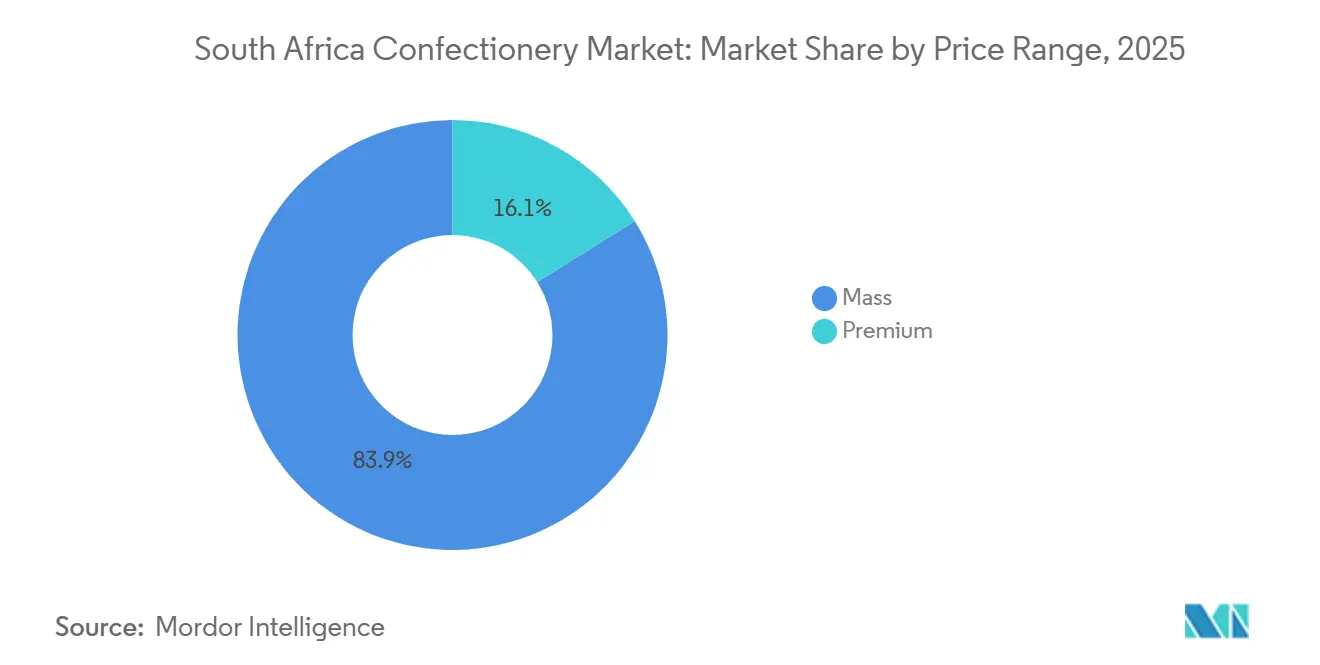
- By price range, mass-market SKUs commanded 83.89% of volume in 2025; the premium tier is projected to expand at a 10.77% CAGR.
- By distribution channel, supermarkets and hypermarkets held 51.48% share in 2025, yet online retail will accelerate at an 11.42% CAGR during 2026-2031.
Note: Market size and forecast figures in this report are generated using Mordor Intelligence’s proprietary estimation framework, updated with the latest available data and insights as of January 2026.
South Africa Confectionery Market Trends and Insights
Drivers Impact Analysis*
| Driver | (~) % Impact on CAGR Forecast | Geographic Relevance | Impact Timeline |
|---|---|---|---|
| Consumer shift towards convenient on-the-go consumption snacks | +1.1% | National, with early gains in Gauteng, Western Cape, KwaZulu-Natal urban centres | Medium term (2-4 years) |
| Growth in domestic tourism stimulating demand for locally produced confectionery | +0.7% | National, concentrated in Western Cape, Gauteng, KwaZulu-Natal tourist corridors | Short term (≤ 2 years) |
| Celebrity and influencer endorsements shaping brand perception | +0.5% | National, strongest in urban metros with high social media penetration | Short term (≤ 2 years) |
| Rising interest in organic and sustainably sourced products | +0.4% | Western Cape, Gauteng affluent suburbs; spillover to coastal metros | Long term (≥ 4 years) |
| Innovation in flavour profiles, product formats, and heat-resistant formulations | +1.2% | National, with research and development hubs in Gauteng and Western Cape | Medium term (2-4 years) |
| Growing interest in premium gifting during festive seasons | +0.8% | National, peak demand in Gauteng, Western Cape during December, February (Valentine's), April (Easter) | Short term (≤ 2 years) |
| Source: Mordor Intelligence | |||


Consumer shift towards convenient on-the-go consumption snacks
In South Africa’s confectionery market, consumer preferences are shifting toward portable and easy-to-carry products due to the fast-paced urban lifestyle and financial pressures faced by many households. As of 2024, the employment rate stands at 66.83%, according to Macrotrends, and a significant portion of consumers remains highly focused on value for money[1]Source: Macrotrends, "South Africa Unemployment Rate", macrotrends.net. This has led shoppers to seek a balance between convenience and affordability by opting for single-serve packs for quick, impulse purchases and multipacks that offer better cost savings per unit. Government household and retail surveys indicate that snacks and confectionery are commonly purchased from local spaza shops, tuck shops, and forecourts, highlighting the role of nearby, easily accessible retail outlets in shaping daily consumption habits. To meet these evolving demands, brands are focusing on offering smaller pack sizes, placing products at checkout counters for visibility, and expanding their distribution networks to include informal and neighborhood stores.
Growth in domestic tourism is stimulating demand for locally produced confectionery
Domestic tourism and inbound travel are driving increased demand for locally produced premium confectionery in South Africa. According to the Parliamentary Monitoring Group, international visitor arrivals reached 2.4 million in the first quarter of 2024[2]Source: Parliamentary Monitoring Group, "SA Tourism Q4 2023/24 Performance And Q1 2024/25 Performance", pmg.org.za. This rise in tourism has boosted foot traffic and spending in popular tourist areas such as the Western Cape wine routes and Gauteng’s Sandton precinct. Tourists are showing a growing preference for high-quality, giftable confectionery items, which has benefited local brands. For example, Wedgewood Nougat has seen strong sales of its boxed assortments in tourist-focused stores, while Honest Chocolate’s bean-to-bar slabs are sold at a 30- to 50% price premium in airports and travel retail outlets. Visitors are particularly drawn to authentic South African products that they can enjoy during their trip or take home as souvenirs. This trend has created significant opportunities for local confectionery brands to generate high-value sales in travel, leisure, and hospitality locations, where demand for premium and unique products remains strong.
Celebrity and influencer endorsements shaping brand perception
Using influencers to build brands is becoming a key strategy in South Africa’s confectionery market. Brands are increasingly collaborating with local influencers who resonate with the culture and lifestyle of their target audience. This approach enables them to connect with an increasing number of digital consumers. As of 2023, 78.6% of South Africans have internet access, according to the Department of Communications and Digital Technologies, providing a broad platform for social media and influencer-driven campaigns[3]Source: Department of Communications and Digital Technologies, "South Africa’s Communications And Digital Technology Infrastructure", dcdt.gov.za. For example, Cadbury’s “Real Mzansi Names” campaign, created in collaboration with a linguistics expert, successfully appealed to Black South African consumers by celebrating authentic local identities. This campaign demonstrated that consumers value relatable and culturally relevant content over traditional celebrity endorsements. By focusing on authenticity, confectionery brands are fostering stronger connections with their audience, encouraging loyalty, and driving repeat purchases.
Growing interest in premium gifting during festive seasons
During festive seasons, a growing trend is emerging of using premium confectionery as gifts, driving higher-value sales in South Africa’s confectionery market. Chocolates and sweets are becoming increasingly popular as socially acceptable and shareable gifts for occasions such as Eid, Diwali, Christmas, Valentine’s Day, and corporate events. Consumers, particularly those in middle-income and affluent groups, are shifting away from loose candies and opting for more sophisticated options, such as boxed chocolates, novelty packs, and premium assortments. These assortments may include imported products or locally crafted items that offer a sense of luxury and emotional appeal. Retailers are responding to this trend by introducing seasonal displays, curated gift hampers, and limited-edition packaging to attract customers during these festive periods. These efforts encourage higher spending per transaction.
Restraints Impact Analysis*
| Restraint | (~) % Impact on CAGR Forecast | Geographic Relevance | Impact Timeline |
|---|---|---|---|
| Rising health concerns around sugar intake and obesity | -1.0% | National, most acute in urban metros with higher health literacy | Long term (≥ 4 years) |
| Logistical challenges in rural and remote areas | -0.6% | Eastern Cape, Limpopo, Northern Cape rural municipalities | Medium term (2-4 years) |
| High competition from snack substitutes | -0.5% | National, intensifying in supermarket impulse zones | Short term (≤ 2 years) |
| Strict labelling and sugar-tax regulations | -0.8% | National, compliance costs highest for small and medium-sized enterprises | Medium term (2-4 years) |
| Source: Mordor Intelligence | |||
Rising health concerns around sugar intake and obesity
Health concerns about sugar consumption and obesity are increasingly affecting the growth of South Africa’s confectionery market. Consumers are becoming increasingly aware of the potential health risks associated with frequent consumption of high-sugar products. Public health campaigns and stricter nutritional labeling have raised awareness about the connection between excessive sugar intake and issues like diabetes and obesity. This has led many consumers, especially those in urban areas and middle-income groups, to reduce their purchases of traditional candies and chocolates. Instead, they are opting for snacks that are perceived as healthier, such as reduced-sugar options, smaller portions, or alternative products. To adapt to these changing preferences, manufacturers are under pressure to reformulate their products, introduce smaller portion sizes, or develop healthier variants. However, these adjustments often increase production costs and slow down the growth of traditional confectionery categories.
Strict labelling and sugar-tax regulations
South Africa’s confectionery manufacturers are facing growing challenges due to strict labeling and sugar-tax regulations, which are driving up production costs and limiting their ability to adjust prices. The Health Promotion Levy, a tax on sugar-sweetened products, along with mandatory front-of-pack nutrition labels, has increased scrutiny on high-sugar confectionery products. These regulations aim to reduce sugar consumption, making it harder for manufacturers to pass on price increases, especially to cost-conscious consumers. To adapt, companies are being forced to reformulate their products to lower sugar content, redesign packaging to meet compliance standards, and adjust their marketing strategies to align with regulatory requirements. These efforts not only increase operational costs but also slow down the introduction of new products to the market. As a result, profit margins in the mainstream confectionery segment are under pressure, and manufacturers must find innovative ways to balance compliance with consumer demand.
*Our forecasts treat driver/restraint impacts as directional, not additive. The impact forecasts reflect baseline growth, mix effects, and variable interactions.
Segment Analysis
Chocolate Segment in South African Confectionery Market
Chocolate remains the leading category in South Africa’s confectionery market, accounting for 52.76% of total revenue in 2025. This strong performance is driven by well-established brands like Cadbury, KitKat, and Lindt, which enjoy widespread popularity and availability across supermarkets, convenience stores, and informal retail outlets. Chocolate products are a popular choice for gifting and impulse purchases, especially during festive seasons and special occasions. Additionally, the introduction of premium options, innovative flavors, and limited-edition packaging continues to attract consumers and boost sales in this segment.
Snack bars are expected to be the fastest-growing product category in the market, with a projected CAGR of 10.54% through 2031. This growth reflects a shift in consumer preferences toward healthier and more functional snacks that offer nutritional benefits, such as protein, fiber, and energy. Snack bars that combine indulgent flavors with ingredients like chocolate and nuts are gaining popularity. These products are gaining shelf space in grocery stores and forecourt retail outlets, as they cater to the growing demand for convenient, on-the-go snacking options. As a result, snack bars are gradually replacing traditional sweets for everyday consumption.


By Packaging Type: Single-Serve Commands Sales, Multipacks Scale Up
In 2025, single-serve packs accounted for 66.73% of confectionery sales, underscoring their popularity for quick, on-the-go consumption. These small, affordable packs are ideal for busy consumers who prefer convenient snacking options. They are especially popular in high-traffic areas, such as taxis, campuses, and forecourts. Their strategic placement at checkout counters and availability in spaza shops make them a key driver of sales, catering to impulse purchases and everyday snacking needs.
On the other hand, multipacks are expected to grow at a compound annual growth rate (CAGR) of 9.25% through 2031, as more households focus on saving money by reducing the cost per unit. Promotions on bulk purchases in supermarkets and free delivery offers on e-commerce platforms are making larger packs more appealing. These packs are particularly favored by families and frequent buyers, shifting some spending from impulse purchases to planned, cost-effective buying. Despite this shift, overall confectionery consumption remains steady, as consumers balance convenience with value.
By Price Range: Mass Market Dominates, Premium Upgrades Value
In 2025, mass-market confectionery accounted for 83.89% of total sales, indicating that most consumers in South Africa prefer affordable options for everyday snacking. Products priced below R20 are especially popular, as they cater to price-sensitive buyers. These low-cost items are sold in high volumes across supermarkets, spaza shops, and convenience stores, where frequent, small purchases are the norm. The widespread availability of these products, combined with promotional pricing strategies, has solidified the mass-market segment's leading position in the confectionery market.
On the other hand, the premium confectionery segment is expected to grow at a compound annual growth rate (CAGR) of 10.77% through 2031. This growth is driven by increasing disposable incomes among urban and middle-class consumers, who are willing to spend more on high-quality products. Premium offerings, such as those with ethical sourcing, unique packaging, and compelling origin stories, are particularly appealing during festive seasons and for gifting purposes. Brands are capitalizing on this trend by introducing limited-edition products, artisanal options, and gift-oriented assortments, which allow them to achieve higher profit margins.
By Distribution Channel: Supermarkets Lead, Online Outpaces All
Supermarkets and hypermarkets accounted for 51.48% of confectionery distribution in 2025, underscoring their widespread presence and ability to effectively showcase leading brands. These large retail formats are the go-to choice for both planned purchases and impulse buys, such as chocolates. Attractive promotions, multipack options, and a wide variety of products drive their success. Additionally, their efficient supply chains and extensive reach make them a dominant force in South Africa’s confectionery market.
On the other hand, online retail is expected to grow at a compound annual growth rate (CAGR) of 11.42% through 2031, making it the fastest-growing distribution channel. The rise of mobile apps, digital promotions, and fast delivery services has made buying confectionery online more convenient. Consumers are increasingly adding chocolates and snack bars to their quick online grocery orders. This shift is helping e-commerce platforms capture a larger share of everyday confectionery spending, as digital platforms cater to the growing demand for convenience.
Geography Analysis
Gauteng and the Western Cape are the leading regions driving South Africa’s confectionery market, due to their dense urban populations, higher income levels, and advanced retail and delivery infrastructure. In Gauteng, consumers frequently shop and use quick-commerce apps, which has increased the demand for both everyday snacks and premium chocolates. The Western Cape benefits from its strong tourism industry and vibrant food culture, as visitors often purchase locally made or artisanal confectionery as gifts or souvenirs. These factors make these regions crucial for confectionery brands seeking to expand their market share.
KwaZulu-Natal also plays a significant role in the confectionery market, particularly in its coastal cities and tourist hotspots, where impulse buying is prevalent. The province has efficient product inflows and distribution networks, which allow a wide variety of imported and novelty confectionery products to reach retail shelves. This accessibility makes KwaZulu-Natal a key region for confectionery sales. Together with Gauteng and the Western Cape, these three regions account for the majority of national sales and attract significant investments, innovations, and retail activities from confectionery brands.
On the other hand, rural and less-developed provinces face significant challenges in accessing confectionery products due to poor logistics, high distribution costs, and limited cold-chain infrastructure. These issues particularly impact the availability of chocolates and premium items, which require careful handling and temperature control. Although manufacturers and distributors are gradually expanding their reach into general trade and township retail, these areas still lag behind urban regions. This creates a noticeable gap in access and affordability, resulting in a two-tiered confectionery market across South Africa.
Competitive Landscape
The South Africa confectionery market is dominated by a few large multinational and domestic companies, making it highly consolidated. Major players, including Mondelēz, Nestlé, Mars, Ferrero, and Tiger Brands, control a significant portion of the market through their robust distribution networks, effective branding strategies, and extensive retail presence. Their dominance in supermarkets, convenience stores, and general trade creates significant challenges for smaller brands to secure shelf space or achieve nationwide reach. This consolidation limits competition but ensures widespread availability of products from these leading companies.
These key players compete by leveraging their brand strength, cultural relevance, and diverse product portfolios. Tiger Brands uses its strong local presence and merchandising capabilities to maintain its leadership in sales volume. Mondelēz focuses on culturally tailored marketing to retain customer loyalty for its Cadbury brand, even as private labels grow in popularity. Global companies like Mars and Ferrero expand their market share through acquisitions, new product launches, and offering a variety of products across categories such as chocolates, gums, and snack bars. This approach helps them stay competitive and meet diverse consumer preferences.
Despite the dominance of large companies, there are still opportunities for growth and innovation in the market. Areas like heat-resistant chocolate, rural distribution networks, and digital gifting remain underdeveloped, offering potential for investment. Smaller artisanal and premium brands are gaining visibility through social media and niche retail outlets, though they often lack the scale to expand nationally. These brands could become acquisition targets for larger companies. Additionally, the rise of online and rapid-delivery channels is shifting competition toward faster service, stronger digital presence, and the ability to convert impulse purchases into premium sales.
South Africa Confectionery Industry Leaders
-
Tiger Brands Ltd
-
Mondelēz International Inc.
-
Nestlé SA
-
Ferrero International SA
-
Mars Inc.
- *Disclaimer: Major Players sorted in no particular order

Recent Industry Developments
- June 2025: Danone introduced its new UltraMel Delight dessert to the South African market. The product had undergone extensive consumer testing, consistently receiving high ratings across various attributes, including taste, texture, and overall satisfaction.
- February 2025: Nestlé SA launched its new KitKat Tablets across South Africa, Canada, and Europe. This product expansion marked a strategic move by the company to cater to evolving consumer preferences in these regions.
- May 2024: In2food launched Smul, a new product line featuring a variety of nutritious snacks and plant-based options. The range included protein bars, whole grain granolas, and rice cakes, all designed to cater to the growing demand for convenient and healthy eating solutions.
- April 2024: Fulfil Chocolate Protein Bars were introduced to the South African market. Known for their high protein content and indulgent chocolate flavor, these bars cater to health-conscious individuals seeking convenient snack options.


South Africa Confectionery Market Report Scope
The South African confectionery market encompasses the sale and consumption of chocolate, sugar confectionery, and snack sweets across both retail and on-the-go channels within South Africa. The South African confectionery market is segmented by product type, packaging type, price range, and distribution channel. Based on product type, the market is segmented into chocolate, sugar confectionery, snack bars, and gums. Based on packaging type, the market is segmented into single-serve and multipacks. Based on the price range, the market is classified into mass and premium segments. Based on distribution channel, the market is classified into supermarkets/hypermarkets, online retail stores, convenience stores, and other channels. The market forecasts are provided in terms of value (USD) and volume (Tons).
| Chocolate | Dark Chocolate | |
| Milk and White Chocolate | ||
| Sugar Confectionery | Hard Candy | |
| Mints | ||
| Pastilles, Gummies, and Jellies | ||
| Toffees and Nougats | ||
| Lollipops | ||
| Other | ||
| Snack Bar | Cereal Bar | |
| Energy Bar | ||
| Protein Bar | ||
| Fruit and Nut Bar | ||
| Gums | Chewing Gum | Sugar Chewing Gum |
| Sugar-Free Chewing Gum | ||
| Bubble Gum | ||
| Single-Serve |
| Multipacks |
| Mass |
| Premium |
| Supermarkets/Hypermarkets |
| Online Retail Stores |
| Convenience Stores |
| Other Channels |
| By Product Type | Chocolate | Dark Chocolate | |
| Milk and White Chocolate | |||
| Sugar Confectionery | Hard Candy | ||
| Mints | |||
| Pastilles, Gummies, and Jellies | |||
| Toffees and Nougats | |||
| Lollipops | |||
| Other | |||
| Snack Bar | Cereal Bar | ||
| Energy Bar | |||
| Protein Bar | |||
| Fruit and Nut Bar | |||
| Gums | Chewing Gum | Sugar Chewing Gum | |
| Sugar-Free Chewing Gum | |||
| Bubble Gum | |||
| By Packaging Type | Single-Serve | ||
| Multipacks | |||
| By Price Range | Mass | ||
| Premium | |||
| By Distribution Channel | Supermarkets/Hypermarkets | ||
| Online Retail Stores | |||
| Convenience Stores | |||
| Other Channels | |||


Market Definition
- Milk and White Chocolate - Milk chocolates is a solid chocolate made with milk (in the form of either milk powder, liquid milk, or condensed milk) and cocoa solids. White chocolate is made from cocoa butter and milk and contains no cocoa solids whatsoever. The scope includes regular chocolates, low-sugar, and sugar-free variants
- Toffees & Nougats - Toffees include hard, chewy, and small or one-bite candies marketed with labels as toffee or toffee-like confectionery. Nougat is a chewy confection with almond, sugar, and egg white as a basic ingredient; and it originated in Europe and Middle East countries.
- Cereals Bars - A snack composed of breakfast cereal that has been compressed into a bar shape and is held together with a form of edible adhesive. The scope includes snack bars made with cereals such as rice, oats, corn, etc. mixed with a binding syrup. These also include products labeled as cereal bars, cereal treat bars, or grain bars.
- Chewing Gum - This is a preparation for chewing, usually made of flavored and sweetened chicle or such substitutes as polyvinyl acetate. The types of chewing gums included in the scope are sugar-chewing gums and sugar-free chewing gums
| Keyword | Definition |
|---|---|
| Dark Chocolate | Dark chocolate is a form of chocolate containing cocoa solids and cocoa butter without the milk. |
| White Chocolate | White chocolate is the type of chocolate containing the highest percentage of milk solids, typically around or over 30 percent. |
| Milk Chocolate | Milk chocolate is made from dark chocolate that has a low cocoa solid content and higher sugar content, plus a milk product. |
| Hard Candy | A candy made of sugar and corn syrup boiled without crystallizing. |
| Toffees | A hard, chewy, often brown sweet that is made from sugar boiled with butter. |
| Nougats | A chewy or brittle candy containing almonds or other nuts and sometimes fruit. |
| Cereal bar | A cereal bar is a bar-shaped food product, made by pressing cereals and usually dried fruit or berries, which are in most cases held together by glucose syrup. |
| Protein bar | Protein bars are nutrition bars that contain a high proportion of protein to carbohydrates/fats. |
| Fruit & Nut bar | These are often based on dates with other dried fruit and nut additions and, in some cases, flavorings. |
| NCA | The National Confectioners Association is an American trade organization that promotes chocolate, candy, gum and mints, and the companies that make these treats. |
| CGMP | Current good manufacturing practices are those conforming to the guidelines recommended by relevant agencies. |
| Unstandardized foods | Unstandardized foods are those that do not have a standard of identity or that deviate from a prescribed standard in any manner. |
| GI | The glycemic index (GI) is a way of ranking carbohydrate-containing foods based on how slowly or quickly they are digested and increase blood glucose levels over a period of time |
| Skimmed milk powder | Skimmed milk powder is obtained by removing water from pasteurized skim milk by spray-drying. |
| Flavanols | Flavanols are a group of compounds found in cocoa, tea, apples, and many other plant-based foods and beverages. |
| WPC | Whey protein concentrate- the substance obtained by the removal of sufficient nonprotein constituents from pasteurized whey so that the finished dry product contains greater than 25% protein. |
| LDL | Low density Lipoprotein- the bad cholesterol |
| HDL | High density Lipoprotein- the good cholesterol |
| BHT | butylated Hydroxytoluene is a lab-made chemical that is added to foods as a preservative. |
| Carrageenan | Carrageenan is an additive used to thicken, emulsify, and preserve foods and drinks. |
| Free form | Not containing certain ingredients, such as gluten, dairy, or sugar. |
| Cocoa butter | It is a fatty substance obtained from cocoa beans, used in the manufacture of confectionery. |
| Pastellies | A type of of Brazilian candy made from sugar, eggs, and milk. |
| Draggees | Small, round candies that are coated with a hard sugar shell |
| CHOPRABISCO | Royal Belgian Association of the chocolate, pralines, biscuit, and confectionery industry- A trade association that represents the Belgian chocolate industry. |
| European Directive 2000/13 | A European Union directive that regulates the labeling of food products |
| Kakao-Verordnung | The German chocolate ordinance, a set of regulations that define what can be labeled as "chocolate" in Germany. |
| FASFC | Federal Agency for the Safety of the Food Chain |
| Pectin | A natural substance that is derived from fruits and vegetables. It is used in confectionery to create a gel-like texture. |
| Invert sugars | A type of sugar that is made up of glucose and fructose. |
| Emulsifier | A substance that helps to mix to liquids that does not mix together. |
| Anthocyanins | A type of flavonoid that is responsible for the red, purple, and blue colors of confectionery. |
| Functional Foods | Foods that have been modified to provide additional health benefits beyond basic nutrition. |
| Kosher certificate | This certification verifies that the ingredients, production process including all machinery, and/or food-service process complies with the standards of Jewish dietary law |
| Chicory root extract | A natural extract from the chicory root that is a good source of fiber, calcium, phosphorous, and folate |
| RDD | Recommended daily dose |
| Gummies | A chewy gelatin-based candy that is often flavored with fruit. |
| Nutraceuticals | Food or dietary supplements that are claimed to have health benefits. |
| Energy bars | Snack bars that are high in carbohydrates and calories are designed to provide energy on the go. |
| BFSO | Belgian Food Safety Organization for the food chain. |


Research Methodology
Mordor Intelligence follows a four-step methodology in all our reports.
- Step-1: Identify Key Variables: In order to build a robust forecasting methodology, the variables and factors identified in Step 1 are tested against available historical market numbers. Through an iterative process, the variables required for market forecast are set, and the model is built on the basis of these variables.
- Step-2: Build a Market Model: Market-size estimations for the forecast years are in nominal terms. Inflation is not a part of the pricing, and the average selling price (ASP) is kept constant throughout the forecast period for each country.
- Step-3: Validate and Finalize: In this important step, all market numbers, variables, and analyst calls are validated through an extensive network of primary research experts from the market studied. The respondents are selected across levels and functions to generate a holistic picture of the market studied.
- Step-4: Research Outputs: Syndicated Reports, Custom Consulting Assignments, Databases & Subscription Platforms


