Advanced Visualization Market Size and Share
Market Overview
| Study Period | 2020 - 2031 |
|---|---|
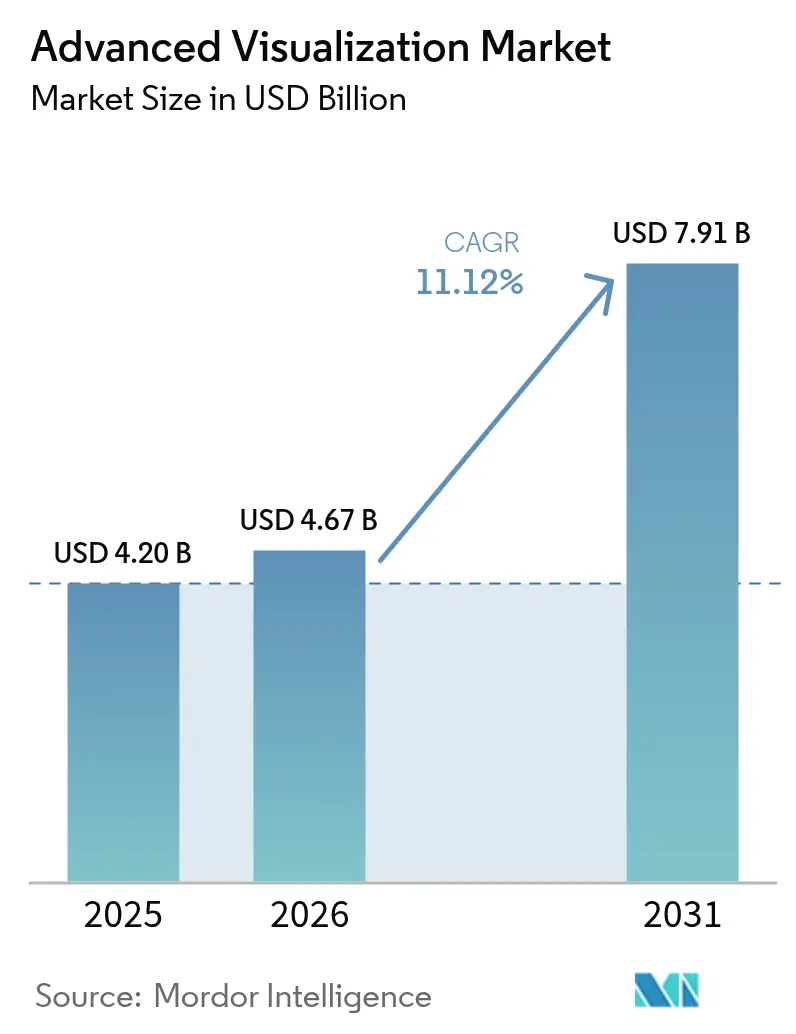
| Market Size (2026) | USD 4.67 Billion |
| Market Size (2031) | USD 7.91 Billion |
| Growth Rate (2026 - 2031) | 11.12% CAGR |
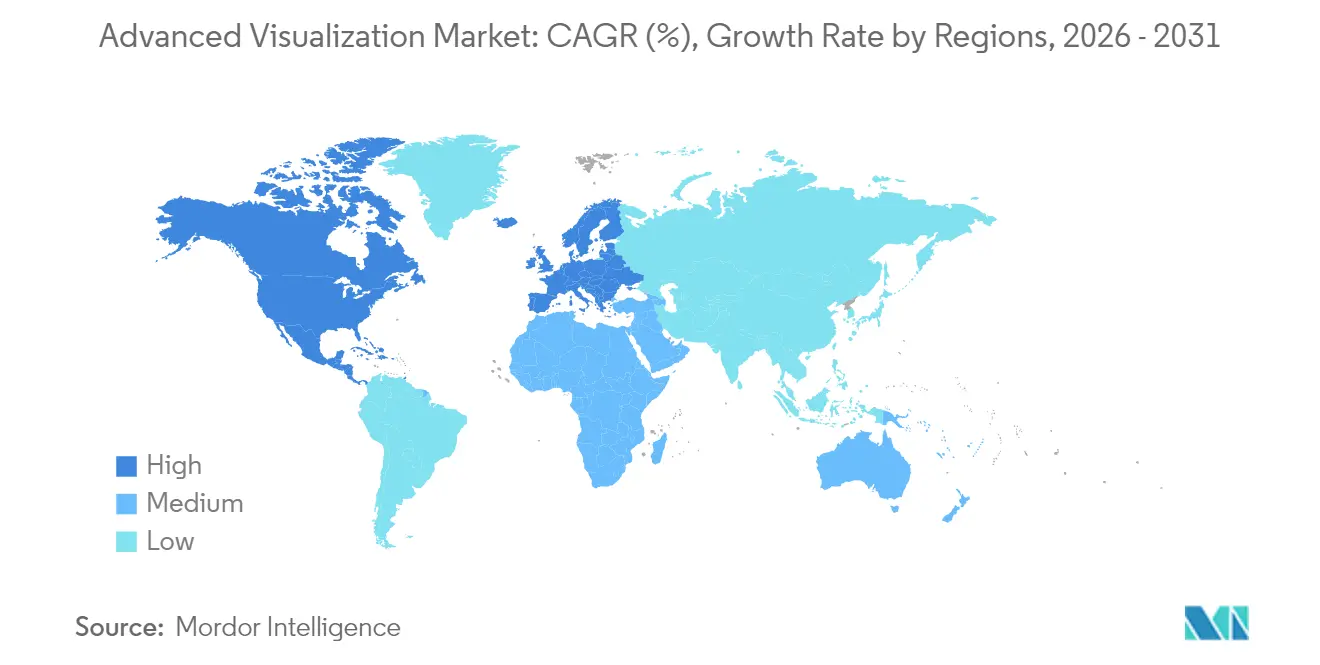
| Fastest Growing Market | Asia Pacific |
| Largest Market | North America |
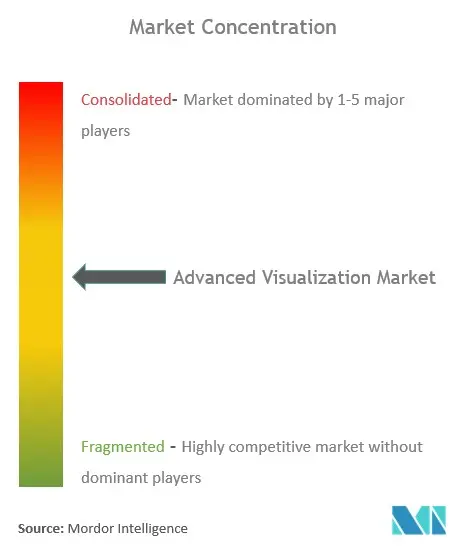
| Market Concentration | Medium |
Major Players *Disclaimer: Major Players sorted in no particular order Image © Mordor Intelligence. Reuse requires attribution under CC BY 4.0. | |
Advanced Visualization Market Analysis by Mordor Intelligence
Advanced visualization market size in 2026 is estimated at USD 4.67 billion, growing from 2025 value of USD 4.20 billion with 2031 projections showing USD 7.91 billion, growing at 11.12% CAGR over 2026-2031. Strong demand for AI-powered imaging software, photon-counting CT scanners and cloud-enabled enterprise platforms continues to accelerate capital spending among hospitals and diagnostic centers. In clinical practice, AI auto-segmentation cuts radiology reading time by over 40%, photon-counting CT delivers sub-0.2 mm resolution at lower dose, and new CPT codes for quantitative brain and cardiovascular imaging are unlocking fresh reimbursement streams. Large-scale enterprise PACS/VNA rollouts are fostering multi-site collaboration, while secure-cloud deployments gain traction despite strict data-sovereignty rules in Europe. Competitive intensity is rising as device manufacturers pair with GPU vendors to embed real-time AI into scanners, and service contracts shift revenue away from one-off system sales toward recurring, subscription-based models.
Key Report Takeaways
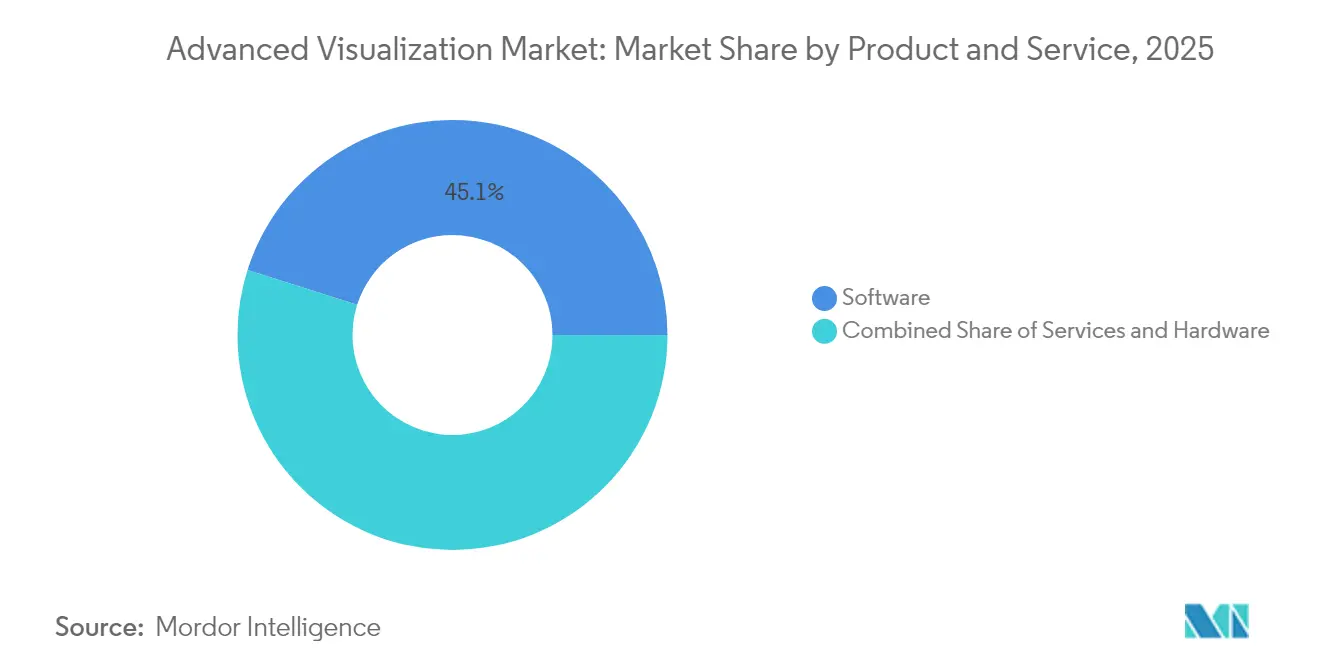
- By product & service, software led with 45.12% of advanced visualization market share in 2025; services are projected to expand at a 12.74% CAGR through 2031.
- By solution type, enterprise platforms controlled 53.60% revenue in 2025, while standalone tools are poised for the quickest growth at 12.05% CAGR to 2031.
- By deployment model, on-premise installations held 52.20% of the advanced visualization market size in 2025, whereas cloud-based deployments are advancing at 12.42% CAGR to 2031.
- By imaging modality, MRI dominated with 61.70% share of the advanced visualization market size in 2025, yet CT is on course for the fastest expansion at 12.55% CAGR through 2031.
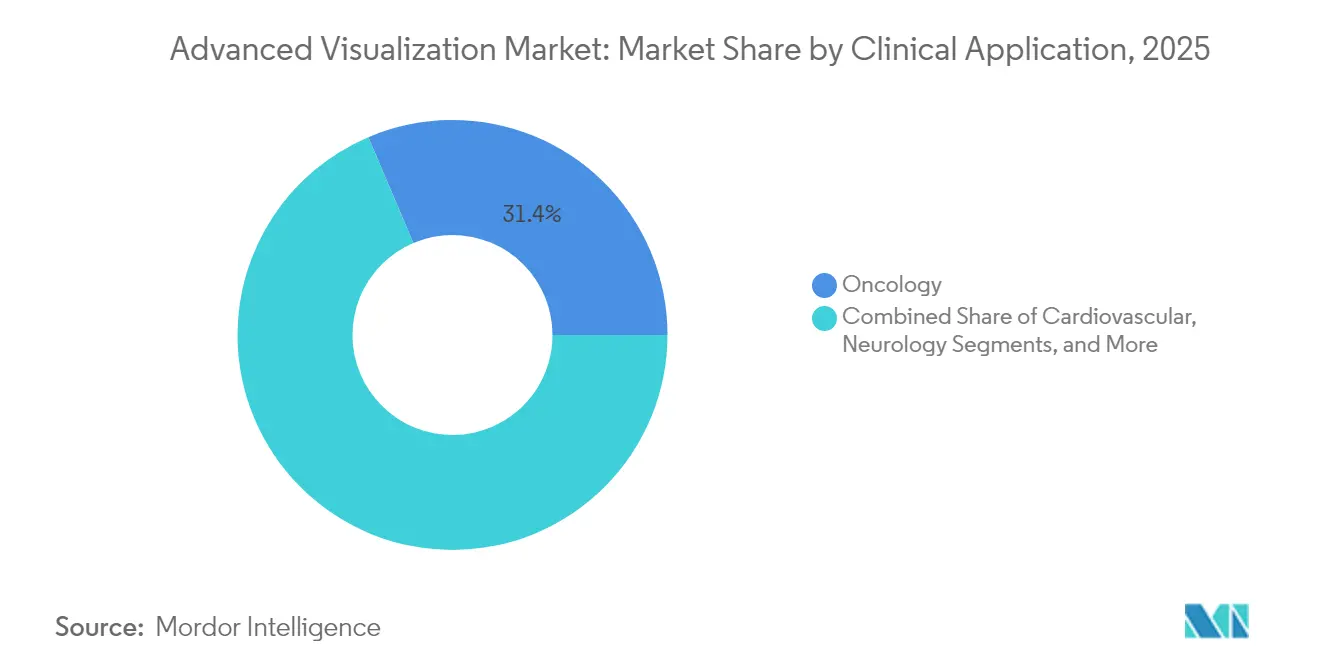
- By clinical application, oncology commanded 31.40% revenue in 2025; cardiovascular imaging registers the highest growth outlook at 12.78% CAGR to 2031.
- By end user, hospitals represented 47.60% of total spending in 2025, while diagnostic imaging centers are forecast to grow at 13.02% CAGR to 2031.
Note: Market size and forecast figures in this report are generated using Mordor Intelligence’s proprietary estimation framework, updated with the latest available data and insights as of 2026.
Global Advanced Visualization Market Trends and Insights
Drivers Impact Analysis*
| Driver | (~) % Impact on CAGR Forecast | Geographic Relevance | Impact Timeline |
|---|---|---|---|
| AI-powered auto-segmentation cuts reading time by >40% | +2.8% | Global, with early adoption in North America & EU | Short term (≤ 2 years) |
| Integration of AV into enterprise PACS/VNA ecosystems | +2.1% | North America & EU core, spill-over to APAC | Medium term (2-4 years) |
| Reimbursement expansion for quantitative imaging CPT codes | +1.9% | US primarily, gradual expansion to other developed markets | Medium term (2-4 years) |
| Vendor-neutral cloud platforms enable multi-site collaboration | +1.7% | Global, with regulatory variations in EU | Long term (≥ 4 years) |
| Photon-counting CT & spectral MRI drive 4-D visualization demand | +1.5% | Advanced healthcare markets, led by US, Germany, Japan | Long term (≥ 4 years) |
| In-scanner decision-support for interventional suites | +1.3% | Major medical centers globally | Medium term (2-4 years) |
| Source: Mordor Intelligence | |||
AI-Powered Auto-Segmentation Transforms Diagnostic Efficiency
Federal clearance of more than 1,000 clinical AI applications—77% for radiology—has legitimized workflow automation, enabling platforms like Canon Medical INSTINX to remove 40% of cardiac-CT workflow clicks and Philips SmartSpeed Precise to finish MRI scans three-times faster with 80% sharper images. These productivity gains help offset a radiologist vacancy rate of 18.1% that professional bodies project will persist well beyond 2030. In interventional suites, real-time segmentation now guides carotid stenting with 94% recall accuracy, broadening AI value from diagnostics into therapy planning.
Enterprise PACS Integration Drives Operational Consolidation
Record order bookings above SEK 4 billion for Sectra’s cloud enterprise imaging suite underscore health-system appetite for unified architectures that eradicate data silos and standardize workflow across radiology, cardiology and pathology departments. Cloud-native PACS rollouts such as PACSonWEB have lifted cross-hospital referrals by 10% within 12 months because physicians can view images anywhere, anytime. Subscription pricing is overtaking perpetual licenses, lowering capital outlays and aligning vendor incentives with uptime and cybersecurity performance guarantees.
Reimbursement Expansion Validates Quantitative Imaging Value
Effective January 2025, CMS doubled hospital payment for coronary CTA—from USD 175 to USD 357.13—citing resource intensity and clinical benefit, a decision expected to accelerate national CCTA volumes already rising 20% annually [1]Jessica Frizen, “U.S. CMS agrees to double reimbursement for cardiovascular CT services,” scct.org. New Category I codes 0865T / 0866T formalize payment for AI-based brain-MRI volumetrics, encouraging dementia and multiple-sclerosis programs to adopt advanced analytics. Similar policy momentum underpins CPT add-on values over USD 950 for AI coronary plaque analysis, reinforcing a revenue case for AI across modalities [2]Centers for Medicare & Medicaid Services, “AI-Enabled CT Plaque Analysis LCD L39912,” cms.gov.
Photon-Counting CT Enables Next-Generation Spectral Imaging
The Siemens NAEOTOM Alpha photon-counting CT delivers 0.2 mm slices while reducing dose up to 45%, providing intrinsic spectral data without dual scans. Comparative studies confirm superior contrast-to-noise ratios in coronary imaging and comparable cost effectiveness to invasive angiography because clearer visualization reduces diagnostic ambiguity. With an additional €80 million factory expansion and a pledge to scan 1 billion patients this decade, Siemens aims to mainstream the technology globally.
Restraints Impact Analysis*
| Restraint | ( ~ ) % Impact on CAGR Forecast | Geographic Relevance | Impact Timeline |
|---|---|---|---|
| Patchy reimbursement outside US & Japan | –1.8% | Emerging markets; parts of EU | Medium term (2-4 years) |
| Data-privacy rules slowing cloud roll-outs in EU | –1.2% | European Union; global compliance spill-over | Short term (≤ 2 years) |
| Ongoing shortage of imaging-IT staff | –1.0% | Worldwide; acute in North America & EU | Long term (≥ 4 years) |
| GPU supply-chain volatility raises vendor TCO | –0.8% | Global; fabrication concentrated in Asia | Medium term (2-4 years) |
| Source: Mordor Intelligence | |||
Data-Privacy Regulations Create Cloud Barriers
GDPR clauses that tie encryption-key sovereignty to national boundaries force cloud PACS vendors to deploy elaborate key-management infrastructure, elevating deployment cost and lengthening sales cycles in Europe. Cyber incidents targeting radiology grew 67% in 2024, intensifying buyer scrutiny over public-cloud risk profiles and nudging hospitals toward hybrid architectures that keep patient identifiers on-premise while pushing de-identified images into the cloud for AI inference [3]Brian Casey & Erik Ridley, “Photon-counting CT scanner highlights new Siemens products,” auntminnie.com.
Healthcare IT Staffing Shortages Constrain Adoption
Radiologist supply trails imaging demand by at least 17% across high-income economies, with attrition post-COVID doubling to 3% and technologist vacancies touching 18%. To mitigate bottlenecks, systems such as US Radiology Specialists created technologist academies, but training pipelines cannot fully replace retiring staff before 2030. Limited IT bandwidth often delays optimization of feature-rich visualization suites, capping throughput gains from new hardware.
*Our forecasts treat driver/restraint impacts as directional, not additive. The impact forecasts reflect baseline growth, mix effects, and variable interactions.
Segment Analysis
By Product & Service: Software Extends Digital Footprint
Software solutions contributed 45.12% to overall 2025 revenue, equivalent to roughly USD 1.89 billion of advanced visualization market size, due to accelerating adoption of AI analytics that automate segmentation, perfusion mapping and structured reporting. Subscription-based upgrades deliver continuous algorithm refreshes, cementing retention rates above 95%. Hardware revenues remain sizable because photon-counting CT and 3-Tesla MR systems require specialized GPUs and detector arrays, yet the value narrative is shifting toward software-defined imaging where clinical improvements come through code instead of tubes and gantries. Services out-paced every other category with a 12.74% growth outlook as providers outsource post-processing, cybersecurity and uptime guarantees to managed-service contracts.
The broader advanced visualization industry is embracing cloud orchestration that allows thin-client access across busy emergency departments, collapsing installation cycles from months to weeks. Vendor roadmaps now prioritize API-rich platforms so third-party AI developers can plug-in novel algorithms without disrupting workflow, enhancing return on earlier hardware purchases. As oncology and cardiology programs roll out dedicated AI bundles, software billing is moving to exam-based pricing that aligns vendor revenue with clinical volume.


By Solution Type: Enterprise Platforms Anchor Consolidation
Enterprise platforms captured 53.60% share in 2025 as health networks favor single worklist, single viewer implementations that cover radiology, cardiology and even digital pathology. These integrated hubs are poised to keep expanding because multi-hospital purchasing groups stipulate vendor-neutral archives and zero-footprint viewers to harmonize standards. Standalone AI applications nevertheless post a 12.05% CAGR by targeting unmet micro-workflows—such as spine fracture detection—that large suites integrate only slowly.
An enterprise sale often bundles photon-counting CT licenses, oncology auto-contouring and cloud disaster-recovery into a seven-year opex contract, increasing switching costs and entrenching brand loyalty. For niche developers, distribution through marketplace app-stores embedded in leading platforms offers reach without heavy field-sales overheads, broadening the advanced visualization market addressable by smaller firms.
By Deployment Model: Hybrid Strategies Bridge Compliance Gaps
On-premise installs preserved a slight majority at 52.20% because data-sovereignty mandates oblige EU providers to retain primary studies inside national borders. Conversely, cloud subscriptions log the strongest 12.42% CAGR thanks to elastic GPU scaling that cuts inference time for complex 3-D reconstructions. Hybrid topologies—local private clouds paired with public-cloud AI inference—emerge as the dominant architecture for multinational hospital groups balancing legal obligations with performance.
Platform vendors now offer sovereign-cloud zones with customer-held encryption keys to satisfy GDPR while still delivering AI services from centralized data centers. This compromise positions the advanced visualization market for accelerated adoption once regulators gain confidence that patient identifiers remain firewalled.
By Imaging Modality: CT Innovation Narrows MRI Lead
MRI retained a 61.70% contribution to advanced visualization market share in 2025, but CT’s photon-counting leap has set a 12.55% CAGR trajectory that could realign modality economics by 2031. The NAEOTOM Alpha’s Quantum HD detector offers 0.11 mm spatial resolution, producing coronary images that rival invasive angiography without calcium blooming artifacts. Ultrasound maintains relevance through handheld devices incorporating AI noise-reduction that enable point-of-care triage in emergency settings. Nuclear medicine, buoyed by FDA clearance of digital PET, delivers precision in theranostics but remains niche by revenue.
Continual MRI gains come from deep-learning reconstruction that slashes scan time, making the modality more throughput-friendly for stretched radiology departments. Yet hospitals weighing capital budgets increasingly benchmark CT innovations that promise faster ROI and broader referral bases, illustrating how modality mix will influence future advanced visualization market dynamics.
By Clinical Application: Oncology Remains Cornerstone
Oncology’s 31.40% revenue share reflects reliance on multiphase CT, diffusion-weighted MRI and hybrid PET/CT for staging and response assessment. AI-powered risk stratification platforms such as Clairity BREAST predict five-year breast-cancer risk from routine mammography, underscoring how visualization feeds preventative medicine. Cardiovascular imaging, the fastest climber at 12.78% CAGR, benefits directly from CMS reimbursement gains and from spectral CT’s aptitude for quantifying non-calcified plaque burdens. Neurology leverages volumetric MRI biomarkers for dementia trials, while orthopedic practices adopt photon-counting CT to diagnose occult fractures.
Inflows to oncology AI marketplaces are spurring algorithm validation for radiogenomic signatures, which could raise per-exam software licensing. Such cross-pollination supports long-term growth in the advanced visualization industry as clinical specialties converge on shared, AI-ready datasets.
By End User: Hospitals Dominate Capex, Imaging Centers Scale Faster
Hospitals committed nearly half of 2025 spending, drawn to enterprise-wide contracts that integrate surgical planning, intra-operative navigation and interventional guidance. Many academic centers embed visualization analytics into clinical trials, reinforcing volume and evidence generation. Independent diagnostic imaging centers, expanding at 13.02% CAGR, exploit nimble cloud PACS rollouts to attract referring physicians seeking same-day reports. Their volume-driven model welcomes AI as a throughput enhancer, enabling differential pricing versus hospital outpatient departments.
Industry leaders structure seven-year managed-service deals that guarantee uptime and cybersecurity, aligning with hospital CFO preference for predictable opex. Meanwhile boutiques pivoting around AI-enabled coronary CT or low-dose lung screening intensify competitive pressure in suburban markets, broadening the advanced visualization market footprint without large building projects.
Geography Analysis
North America commanded 42.70% revenue in 2025, underpinned by dense modality install bases, earliest AI 510(k) clearances and CMS payment reforms that now reimburse coronary CTA at USD 357.13 per exam. Academic-industry partnerships—exemplified by GE HealthCare and NVIDIA’s work on autonomous scanning—continue to incubate algorithms later deployed worldwide. Ongoing staff shortages create tailwinds for productivity software as radiology groups seek to meet rising demand.
Asia-Pacific registers the steepest 13.10% CAGR as Japan, Australia and South Korea upgrade to photon-counting CT while populous countries such as India deploy affordable cloud PACS to extend tertiary-level diagnostics into tier-II cities. GE HealthCare’s acquisition of Nihon Medi-Physics underscores regional interest in molecular imaging supply chains that complement visualization platforms. National AI governance frameworks in Singapore and South Korea streamline regulatory paths, encouraging local startups to integrate into international device ecosystems.
Europe posts moderate gains amid complex GDPR compliance. Vendors able to guarantee encryption-key residency within EU borders gain competitive advantage. Philips’ rollout of HealthSuite Imaging on sovereign-cloud instances demonstrates how regulatory adherence and innovation can coexist. Furthermore, heightened cybersecurity vigilance spurs replacement of legacy PACS with zero-trust, vendor-neutral archives—driving incremental advanced visualization market revenues.

Regulatory Landscape
Advanced visualization software is regulated as medical device software in major markets, which increases the focus on clinical validation, lifecycle risk management, and cybersecurity controls for network-connected deployments. In the United States, many image processing and management functions are cleared through the FDA under Class II pathways (commonly aligned with 21 CFR 892.2050). In January 2026 (re-issued later in January 2026), the FDA issued final guidance on Clinical Decision Support (CDS) software, clarifying how certain CDS functions are interpreted under section 520(o)(1)(E) of the FD&C Act.
In Europe, Regulation (EU) 2017/745 (MDR) remains the core framework for medical device software, with consolidated updates effective as of January 1, 2026. The EU AI Act (Regulation EU 2024/1689) adds requirements such as technical documentation, risk management, and transparency for high-risk AI used in medical devices. Internationally, IMDRF work continues to support harmonization, including finalized guidance on medical device software risk characterization in January 2025 and a consultation on an AI lifecycle management technical framework from April to July 2026. Together, these steps reinforce structured change control and ongoing performance monitoring for AI-enabled visualization tools.
Value Chain Analysis
The value chain begins with modality OEMs (CT, MRI, ultrasound, nuclear medicine) and component suppliers (detectors, GPUs, and compute infrastructure) that generate and pre-process imaging data. Advanced visualization software developers then add segmentation, 3D/4D rendering, quantitative analysis, and reporting. Integration and interoperability follow, as enterprise imaging platforms connect to PACS/VNA and EHR environments via standards such as DICOM and HL7/FHIR, while deployments are supported by vendor professional services, channel partners, and hospital IT teams across on-premise, cloud, and hybrid architectures.
Downstream, providers (hospitals and diagnostic imaging centers) operationalize these tools through workflow design, protocol standardization, and managed services that cover upgrades, cybersecurity, and GPU scaling. Supply-side resilience and data visibility are also becoming more structured in adjacent healthcare IT ecosystems; for example, Clarium and the Healthcare Industry Resiliency Collaborative (HIRC) announced a long-term partnership in July 2024 to co-develop supply chain resiliency technology and data standards. That partnership illustrates how shared data frameworks and control-tower approaches are spreading through healthcare operations, shaping how imaging IT vendors position reliability, service levels, and integration readiness.
Competitive Landscape
Industry consolidation is tempered by persistent innovation, generating a moderately concentrated structure. Top five vendors—Siemens Healthineers, GE HealthCare, Philips, Canon Medical and Sectra—together control approximately 68% of global revenue, while more than 70 smaller AI specialists supply algorithmic point solutions. GE HealthCare’s 2024 purchases of MIM Software and Intelligent Ultrasound’s AI unit totalled over USD 51 million, widening its oncology and women’s-health portfolios. Siemens invests USD 27.38 billion across photon-counting CT and digital services, planning to scan 1 billion patients by 2035.
Strategic alliances influence product roadmaps: Philips teamed with NVIDIA for generative-AI MRI reconstruction, while RadNet integrates TeraRecon’s Eureka marketplace into nationwide imaging centers to accelerate algorithm deployment. Cloud vendors deepen lock-in by bundling lifecycle cybersecurity, disaster recovery and AI-marketplace access into long-term managed-service contracts. Emerging gaps include interventional guidance and real-time clinical-decision tools, where startups develop voice-controlled and gesture-based UIs to alleviate sterile-field constraints.
Longer term, competitive differentiation will hinge on open-API ecosystems and sovereign-cloud certifications. Providers increasingly score bids on data portability and algorithm interchangeability, rewarding vendors who relinquish proprietary file formats and embrace standards-based integration—further shaping advanced visualization market trajectories.
Advanced Visualization Industry Leaders
Fujifilm Holdings Corporation
Koninklijke Philips N.V.
Agfa-Gevaert Group
Canon Inc. (Canon Medical Systems Corporation)
General Electric Company (GE Healthcare)
- *Disclaimer: Major Players sorted in no particular order

Market Opportunities and Future Outlook
A key whitespace is extending advanced visualization from radiology post-processing into surgical planning and clinician-facing 3D review, supported by recent regulatory validation and hardware compatibility. In April 2026, Avatar Medical received FDA 510(k) clearance for Avatar Medical Vision for use with Barco Eonis glasses-free 3D medical displays. This clearance positions glasses-free 3D review as a regulated workflow option for image processing, review, and surgical planning, rather than a purely experimental visualization add-on. It also creates a path for vendors to bundle certified 3D visualization with procedure-centric service packages, including setup, training, and integration to enterprise imaging, aligned to both hospital and imaging-center operating models.
Another opportunity area is interoperability-driven workflow automation and coverage documentation. Health systems are aligning imaging IT with broader exchange standards and administrative workflows. The ONC 2026 Standards Version Advancement Process (SVAP) approved updates including USCDI v6 and Da Vinci implementation guides for exchange of coverage requirements and prior authorization, which increases the value of enterprise platforms that can connect imaging-derived quantitative outputs to clinical documentation and utilization management. With cloud and hybrid adoption constraints in Europe tied to data sovereignty, vendors that operationalize encryption-key residency, auditability, and standardized APIs are better positioned within multinational deployments and multi-site collaboration programs.
Recent Industry Developments
- July 2026: Canon Medical Systems USA introduced CLEAR Motion across its Aquilion ONE CT portfolio and expanded Precise IQ Engine (PIQE) 1024 Matrix Deep Learning Reconstruction to the Aquilion Serve SP scanner. The launch tightens the link between scanner-side reconstruction and downstream advanced visualization, improving motion robustness and image fidelity for 3D and quantitative workflows. This also strengthens Canon's ability to bundle modality upgrades with enterprise software and long-term service contracts.
- April 2026: Royal Philips received U.S. FDA 510(k) clearance for the Spectral CT Verida system, an AI-powered detector-based spectral CT. Regulatory clearance for spectral CT platforms supports broader adoption of quantitative, multi-energy visualization and enterprise distribution of richer datasets beyond conventional CT. The approval increases competitive intensity among CT vendors that pair detector innovation with integrated visualization and analytics.
- July 2024: Clarium and the Healthcare Industry Resiliency Collaborative (HIRC) announced a long-term strategic partnership to co-develop healthcare supply chain resiliency technology and data standards, including a Resiliency Monitor tool. While centered on supply chain operations, the announcement highlights accelerating adoption of shared data standards and real-time visibility platforms across healthcare IT. This trend reinforces buyer expectations for interoperability, monitoring, and governance capabilities from enterprise imaging and visualization vendors operating in multi-facility networks.


Research Methodology Framework and Report Scope
Market Definition and Coverage
This market is defined as revenue generated from advanced clinical visualization software, enabling hardware, and related services that turn medical imaging data into interactive 2D to 4D views used for diagnosis and care decisions across healthcare settings.
Scope exclusions: We exclude business intelligence dashboards, stand-alone PACS archive systems, and non-medical visualization use cases.
Segmentation Overview
- By Product & Service
- Hardware
- Software
- Services
- By Solution Type
- Enterprise Platform
- Standalone Tool
- By Deployment Model
- On-premise
- Cloud-based
- Hybrid
- By Imaging Modality
- Magnetic Resonance Imaging (MRI)
- Computed Tomography (CT)
- Ultrasound
- Nuclear Medicine (PET/SPECT)
- Emerging Modalities (Photon-Counting CT, Photoacoustic)
- By Clinical Application
- Oncology
- Cardiovascular
- Neurology
- Orthopedics & Musculoskeletal
- Gastro-Hepatology
- By End User
- Hospitals
- Diagnostic Imaging Centers
- Others
- By Geography
- North America
- United States
- Canada
- Mexico
- Europe
- Germany
- United Kingdom
- France
- Italy
- Spain
- Rest of Europe
- Asia-Pacific
- China
- Japan
- India
- Australia
- South Korea
- Rest of Asia-Pacific
- Middle East & Africa
- GCC
- South Africa
- Rest of Middle East & Africa
- South America
- Brazil
- Argentina
- Rest of South America
- North America
Data Sources, Market Sizing, and Validation
Desk Research
Desk work starts with understanding the real demand pool for advanced visualization in imaging workflows, and then mapping what portion of that spend can be reasonably attributed to visualization tools versus adjacent IT. We review public health statistics and care delivery indicators, such as OECD Health Statistics, the World Health Organization (WHO), and national health agencies that publish imaging activity or hospital capacity signals.
We also refer to sources that reflect installed imaging capacity and technology direction, such as the FDA database for cleared imaging software, peer reviewed radiology journals for adoption patterns, and customs or trade statistics where relevant for hardware-linked visualization. Company filings, investor presentations, reputable press, and one paid subscription for company financials and news are used to sanity-check the revenue mix and the pricing direction. The sources listed are illustrative, and many other public references were used for data collection, cross-checking, and clarification.
Primary Interviews and Surveys
Primary discussions are used to validate how advanced visualization is purchased and used, including budget ownership, bundling with imaging modalities, and what portion is shifting to subscription licensing. We spoke with a mix of hospital imaging leaders, radiology and cardiology workflow owners, and solution-focused commercial teams across APAC, EMEA, and the Americas, so assumptions on volumes, pricing, and adoption timing could be tightened.
Distribution of primary research fieldwork respondents
| Company type | Respondent position | Region |
|---|---|---|
| Top tier: 36% | CXOs: 17% | APAC: 39% |
| Mid tier: 47% | Functional/Unit leaders: 33% | EMEA: 34% |
| Smaller Players: 17% | Managers: 50% | Americas: 27% |
Market-Sizing & Forecasting
Sizing begins with a top-down build where imaging activity and care capacity are used to reconstruct the addressable demand pool, which is then filtered by the penetration of advanced visualization in key workflows. The model is then cross-checked with selective bottom-up approximations, such as sampled average selling price (ASP) ranges for software licenses or subscriptions multiplied by estimated deployment volumes, followed by channel checks to keep the totals realistic.
Inputs used in the model include the number of diagnostic imaging procedures, the installed base and utilization of CT and MRI scanners, provider shift toward enterprise imaging platforms, the split between perpetual and subscription licensing, and typical service and maintenance attach rates. Since some deployments are bundled with imaging systems or broader imaging IT, gaps are handled by applying conservative attribution factors that were confirmed through interviews and desk checks.
For forecasting, scenario analysis is applied with a base case anchored to procedure growth and hospital digitization plans, while adoption speed is adjusted using expert feedback on AI-assisted visualization, cloud deployment comfort, and reimbursement-driven workflow changes. Currency conversion is kept consistent by using the same exchange rate timing for the entire modeled year, so pricing and volume changes are not mixed up with FX noise.
Data Validation & Update Cycle
Validation is done through multiple checks, where outputs are compared against independent signals such as scanner shipments, procedure growth trends, and the pace of enterprise imaging rollouts. If a country result shows unusual jumps, assumptions on penetration, ASP progression, and service attachment are reviewed, and when needed, follow-up conversations are triggered with participants to re-check the logic.
Before sign-off, the model is reviewed in steps by another analyst, so large variances are explained and documented in plain terms. Reports are refreshed annually, and interim updates are added when material events occur, such as policy changes, major reimbursement updates, or shifts in purchasing models. Right before delivery, we do a quick final pass to ensure the latest public indicators are reflected.
Mordor Intelligence's Advanced Visualization Market Sizing Compared With Other Published Estimates
Published market sizes for advanced visualization can look different even when the topic name is the same, because the timing of currency conversion, the way ASPs are moved forward, and the year when revenues are recognized are not always treated consistently. Differences also come from what gets counted as part of visualization versus adjacent imaging IT, and whether services are bundled into the total.
In this study, the refresh cadence and validation checks are tied to procedure and scanner-utilization signals and kept consistent year by year. Currency timing and ASP progression assumptions are re-tested during updates. This is also why the Mordor Intelligence estimate does not move in step with figures that rely more on static price uplifts or broader software scope.
Benchmark comparison
| Source | Market Size | Gaps in Research Methodology |
|---|---|---|
| Mordor Intelligence | USD 4.67 B (2026) | |
| Industry Research Group A | USD 3.90 B (2024) | Uses a different base year and often applies broader modality and offering coverage, which can shift what is attributed to advanced visualization versus general imaging infrastructure and services. |
| Regional Publisher B | USD 3.57 B (2024) | Starts from an earlier value-year and a different forecasting window, and may carry forward pricing using uniform growth assumptions that do not fully reflect subscription mix changes or year-specific FX timing. |
The spread across the three values is mainly explained by year selection and what is included as visualization-related revenue, followed by differences in how pricing and currency are kept consistent across updates. By tying the model to observable imaging activity and keeping assumptions auditable, the result remains traceable to clear demand signals and repeatable steps for future refreshes.


Key Questions Answered in the Report
How large will the advanced visualization market be by 2031?
The advanced visualization market size is projected to reach USD 7.91 billion by 2031 on rising hardware upgrades and cloud software subscriptions.
Who are the key players in Advanced Visualization Market?
Fujifilm Holdings Corporation, Koninklijke Philips N.V., Agfa-Gevaert Group, Canon Inc. (Canon Medical Systems Corporation) and General Electric Company (GE Healthcare) are the major companies operating in the Advanced Visualization Market.
Which modality shows the fastest revenue growth?
CT is the fastest-growing modality at a 12.55% CAGR, owing to photon-counting detector innovation that improves resolution and reduces radiation dose.
Which region has the biggest share in Advanced Visualization Market?
In 2025, the North America accounts for the largest market share in Advanced Visualization Market.
Page last updated on:


