Acute Lymphoblastic Leukemia Therapeutics Market Size and Share
Market Overview
| Study Period | 2020 - 2031 |
|---|---|
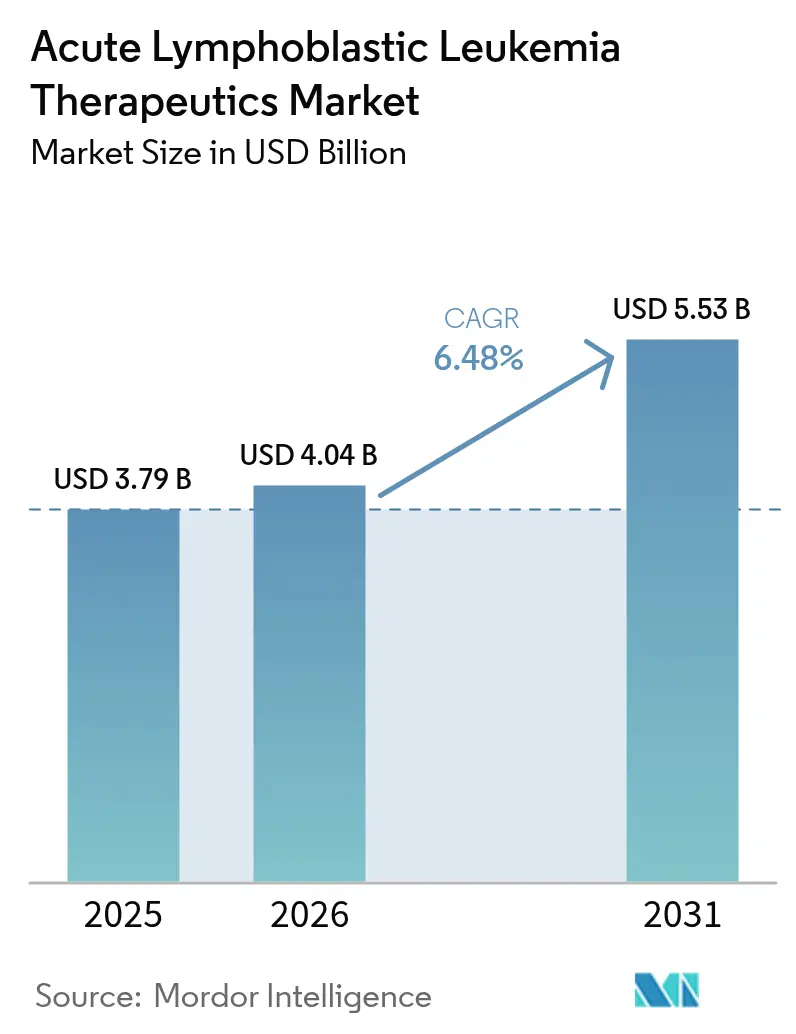
| Market Size (2026) | USD 4.04 Billion |
| Market Size (2031) | USD 5.53 Billion |
| Growth Rate (2026 - 2031) | 6.48% CAGR |
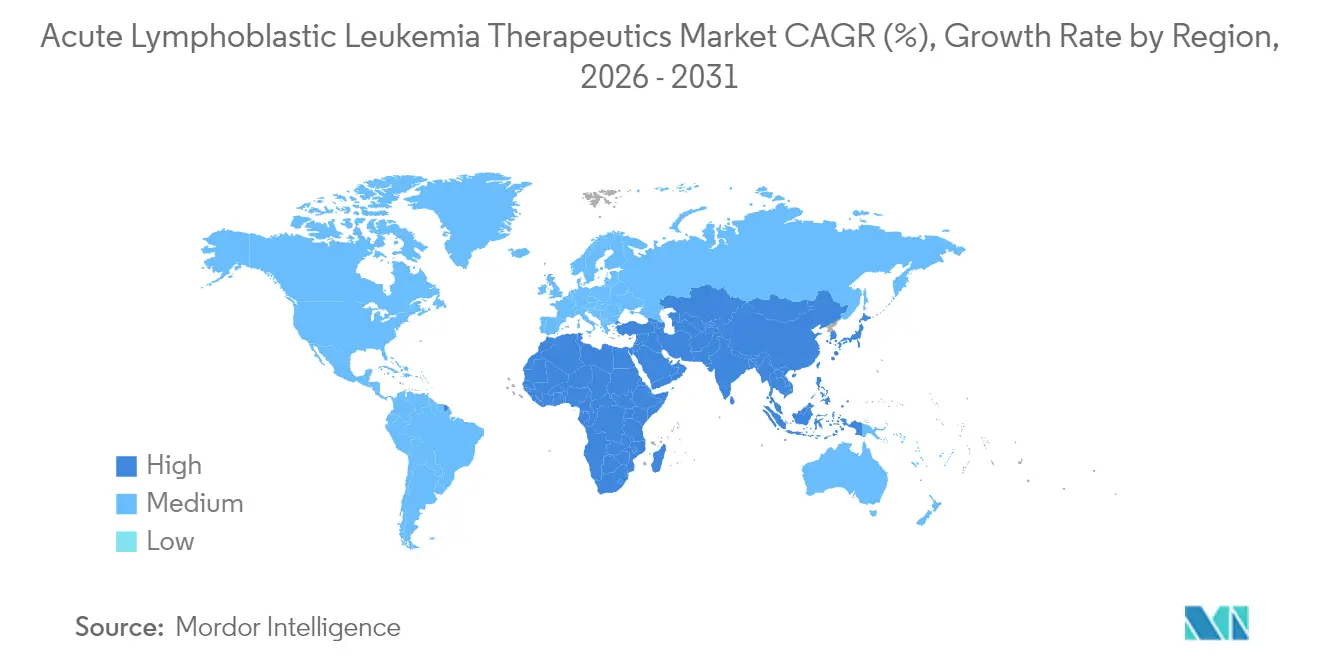
| Fastest Growing Market | Asia Pacific |
| Largest Market | North America |
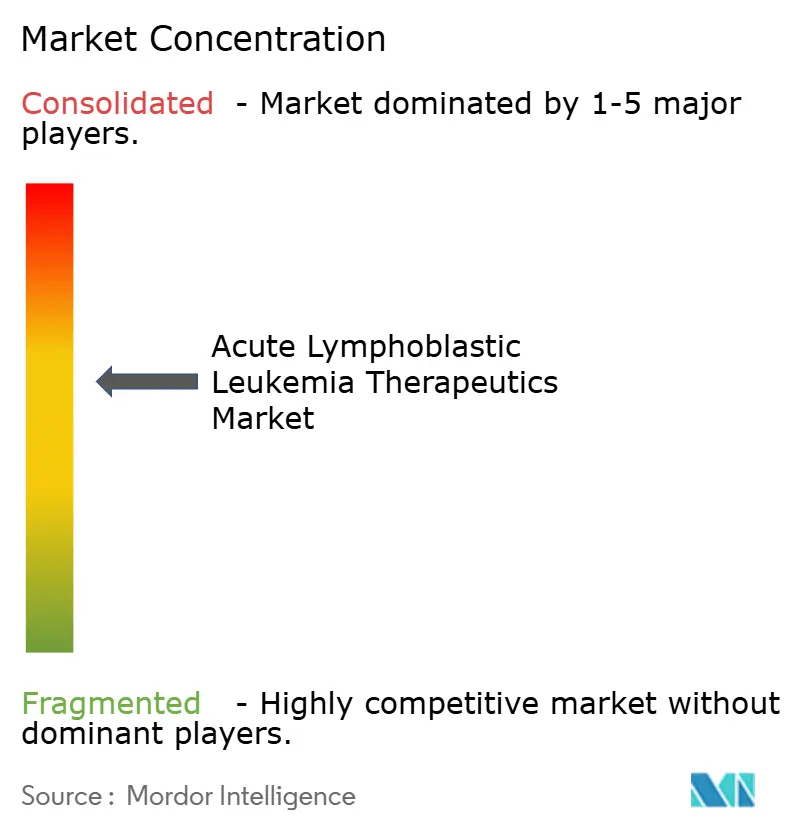
| Market Concentration | Medium |
Major Players *Disclaimer: Major Players sorted in no particular order Image © Mordor Intelligence. Reuse requires attribution under CC BY 4.0. | |
Acute Lymphoblastic Leukemia Therapeutics Market Analysis by Mordor Intelligence
The acute lymphoblastic leukemia therapeutics market size in 2026 is estimated at USD 4.04 billion, growing from 2025 value of USD 3.79 billion with 2031 projections showing USD 5.53 billion, growing at 6.48% CAGR over 2026-2031. Growth rests on the clinical success of targeted agents, immunotherapies, and cell-based products that are redefining protocols once dominated by multi-agent chemotherapy. The Asia-Pacific region is delivering the fastest regional expansion, projected at a 9.80% CAGR to 2030, as broader insurance coverage boosts diagnosis and treatment volumes in China and India. North America retains its leadership position with 37.6% of the 2024 revenue base, supported by high guideline adherence, rapid access to drug launches, and sustained reimbursement for high-ticket modalities, such as CAR-T therapy. Pipeline strength is most evident in agents addressing Philadelphia chromosome–positive disease and KMT2A-rearranged subtypes, while the broader use of minimal residual disease (MRD) testing is reducing the time to treatment modification. Pricing pressures remain a structural headwind; a single CAR-T course averages USD 525,000 and continues to challenge equitable uptake in middle-income countries.
Key Take Aways
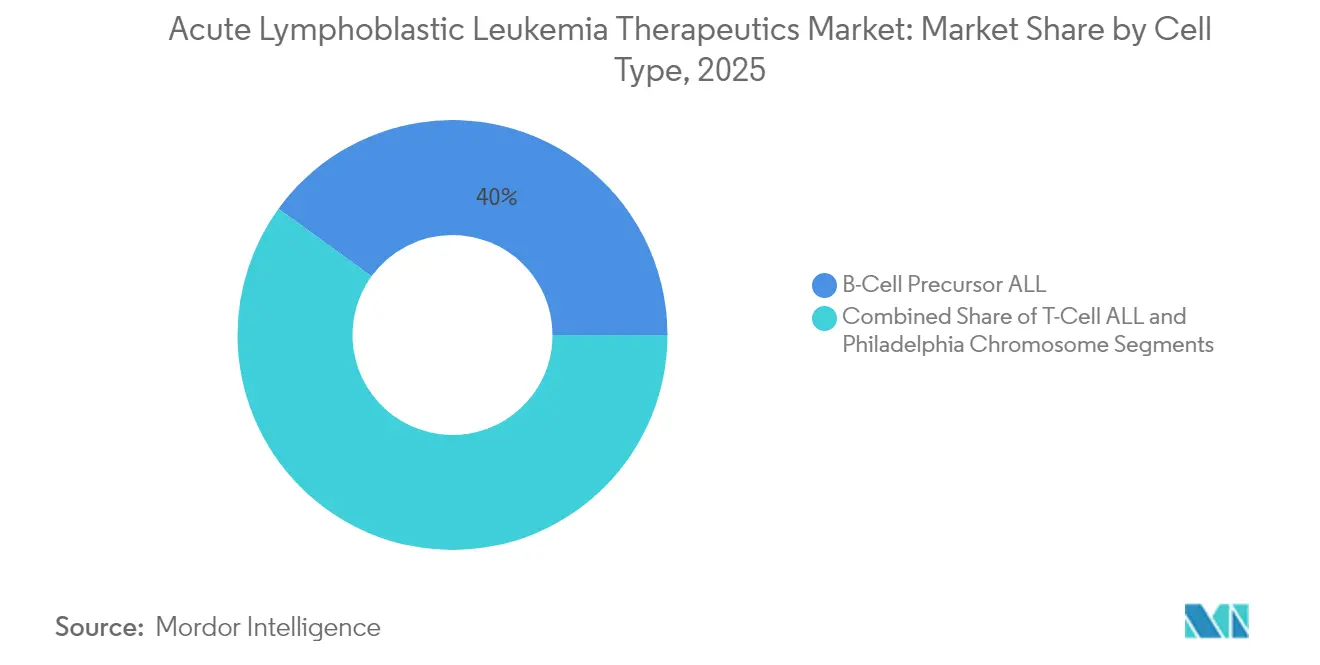
- By cell type, B-cell precursor disease held 40.02% of the acute lymphoblastic leukemia therapeutics market share in 2025; Philadelphia chromosome–positive disease is forecast to advance at a 9.05% CAGR through 2031.
- By therapy class, chemotherapy generated 39.42% of 2025 revenue, while targeted therapy is expected to grow at an 8.25% CAGR between 2026 and 2031.
- By age group, pediatrics accounted for 63.25% of the acute lymphoblastic leukemia therapeutics market size in 2025; the adult cohort is projected to expand at an 8.54% CAGR to 2031.
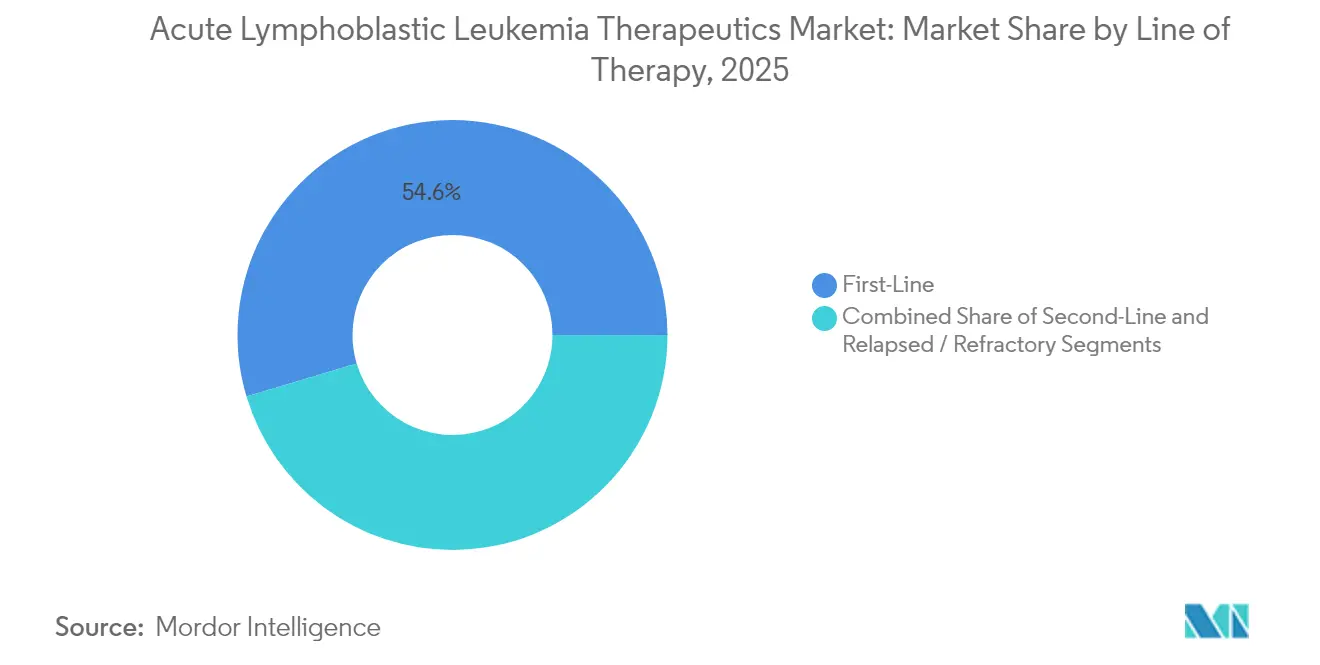
- By line of therapy, first-line protocols captured a 54.62% share in 2025, whereas the relapsed/refractory setting is poised for 7.98% CAGR growth.
- By route, intravenous delivery dominated with a 88.92% share in 2025; oral agents are rising at a 7.14% CAGR due to broader adoption of tyrosine kinase inhibitors.
- By geography, the Asia-Pacific region is projected to post the fastest gains, increasing its shareoff the acute lymphoblastic leukemia therapeutics market to 2031 at 9.57% CAGR
Note: Market size and forecast figures in this report are generated using Mordor Intelligence’s proprietary estimation framework, updated with the latest available data and insights as of 2026.
Global Acute Lymphoblastic Leukemia Therapeutics Market Trends and Insights
Drivers Impact Analysis*
| Driver | (~) % Impact on CAGR Forecast | Geographic Relevance | Impact Timeline |
|---|---|---|---|
| High burden of ALL & pediatric cancer care programs | +1.7% | North America, Europe, global programs | Long term (≥ 4 years) |
| Expanding R&D and clinical-trial pipeline | +1.4% | North America, Europe, emerging Asia-Pacific | Medium term (2-4 years) |
| Favorable expedited regulatory pathways | +1.0% | Led by North America and Europe | Short term (≤ 2 years) |
| Growing use of liquid biopsy & MRD testing | +0.8% | North America, Europe, Asia-Pacific | Medium term (2-4 years) |
| Advancements in targeted therapies | +1.2% | Global, higher impact in developed regions | Medium term (2-4 years) |
| Shift toward off-the-shelf allogeneic CAR-T platforms accelerating commercial scalability and patient eligibility | +1.0% | North America and Europe first, expanding to Asia-Pacific | Long term (≥ 4 years) |
| Source: Mordor Intelligence | |||
High burden of ALL and pediatric cancer care programs
The acute lymphoblastic leukemia therapeutics market continues to benefit from the sizable global incidence in children; 6,550 new U.S. cases appeared in 2024, and ALL represents 80% of childhood leukemias lls.org. Dedicated pediatric consortia have raised survival benchmarks, typified by a Children’s Oncology Group phase 3 study in which blinatumomab lifted three-year disease-free survival from 87.9% to 96.0%.[1]. Worldwide prevalence among children reached 168,879 cases in 2021, a 59.06% increase compared to the last two decades. Such statistics underpin sustained investment in pediatric-specific regimens and center-of-excellence infrastructure that collectively stimulate medicine uptake and guideline convergence.
Expanding R&D and clinical-trial pipeline
A prolific development ecosystem is reshaping therapeutic options. The July 2024 orphan and rare pediatric disease designations for UCART22 underscore regulator enthusiasm for next-generation allogeneic cell therapies. Revuforj (revumenib) entered the U.S. market in late 2024 with a 63% response rate in KMT2A-rearranged leukemias, validating menin inhibition as a viable strategy. Intensified CAR-T research now encompasses dual-antigen constructs and off-the-shelf platforms, aimed at reducing manufacturing lag, expanding patient eligibility, and supporting the scale-up of acute lymphoblastic leukemia therapeutics.
Accelerated and other expedited approvals
Regulators have shortened commercialization timelines for high-impact assets. Two-thirds of the FDA’s 2024 novel drug approvals used an expedited pathway,[2]U.S. Food and Drug Administration, “Novel Drug Approvals for 2024,” fda.govand ponatinib paired with chemotherapy received accelerated clearance in March 2024 for frontline Philadelphia-positive disease. Similar mechanisms in Europe and Japan are spreading, refining global launch sequences and improving forecast reliability for manufacturers.
Wider use of liquid biopsy and MRD testing
CTDNA-based assays with a sensitivity of 0.01% are informing earlier therapeutic escalations. Adult MRD-negative B-cell precursor patients receiving blinatumomab experienced a three-year overall survival rate increase from 68% to 85%. Implementation hurdles—test costs of USD 500-3,000 and insurance variability—are easing as value-based coverage expands. Standardization guidelines and clinician-training programs promoted by major academic centers are helping to reinforce adoption across the acute lymphoblastic leukemia therapeutics market.
Restraints Impact Analysis*
| Restraint | (~) % Impact on CAGR Forecast | Geographic Relevance | Impact Timeline |
|---|---|---|---|
| High therapy cost and reimbursement gaps | −1.5% | Global, highest in developing regions | Medium to long term (≥ 4 years) |
| Severe side effects coupled with relapse risk and drug resistance | −1.0% | Global | Medium term (2-4 years) |
| Disparities in healthcare access | −0.8% | Developing regions and rural areas | Long term (≥ 4 years) |
| Uncertain long-term outcomes of novel therapies | −0.8% | Global | Long term (≥ 4 years) |
| Source: Mordor Intelligence | |||
High therapy cost and reimbursement gaps
Unit pricing remains the biggest barrier to the penetration of acute lymphoblastic leukemia therapeutics. Obecabtagene autoleucel carries a list price of USD 525,000. Hospitalization and supportive-care add-ons widen the affordability gap, and many payers apply prior-authorization hurdles that can delay infusion timing. U.S. Medicare’s 2025 fee-schedule update introduced navigation codes and inflation rebates; still, significant out-of-pocket exposure persists, especially in commercially insured or self-funded plans.[3]Centers for Medicare & Medicaid Services, “CY 2025 Payment Policies Under the Physician Fee Schedule,” federalregister.gov
Severe side effects, relapse risk and drug resistance
Innovative agents bring novel toxicities: 23% of blinatumomab recipients experienced severe neurologic events in one MRD-negative adult study versus 5% in chemotherapy controls. CAR-T neuromonitoring, cytokine release management, and long-term B-cell aplasia surveillance intensify resource demands. Relapse rates remain significant—12.7% in pediatric cohorts—with five-year post-relapse survival rates of only 52.5% for B-ALL and 21.5% for infant ALL.[1]Children’s Hospital of Philadelphia, “New Research From Children’s Hospital of Philadelphia to Transform Standard of Care for Newly Diagnosed B-Cell ALL,” chop.edu Resistance mechanisms, such as alternative splicing, attenuate the efficacy of steroids and methotrexate, necessitating constant regimen revisions across the acute lymphoblastic leukemia therapeutics market.
*Our forecasts treat driver/restraint impacts as directional, not additive. The impact forecasts reflect baseline growth, mix effects, and variable interactions.
Segment Analysis
By Cell Type: Precision therapeutics reshape segment performance
The acute lymphoblastic leukemia therapeutics market size for B-cell precursor disease was anchored by a 40.02% revenue share in 2025. Dominance reflects the depth of CD19-directed CAR-T offerings, bispecific antibodies, and MRD-driven algorithms that support durable remissions. Ponatinib-based regimens have redefined outcomes for Philadelphia chromosome–positive disease, which is projected to deliver a 9.05% CAGR to 2031. T-cell disease remains less well understood, yet early-phase data for CD7-targeting CAR-T therapy show a 94% complete response rate, indicating significant white-space growth potential.
Treatment innovation is progressively stratifying subsegments by genetic lesion, with menin inhibitors offering newfound control for KMT2A-rearranged cases. As MRD testing proves cost-effective, optimization of follow-up therapy is expected to reduce historical relapse rates, narrowing the performance gap between well-resourced centers and low-resource settings within the acute lymphoblastic leukemia therapeutics market.


By Therapy: Targeted options challenge cytotoxic mainstays
Chemotherapy retained a 39.42% share in 2025, supported by entrenched multi-agent protocols. Yet targeted therapy is forecast to outpace all other classes at an 8.25% CAGR, energised by accelerated approvals for ponatinib, revumenib, and successive bispecific antibodies. CD19-directed CAR-T products, such as tisagenlecleucel and obecabtagene autoleucel, have redefined salvage lines; a pivotal study reported a 76% overall remission rate with improved safety profiles for neurotoxicity.
Next-generation strategies aim to deliver allogeneic and dual-targeting constructs that deepen response and abate manufacturing delays. Allogeneic transplantation remains a curative pillar for high-risk phenotypes, while radiation keeps its niche for central nervous system prophylaxis or conditioning regimens. Collectively, these shifts underpin a gradual yet decisive tilt toward precision modalities inside the acute lymphoblastic leukemia therapeutics market.
By Age Group: Adult population accelerates on tailored regimens
Pediatric incidence guarantees a 63.25% revenue share for children in 2025, and the addition of blinatumomab to frontline chemotherapy pushed three-year disease-free survival to 96.0%. Hospitals are reorganizing infusion suites to manage the therapy’s 28-day cycles that require inpatient monitoring during the first week.
The adult cohort is advancing at 8.54% CAGR as pediatric-inspired regimens gain acceptance and novel TKIs reduce transplant reliance. Adult MRD-negative patients treated with blinatumomab posted an 85% three-year overall survival versus 68% on chemotherapy alone. Geriatric management is shifting to a moderately intensive induction approach, combined with immune modulation, while acknowledging the burdens of comorbidities and maintaining remission prospects. These dynamics are triggering service-line investments across the acute lymphoblastic leukemia therapeutics market.
By Line of Therapy: Relapsed/refractory setting drives innovation
First-line care maintained 54.62% share in 2025, anchored by risk-stratified combinations that can cure a substantial subset. Pediatric research has informed adult protocols; dasatinib combined with intensive chemotherapy achieved a 65.5% three-year event-free survival rate in Ph-positive patients, surpassing historical comparators.
The relapsed/refractory business is the growth engine for the acute lymphoblastic leukemia therapeutics market, with an 7.98% CAGR. Inotuzumab ozogamicin achieved 58.3% complete responses in Phase 2 pediatric trials, and CD19-directed CAR-T therapies consistently exceed 80% complete remission rates in heavily pre-treated populations. Second-line frameworks are adopting targeted agents earlier to maximise transition to curative transplant, and real-world registries are validating these approaches.
By Route of Administration: Oral dosing gains momentum
Intravenous administration generated 88.92% of 2025 spending, consistent with the infusion requirements of chemotherapy, blinatumomab, and cell therapy. Manufacturers are expanding accredited treatment center networks—obecabtagene autoleucel doubled to 60 U.S. sites within months—to stabilise patient access curves.
Oral formulations are gaining at a 7.14% CAGR. Imkeldi, an imatinib oral solution, removes pill-burden barriers and expands dosing flexibility for pediatric and dysphagic adults. Multiple investigational agents targeting leukemogenic mutations are entering Phase 2 in tablet or solution form, promising benefits for ambulatory care and improvements in adherence that broaden the addressable base of the acute lymphoblastic leukemia therapeutics market.
Geography Analysis
North America retained 37.05% of 2025 revenue, buoyed by 62,770 total leukemia diagnoses that year and 6,550 incident ALL cases. The FDA cleared revumenib and ponatinib plus chemotherapy in 2024, underscoring a robust authorization cadence that keeps novel agents accessible early. High insurance coverage and established MRD testing protocols continue to shorten treatment-to-response intervals, reinforcing premium pricing power in the acute lymphoblastic leukemia therapeutics market.
Asia-Pacific is expanding faster than any other region at a 9.57% CAGR. Healthcare access reforms in China and India are increasing screening volumes, while local innovation is building a domestic pipeline. China’s approval of zevorcabtagene autoleucel for multiple myeloma illustrates its regulatory readiness for cell therapy, and real-world evidence on ORG-101 has shown complete response rates above 80% in adult B-ALL. Nevertheless, rural-urban gaps in diagnostic reach and therapy affordability remain pronounced, moderating absolute penetration despite strong percentage growth.
Europe maintains a significant share through centralized healthcare systems and extensive clinical trial participation. The European Medicines Agency has extended several leukemia indications—Bosulif and Calquence among them—and continues to tailor adaptive pathways for advanced therapies. The Middle East and Africa, as well as South America, occupy smaller slices of the acute lymphoblastic leukemia therapeutics market. Tertiary centers in large cities are adding MRD and CAR-T capabilities; however, macroeconomic and infrastructural limitations hinder their widespread adoption. Burden-of-disease analyses show incidence is falling in higher-income locales while trending upward in lower-income ones, spotlighting the public-health imperative of region-specific funding models.

Competitive Landscape
The acute lymphoblastic leukemia therapeutics market exhibits moderate concentration, led by Novartis, Amgen, and Pfizer, whose oncology portfolios encompass TKIs, bispecific antibodies, and CAR-T franchises. Autolus Therapeutics is emerging with obe-cel, a CD19-directed product featuring a 76% remission rate and an improved safety profile. Strategic alliances continue to proliferate; large-cap firms license platform technologies from niche innovators to diversify their pipeline.
Technological differentiation is an increasingly powerful lever. BioCanRx funds CD22-specific CAR-T manufacturing to tighten domestic supply chains and reduce per-patient cost. Meanwhile, CD7-targeting constructs demonstrate 94% complete responses in T-ALL phase 1 data, lining up new entrants eager to tackle historically resistant phenotypes. These efforts highlight the race to address residual unmet needs and solidify positions in high-growth subsegments of the acute lymphoblastic leukemia therapeutics market.
Price competition remains muted given limited therapeutic substitutes and high development costs. However, payers are exploring outcome-based contracts for ultra-expensive modalities, a move that could redefine margin structures. As pipeline entrants proliferate, differentiation via manufacturing scalability, safety enhancements, and robust real-world data will dictate long-term share shifts.
Acute Lymphoblastic Leukemia Therapeutics Industry Leaders
Pfizer Inc.
Bristol-Myers Squibb Company
Novartis AG
F. Hoffmann-La Roche
Amgen Inc
- *Disclaimer: Major Players sorted in no particular order

Recent Industry Developments
- May 2025: Penn Medicine reported huCART19-IL18 achieved cancer reduction in 81% of patients and complete remission in 52%, with expansion plans to ALL cohorts
- April 2025: Autolus Therapeutics obtained conditional UK MHRA authorization for Aucatzyl (obecabtagene autoleucel) in adult relapsed/refractory B-ALL.
- January 2025: The European Commission approved BLINCYTO (blinatumomab) as standalone consolidation therapy for newly diagnosed Philadelphia-negative, CD19-positive adult B-ALL.
- November 2024: The FDA cleared Aucatzyl for relapsed/refractory adult B-cell precursor ALL.


Research Methodology Framework and Report Scope
Market Definitions and Key Coverage
Mordor Intelligence defines the acute lymphoblastic leukemia (ALL) therapeutics market as all prescription drugs and cell-based procedures that are administered with curative or palliative intent to patients diagnosed with B-cell, T-cell, or Philadelphia-chromosome positive ALL across pediatric, adult, and geriatric cohorts worldwide.
Formulations delivered intravenously or orally and advanced options such as CAR-T, bispecific antibodies, and allogeneic stem-cell transplantation sit inside scope, while purely diagnostic kits, supportive care agents (anti-emetics, growth factors), and clinical-trial only molecules remain outside scope.
Segmentation Overview
- By Cell Type
- B-Cell Precursor ALL
- T-Cell ALL
- Philadelphia Chromosome (Ph+ / Ph–)
- By Therapy
- Chemotherapy
- Hyper-CVAD
- CALGB 8811
- Linker
- Nucleoside Inhibitors
- Targeted Therapy
- Radiation Therapy
- Stem-Cell Transplantation
- Autologous
- Allogeneic
- CAR-T / Cell Therapy
- CD19
- Next-Gen (Dual Antigen, Allogeneic)
- Chemotherapy
- By Age Group
- Pediatrics (0–18 yrs)
- Adults (19–64 yrs)
- Geriatrics (≥65 yrs)
- By Line of Therapy
- First-Line
- Second-Line
- Relapsed / Refractory
- By Route of Administration
- Intravenous
- Oral
- Geography
- North America
- United States
- Canada
- Mexico
- Europe
- Germany
- United Kingdom
- France
- Italy
- Spain
- Rest of Europe
- Asia-Pacific
- China
- Japan
- India
- South Korea
- Australia
- Rest of Asia-Pacific
- Middle East and Africa
- GCC
- South Africa
- Rest of Middle East and Africa
- South America
- Brazil
- Argentina
- Rest of South America
- North America
Detailed Research Methodology and Data Validation
Primary Research
Multiple touchpoints with pediatric hematologists, adult oncologists, hospital pharmacists, and regional patient-advocacy leads in North America, Europe, Asia, and Latin America helped us validate real-world line-of-therapy shares, typical dose intensity, emerging off-label shifts, and average selling-price corridors. Their insights closed gaps left by desk work and guided assumption ranges that feed the model.
Desk Research
We began by mapping the treated patient pool using open epidemiology files from GLOBOCAN, CDC SEER, the European Cancer Information System, and Japan's National Cancer Registry. Treatment uptake patterns were benchmarked with FDA and EMA approval archives, ClinicalTrials.gov status logs, and prescribing guidelines issued by entities such as the National Comprehensive Cancer Network. Financial clues on drug sales were pulled from 10-K filings and investor decks, supplemented by Dow Jones Factiva news flow and D&B Hoovers summaries of listed and private oncology players. This illustrative list is not exhaustive; numerous additional public datasets and gray literature informed break-points and cross-checks.
Market-Sizing & Forecasting
Incidence, prevalence, and survival trajectories create a top-down demand pool that is then filtered through treatment-seeking rates, line-of-therapy progression, and regimen-specific duration to derive annual courses. Select bottom-up checks, aggregated sales disclosures of leading suppliers and sampled ASP × volume audits from hospital tenders, help us recalibrate totals. Key inputs include: 1) country-wise ALL incidence, 2) pediatric-to-adult split, 3) share of patients eligible for targeted or cell therapy, 4) average treatment length per regimen, 5) branded versus generic ASP drift, and 6) regulatory approval cadence. Forecasts run on multivariate regression where incidence, therapy penetration, and price erosion act as drivers; three alternative scenarios are stress-tested before the base case is locked.
Data Validation & Update Cycle
Outputs pass variance checks against historical therapy spend, payer reimbursement ceilings, and publicly reported revenue of anchor drugs. Senior analysts review anomalies, after which a second pair of eyes signs off. We refresh every twelve months and trigger mid-cycle updates if a major label expansion, safety withdrawal, or reimbursement swing materially alters outlook.
Why Mordor's Acute Lymphocytic Leukemia Therapeutics Baseline Stands Reliable
Published values often differ because firms choose broader leukemia umbrellas, apply uniform drug prices, or lift forecasts without checking treated-patient eligibility.
Scope clarity, disciplined variable selection, and an annual refresh help Mordor present the most reproducible starting point for decision-makers.
Benchmark comparison
| Market Size | Anonymized source | Primary gap driver |
|---|---|---|
| USD 3.79 B | Mordor Intelligence | - |
| USD 3.32 B (2024) | Global Consultancy A | Excludes CAR-T and adult relapsed cases |
| USD 5.27 B | Regional Consultancy B | Bundles AML & ALL drugs and uses list prices |
In short, by aligning to treated-patient math and cross-verifying with on-market sales, Mordor delivers a balanced, transparent baseline that buyers can trace back to clear variables and repeatable steps.


Key Questions Answered in the Report
What is the current value of the acute lymphoblastic leukemia therapeutics market?
The market is valued at USD 4.04 billion in 2026 and is expected to reach USD 5.53 billion by 2031.
Which region is growing the fastest?
Asia-Pacific is expanding at a 9.57% CAGR, the quickest regional rate through 2031.
Which therapy class is projected to grow most rapidly?
Targeted therapies are forecast to post an 8.25% CAGR between 2026-2031, outpacing all other classes.
How significant is pediatric demand?
Children account for 63.25% of 2025 revenue, underscoring their dominance in treatment volumes.
What is the main barrier to wider adoption of novel therapies?
High therapy cost, including CAR-T infusions priced at USD 525,000, remains the leading obstacle to equitable access.
Are oral treatments becoming more common?
Yes, oral formulations such as Imkeldi are fueling a 7.14% CAGR for the oral segment, offering convenient administration and improved adherence.
Page last updated on:


