Chronic Lymphocytic Leukemia Market Size and Share
Market Overview
| Study Period | 2020 - 2031 |
|---|---|
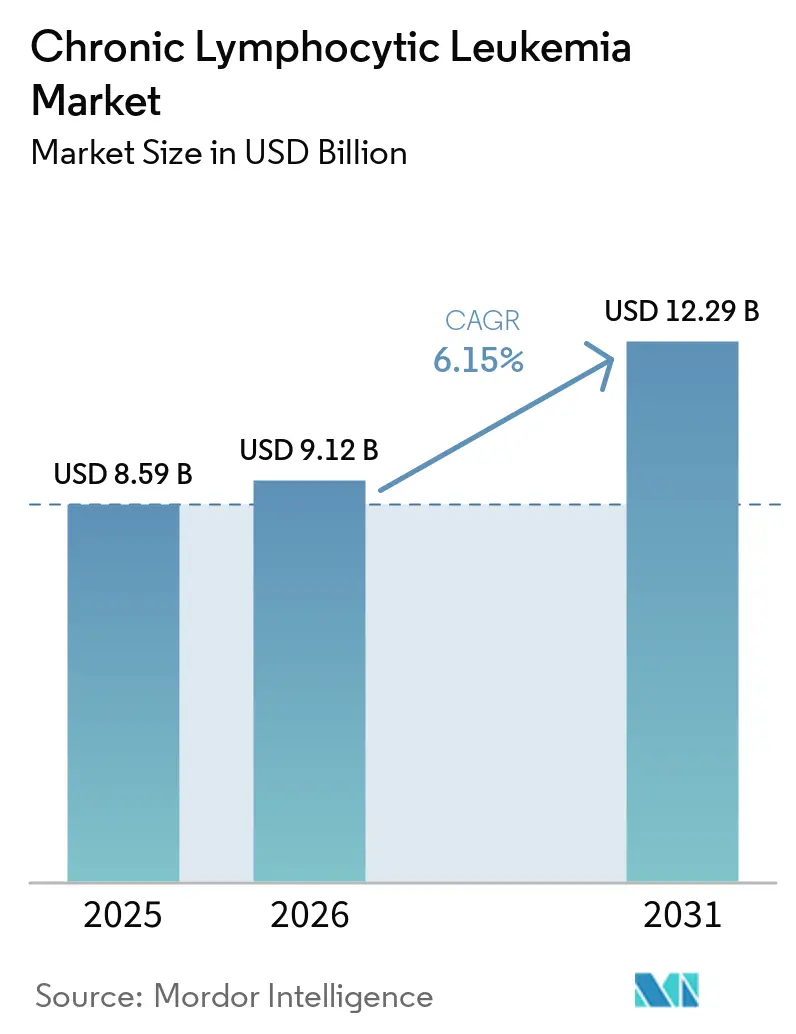
| Market Size (2026) | USD 9.12 Billion |
| Market Size (2031) | USD 12.29 Billion |
| Growth Rate (2026 - 2031) | 6.15% CAGR |
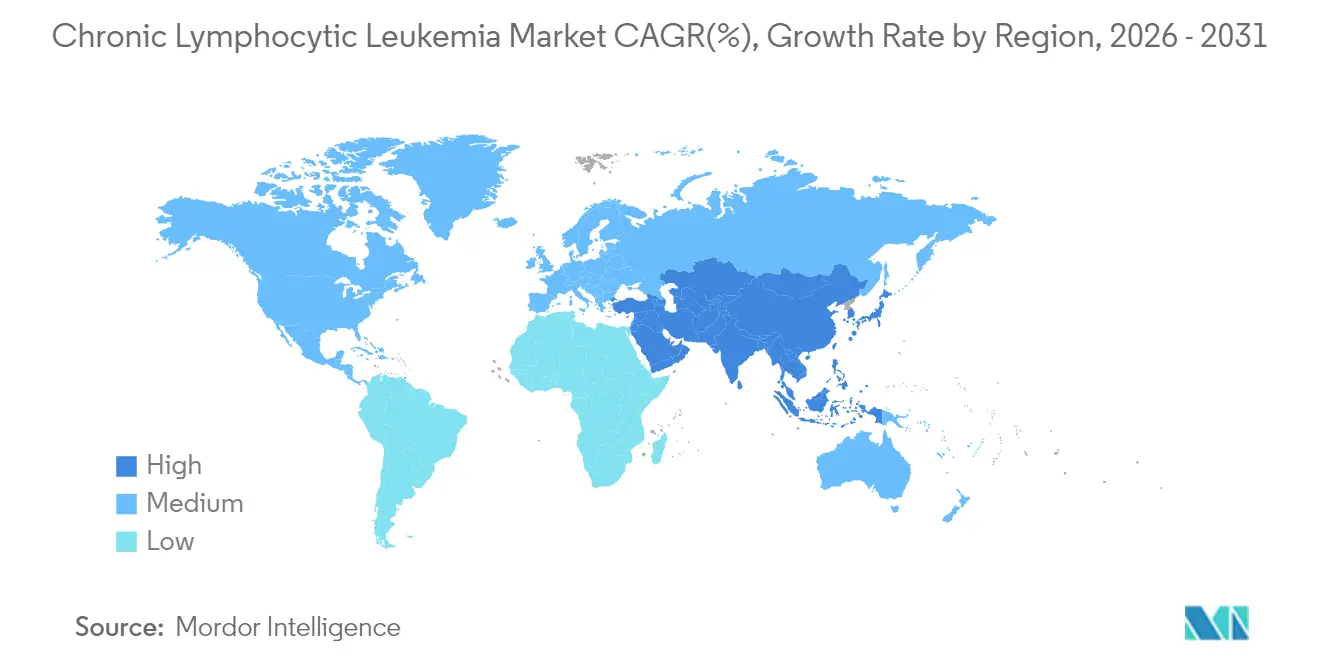
| Fastest Growing Market | Asia-Pacific |
| Largest Market | North America |
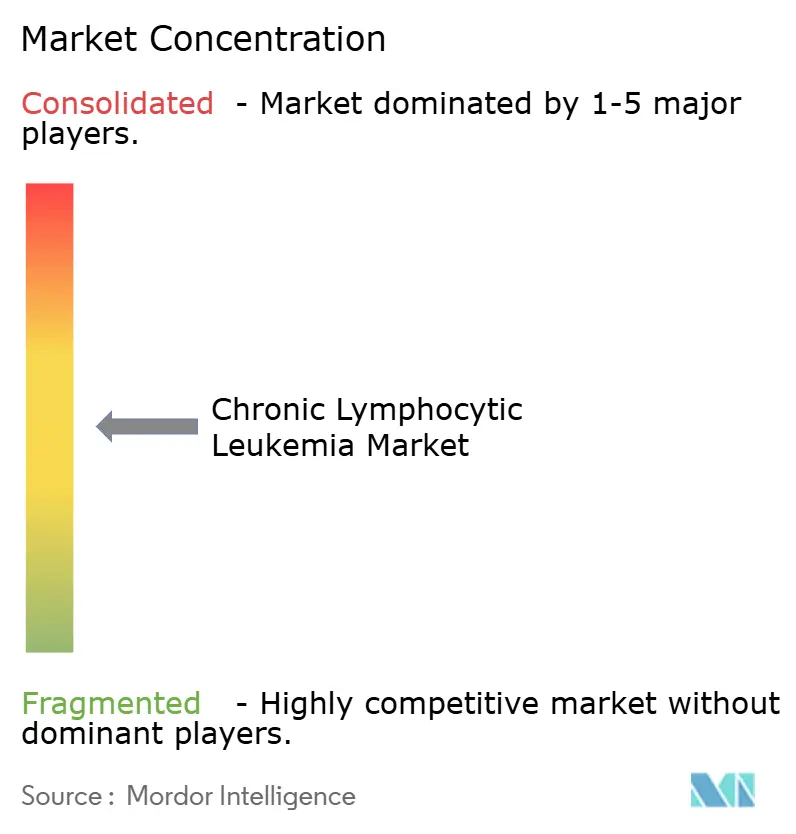
| Market Concentration | Medium |
Major Players *Disclaimer: Major Players sorted in no particular order Image © Mordor Intelligence. Reuse requires attribution under CC BY 4.0. | |
Chronic Lymphocytic Leukemia Market Analysis by Mordor Intelligence
The Chronic Lymphocytic Leukemia Market size is expected to increase from USD 8.59 billion in 2025 to USD 9.12 billion in 2026 and reach USD 12.29 billion by 2031, growing at a CAGR of 6.15% over 2026-2031.
The growing preference for chemotherapy-free regimens, expanded genomic testing, and increased payer acceptance of oral targeted therapies are driving significant changes in clinical practices. Regulatory authorities are expediting combination approvals, exemplified by the February 2026 approval of the acalabrutinib and venetoclax combination, significantly reducing development timelines that previously spanned a decade. In high-income markets, insurers have eliminated step-therapy requirements that once mandated chemotherapy failure; however, annual therapy costs nearing USD 180,000 continue to limit adoption in middle-income regions. The introduction of off-the-shelf allogeneic CAR-T products is expected to address manufacturing challenges, while AI-enabled minimal residual disease tests are facilitating early treatment discontinuation and minimizing drug exposure.
Key Report Takeaways
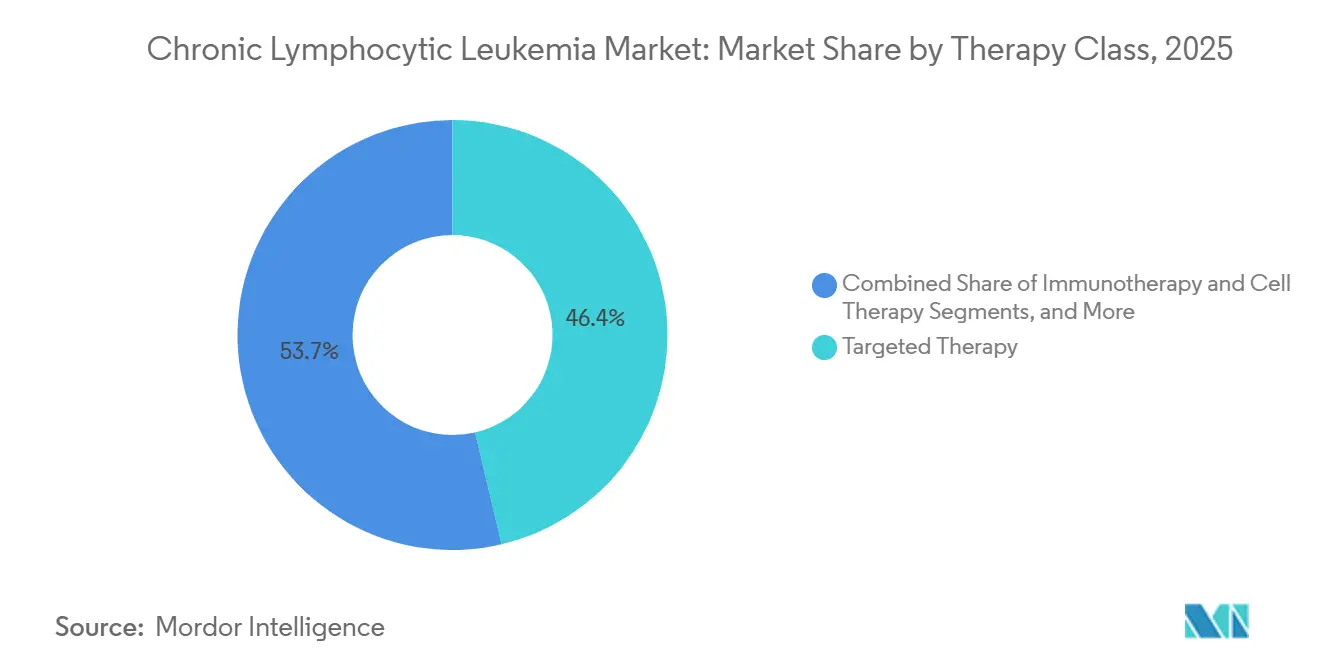
- By therapy class, targeted agents commanded 46.35% revenue share in 2025, whereas immunotherapy and cell therapy are forecast to grow 8.10% CAGR through 2031, the fastest among all modalities.
- By diagnostic technology, flow cytometry commanded 44.23% revenue share in 2025, whereas molecular genetic tests (NGS, PCR panels) are forecast to grow 7.60% CAGR through 2031, the fastest among all modalities.
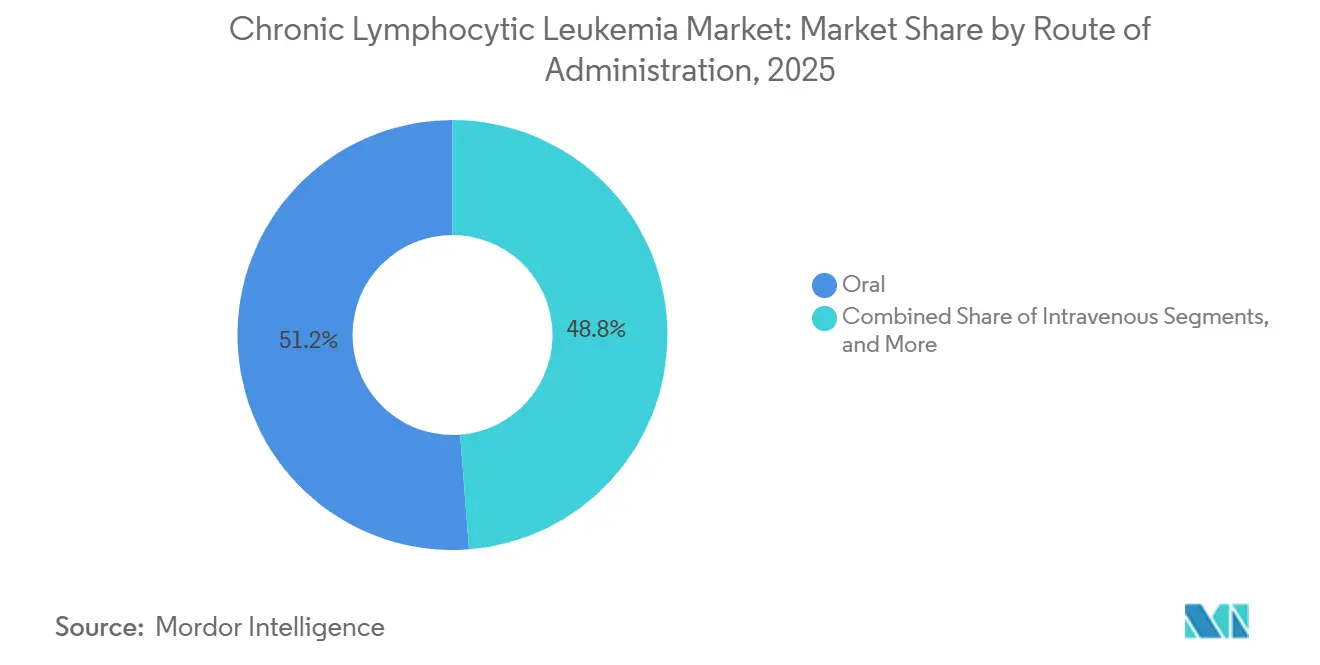
- By route of administration, oral formulations accounted for 51.23% of 2025 sales and are set to advance at a 7.45% CAGR on the back of patient convenience and shifting payer incentives.
- By line of therapy, first-line treatment held 52.45% of 2025 revenue, while the relapsed or refractory setting is poised for 6.95% CAGR as non-covalent BTK inhibitors address resistance mutations.
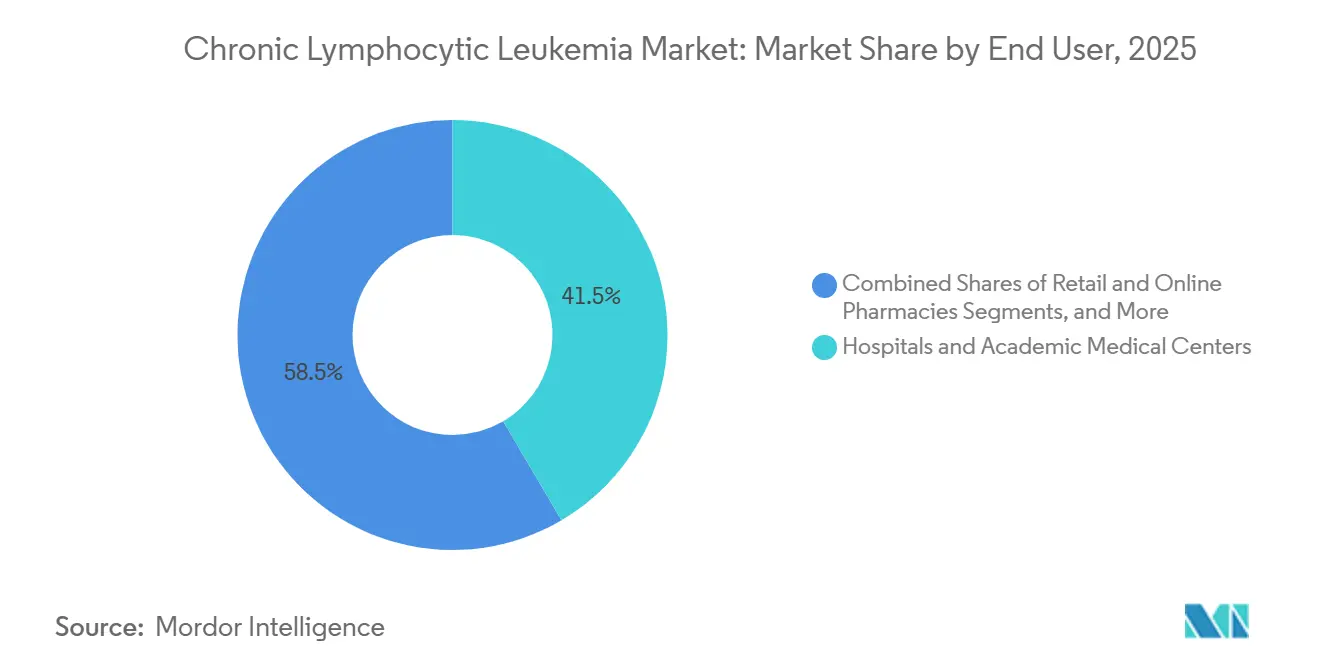
- By end user, hospitals and academic centers led with 41.54% market share in 2025, yet retail and online pharmacies are projected to expand 8.80% CAGR with the growing dominance of home-dispensed orals.
- By geography, North America captured 39.67% of 2025 revenue, whereas Asia-Pacific is expected to outpace all regions at 8.50% CAGR to 2031, powered by rapid zanubrutinib uptake in China.
Note: Market size and forecast figures in this report are generated using Mordor Intelligence’s proprietary estimation framework, updated with the latest available data and insights as of 2026.
Global Chronic Lymphocytic Leukemia Market Trends and Insights
Drivers Impact Analysis*
| DRIVER | (~) % IMPACT ON CAGR FORECAST | GEOGRAPHIC RELEVANCE | IMPACT TIMELINE |
|---|---|---|---|
| Rapid uptake of targeted BTK & BCL-2 inhibitors | +1.8% | Global, with North America & EU leading adoption | Short term (≤ 2 years) |
| Rising CLL prevalence in ageing populations | +1.2% | North America, Europe, Japan; emerging in China | Long term (≥ 4 years) |
| Broader reimbursement for next-gen oral regimens | +1.0% | North America & EU core, expanding to APAC | Medium term (2-4 years) |
| Expansion of companion diagnostics & precision medicine | +0.9% | Global, concentrated in markets with NGS infrastructure | Medium term (2-4 years) |
| Emergence of off-the-shelf allogeneic CAR-T platforms | +0.7% | North America, EU; clinical-trial stage in APAC | Long term (≥ 4 years) |
| AI-enabled minimal-residual-disease (MRD) monitoring tools | +0.6% | North America, EU, Australia; pilot programs in urban China | Medium term (2-4 years) |
| Source: Mordor Intelligence | |||
BTK and BCL-2 Inhibitors Surge Ahead of Chemoimmunotherapy
BTK and BCL-2 inhibitors have become the preferred frontline treatments, replacing traditional chemoimmunotherapy due to their superior five-year progression-free survival rates, simplified oral dosing, and reduced toxicity. The acalabrutinib-venetoclax combination demonstrated an 88% five-year progression-free rate in treatment-naïve patients, significantly outperforming the obinutuzumab-chlorambucil regimen. Pirtobrutinib, approved for addressing covalent-inhibitor resistance, is gaining traction as first-generation agents increasingly select for C481S mutations in 8–12% of patients annually. The strong efficacy of first-line treatments, combined with effective salvage options, is driving a decline in the chemotherapy segment within the chronic lymphocytic leukemia market.
CLL Cases Surge as Populations Age
With a median diagnosis age of 72, chronic lymphocytic leukemia (CLL) cases are increasing alongside aging populations in industrialized nations. The United States is projected to see 22,760 new cases in 2026, reflecting a 4% rise from 2024.[1]National Cancer Institute, “Chronic Lymphocytic Leukemia – Cancer Stat Facts,” seer.cancer.gov In Europe, 2025 recorded 24,500 new diagnoses, driven by rising life expectancies in countries such as Germany, Italy, and Spain. In China, the incidence of CLL rose by 18% between 2020 and 2025, supported by expanded routine hematology testing in second-tier cities.[2]Diseases, “High-Sensitivity Flow Cytometry for the Reliable Detection of Measurable Residual Disease,” mdpi.com However, 43% of newly diagnosed Europeans over 75 faced renal or cardiovascular contraindications for venetoclax, underscoring a gap between increasing diagnoses and treatment eligibility. This disparity has prompted the adoption of clinical protocols that adjust doses and schedules based on patient frailty rather than chronological age, aiming to reduce treatment discontinuations.
Next-Gen Oral Regimens Gain Wider Reimbursement
Fully oral regimens have demonstrated cost-effectiveness by reducing the need for infusion-center visits and hospital stays. England approved acalabrutinib for first-line use after pricing adjustments aligned it with cost-effectiveness benchmarks. Similarly, France granted full reimbursement for zanubrutinib in 2025, citing real-world data that showed a significant reduction in emergency-department visits compared to ibrutinib. However, step-therapy requirements in markets such as Brazil and India have delayed BTK inhibitor treatments by 11–14 months, increasing the disease burden. To address these challenges, manufacturers are implementing tiered pricing strategies and patient-assistance programs to close regional gaps.
Companion Diagnostics and Precision Medicine on the Rise
In 2025, next-generation sequencing panels, such as FoundationOne CDx and Tempus xT, transitioned from research environments to routine use in hematology clinics. The approval of FoundationOne CDx as a companion test for pirtobrutinib enabled the regular identification of BTK C481S and PLCG2 resistance mutations. Medicare’s coverage of the Tempus panel in 2025 further supported adoption, particularly after findings indicated that TP53-mutated patients benefit more from immediate transplantation than prolonged venetoclax treatment.[3]Frontiers in Bioengineering and Biotechnology, “A Quest for Stakeholder Synchronization in the CAR T-Cell Therapy Supply Chain,” frontiersin.org With sequencing costs now below USD 1,000 per panel and turnaround times under a week, the cost advantage of FISH assays is diminishing.
Restraints Impact Analysis*
| RESTRAINT | (~) % IMPACT ON CAGR FORECAST | GEOGRAPHIC RELEVANCE | IMPACT TIMELINE |
|---|---|---|---|
| Therapy cost escalation & payer step-therapy hurdles | -1.3% | Global, acute in middle-income markets lacking universal coverage | Short term (≤ 2 years) |
| Resistance mutations to first-gen BTK inhibitors | -0.8% | Global, concentrated in relapsed/refractory populations | Medium term (2-4 years) |
| Limited specialized oncology capacity in emerging markets | -0.6% | APAC (ex-Japan, Australia), Latin America, Sub-Saharan Africa | Long term (≥ 4 years) |
| Data-privacy concerns in cloud-based genomic diagnostics | -0.4% | EU (GDPR enforcement), North America (state-level laws) | Medium term (2-4 years) |
| Source: Mordor Intelligence | |||
Escalating Therapy Costs and Payer Hurdles in the U.S.
Annual treatment costs for drugs like venetoclax and zanubrutinib have surged to USD 180,000, leading to the implementation of stringent utilization-management policies. By 2025, U.S. commercial insurers required prior authorization for 78% of BTK inhibitor claims, often demanding evidence of del(17p) or TP53 mutations despite broad FDA approvals. In Brazil, private insurance plans mandate patients to complete two lines of chemotherapy before approving acalabrutinib, delaying access to targeted therapy by an average of 11 months and increasing the risk of Richter transformation. In India, the national health scheme excludes BTK inhibitors entirely, forcing 92% of patients to rely on generic chemotherapy, which reduces three-year overall survival rates to 61% compared to 89% for targeted regimens. While tiered pricing and volume-based government tenders provide partial solutions, they have not fully addressed the access disparity.
Resistance Mutations Emerge in First-Generation BTK Inhibitors
Covalent BTK inhibitors lose effectiveness when C481S or PLCG2 mutations develop, a challenge that intensifies in heavily pretreated patients. A 2024 study revealed that 68% of patients who failed ibrutinib exhibited C481S mutations, with resistance typically emerging after 32 months in frontline treatment settings. Pirtobrutinib successfully restored responses in 73% of cases with the C481S mutation, but secondary T474I mutations limited its durability to approximately one year. As treatment options narrow, a subset of patients resistant to three drug classes exhausts available therapies within five years. The industry is actively pursuing combination therapies and novel signaling targets, but each advancement introduces additional costs and potential toxicity.
*Our forecasts treat driver/restraint impacts as directional, not additive. The impact forecasts reflect baseline growth, mix effects, and variable interactions.
Segment Analysis
By Therapy Class—Immunotherapy Momentum
Immunotherapy and cell therapy are projected to grow at an 8.10% CAGR through 2031, while targeted agents accounted for 46.35% of sales in 2025. In the chronic lymphocytic leukemia therapy market, BTK and BCL-2 inhibitors generated USD 7.2 billion in 2025. However, their market share is declining as bispecific antibodies and allogeneic CAR-T products progress to late-stage trials. The use of bendamustine-rituximab in the U.S. decreased by 34% from 2023 to 2025 due to updated guidelines that relegated chemotherapy to an alternative option. The approval of the acalabrutinib-venetoclax combination in February 2026, which achieved a 67% undetectable MRD rate in patients after 12 months, highlights the shift towards chemotherapy-free treatments and sets a high efficacy standard for future competitors.


By Diagnostics Technology—NGS Gains Ground
Flow cytometry, valued for its quick four-hour turnaround and reimbursement advantages, accounted for 44.23% of diagnostics revenue in 2025. However, next-generation sequencing (NGS) is gaining traction, expanding at a 7.60% CAGR and driving growth in the chronic lymphocytic leukemia diagnostics market. NGS panels, which analyze 300–648 genes, identify mutations in TP53, NOTCH1, SF3B1, and ATM, influencing therapy decisions and trial eligibility, thereby reshaping treatment strategies. A 22% detection rate for TP53 mutations in 2025, double that of traditional methods, underscores the clinical importance of broader panels. While cytogenetics continues to play a niche role in detecting large chromosomal deletions, declining sequencing costs and increased payer coverage are shifting the economic balance in favor of NGS.
By Route of Administration—Oral Dominance
Oral therapies represented 51.23% of the market in 2025 and are expected to grow at a 7.45% CAGR. Patients prefer the convenience of home administration, and payers are increasingly promoting it to reduce infusion center costs, driving demand in the chronic lymphocytic leukemia market. Acalabrutinib, zanubrutinib, and venetoclax dominated oral sales in 2025, accounting for 89% of the total, reflecting the market's preference for once- or twice-daily dosing.
Intravenous therapies hold a 42% market share, supported by anti-CD20 monoclonals and emerging bispecific antibodies that require close monitoring for cytokine release syndrome. Subcutaneous and intramuscular routes, primarily used for supportive-care agents, account for a modest 7% share. With pipeline innovations favoring orally bioavailable drugs and time-limited regimens, the market share for infusion products in chronic lymphocytic leukemia is expected to drop below 35% by 2031.
By Line of Therapy—Relapsed Settings Fuel Demand
First-line treatments accounted for 52.45% of revenue in 2025, but relapsed or refractory lines are projected to grow at a 6.95% CAGR as resistance-targeted therapies emerge. The chronic lymphocytic leukemia market for second-line therapies is expanding, driven by pirtobrutinib's 73% overall response rate in BTK-resistant cases, despite a median response duration of 22 months before secondary mutations develop. Triple-class refractory patients, while representing only 6% of prevalence, account for 14% of spending, driving demand for cell therapies and bispecifics.
More treatment-naïve patients are achieving five-year disease control with therapies like acalabrutinib-venetoclax or zanubrutinib monotherapy. This progress delays disease progression and reduces the pool of patients eligible for salvage treatments. Consequently, companies are focusing on fixed-duration regimens to sustain drug volumes while enhancing patient quality of life.
By End User—Retail Channels Rise
Hospitals and academic centers captured 41.54% of revenue in 2025, driven by their role in managing complex infusions and diagnostics. However, retail and online pharmacies are expanding rapidly, with an 8.80% CAGR, as oral drug dispensing shifts away from traditional infusion suites. Specialty clinics, holding a 31% market share, oversee initiation protocols like the venetoclax ramp-up, which requires weekly lab monitoring to mitigate tumor lysis syndrome. Diagnostics laboratories, currently holding a 16% share, are consolidating under national contracts that bundle testing with therapy authorizations.
Retail pharmacies, which captured 12% of the market in 2025, are enhancing their offerings with adherence counseling and financial-aid navigation. As value-based oncology models prioritize outcomes over volume, payers are increasingly directing prescriptions to retail networks equipped with digital adherence support, pressuring hospital pharmacies to diversify and expand their services.
Geography Analysis
In 2025, North America, accounting for 39.67% of sales, benefits from Medicare policies that bypass step-therapy requirements and features robust oncology networks that quickly adopt new FDA-approved treatments. The United States led the region, contributing 88% of its revenue, with 18,400 new cases reported in 2025 and a median diagnosis age of 72 years. While Canada's public healthcare system ensures reimbursement for targeted therapies within six months of approval, Mexico's limited coverage drives 76% of its patients toward generic chemotherapy.
Europe, representing 32% of 2025's revenue, is driven by its five largest economies, which generate 71% of the region's turnover. Germany leads in per-capita BTK usage, while Italy and Spain impose annual spending caps on BTK therapies, restricting access to high-risk genomic subsets until the expected availability of generic ibrutinib in 2027. The United Kingdom experienced accelerated adoption after a confidential 35% discount on acalabrutinib for first-line treatment expanded access to an additional 3,200 patients annually.
Asia-Pacific is projected to grow at a CAGR of 8.50% through 2031. China included zanubrutinib in its National Reimbursement Drug List at an annual cost of USD 28,000, driving a significant increase in prescriptions, with the therapy accounting for 28% of all new BTK initiations in Q1 2026. Additionally, population aging contributed to an 18% rise in new cases since 2020, resulting in 12,500 new cases in 2025. In India and Southeast Asia, emerging healthcare networks are introducing genomic testing and day-care infusion centers, gradually addressing infrastructure challenges. The Middle East and Africa, along with South America, each account for approximately 7% of global revenue. Wealthy Gulf states provide funding for BTK inhibitors for their citizens, while other countries in these regions rely on chemotherapy, awaiting reductions in biosimilar prices.

Competitive Landscape
AbbVie, AstraZeneca, and BeiGene collectively held a majority share of the chronic lymphocytic leukemia market, reflecting a moderately concentrated market landscape. AbbVie’s venetoclax continues to dominate the BCL-2 inhibition space, although competitive pressures are expected to intensify as patent expirations approach in 2029. AstraZeneca differentiates itself through strategic partnerships, combining acalabrutinib with complementary genomic testing and leveraging real-world evidence to support potential label expansions. BeiGene strengthens its position with cost-efficient zanubrutinib pricing and region-specific formulations optimized for Asian pharmacokinetics, supported by newly filed patents in 2025.
New entrants are focusing on the immunotherapy segment. Allogene Therapeutics is poised to achieve the first approval for an allogeneic CAR-T therapy, cema-cel, targeting relapsed or refractory CLL by Q2 2027, with a specific focus on the 6% triple-class refractory patient segment. Adaptive Biotechnologies is integrating its clonoSEQ assay as a key trial endpoint, a strategy that could reduce approval timelines by 18 months and reshape evidence requirements. In the diagnostics sector, major players like Illumina and Beckman Coulter are competing on AI-driven platforms. The FDA’s September 2025 draft guidance, which classifies adaptive algorithms as Class III devices, is expected to favor established companies with mature quality-management systems.
Strategic collaborations are becoming increasingly prevalent. In January 2026, AstraZeneca partnered with Foundation Medicine to launch a program offering complimentary FoundationOne CDx panels to U.S. patients starting acalabrutinib treatment. This initiative aims to drive the adoption of precision medicine while channeling patients into ongoing clinical trials. BeiGene is advancing value-based contracts in China by collaborating with local payers, exchanging lower drug prices for guaranteed sales volumes, a model that could influence broader industry practices.
Chronic Lymphocytic Leukemia Industry Leaders
AbbVie Inc
F. Hoffmann-La Roche Ltd
AstraZeneca
BeiGene
Gilead Sciences
- *Disclaimer: Major Players sorted in no particular order

Recent Industry Developments
- February 2026: FDA approved acalabrutinib with venetoclax as the first chemotherapy-free doublet for treatment-naïve CLL, with expectations to capture 40% of new starts by year-end.
- January 2026: AstraZeneca and Foundation Medicine began providing no-cost FoundationOne CDx testing to U.S. acalabrutinib users, accelerating companion-diagnostic adoption.
- August 2025: CMS granted national coverage for Adaptive Biotechnologies’ clonoSEQ MRD test at USD 2,007 per assay, paving the way for routine MRD-guided discontinuation.
- June 2025: NICE endorsed acalabrutinib for first-line use in England after a 35% confidential discount crossed the cost-effectiveness threshold.
- March 2025: Allogene Therapeutics secured FDA RMAT status for cema-cel following 65% complete responses in heavily pretreated patients.


Research Methodology Framework and Report Scope
Market Definitions and Key Coverage
According to Mordor Intelligence, we frame the chronic lymphocytic leukemia (CLL) market as all branded and generic prescription drugs specifically approved or used off-label for CLL across 17 tracked countries, measured at ex-factory values and converted to constant 2024 USD.
Scope Exclusion: supportive care agents, diagnostics, inpatient procedure revenues, and investigational drugs without commercial sales remain outside scope.
Segmentation Overview
- By Therapy Class
- Chemotherapy
- Targeted Therapy (BTK, BCL-2, PI3K, others)
- Immunotherapy & Cell Therapy (mAbs, CAR-T, bispecifics)
- Combination Regimens
- By Diagnostics Technology
- Flow Cytometry
- Molecular Genetic Tests (NGS, PCR panels)
- FISH & Cytogenetics
- Immunohistochemistry & Others
- By Route of Administration
- Oral
- Intravenous
- Subcutaneous / Intramuscular
- By Line of Therapy
- First-Line / Treatment-Naive
- Second-Line
- Relapsed / Refractory
- By End User
- Hospitals & Academic Medical Centers
- Specialty Oncology Clinics
- Diagnostic Laboratories
- Retail & Online Pharmacies
- By Geography
- North America
- United States
- Canada
- Mexico
- Europe
- Germany
- United Kingdom
- France
- Italy
- Spain
- Rest of Europe
- Asia-Pacific
- China
- India
- Japan
- South Korea
- Australia
- Rest of Asia-Pacific
- Middle East & Africa
- GCC
- South Africa
- Rest of Middle East and Africa
- South America
- Brazil
- Argentina
- Rest of South America
- North America
Detailed Research Methodology and Data Validation
Primary Research
We then interviewed hematologists, oncology pharmacists, payers, and patient-advocacy leads in North America, Europe, and key Asia-Pacific markets. Their insights on real-world treatment pathways, BTK-inhibitor switching, and forthcoming guideline changes guided assumption tuning and bridged gaps left by published data.
Desk Research
Our analysts gathered baseline inputs from open datasets such as GLOBOCAN incidence files, the US SEER registry, Eurostat hospital discharge records, and EMA and FDA approval databases, which helped anchor treated-patient pools and launch timelines. Complementary signals were pulled from trade groups like the International Agency for Research on Cancer, peer-reviewed journals in Blood and Leukemia, company 10-Ks, and curated financial feeds on D&B Hoovers and Factiva. The mix lets us map epidemiology, therapy uptake, and average selling price corridors across each region. This list is illustrative; many other sources informed data collection, cross-checks, and clarification.
Market-Sizing & Forecasting
A top-down epidemiology build links prevalence, diagnosis, treatment penetration, and dosing intensity; results are compared with selective bottom-up snapshots from manufacturer revenue splits and channel checks to fine-tune totals. Variables monitored include incident CLL cases, median therapy duration, branded-to-generic price erosion, share of oral regimens, pipeline launch cadence, and regional reimbursement ceilings. Forecasts employ multivariate regression on these drivers, and scenario stress tests adjust for faster biosimilar entry where expert consensus diverges.
Data Validation & Update Cycle
Every model pass goes through variance scans against historical sales curves and independent prevalence studies before senior review. We refresh figures annually, revisiting mid-cycle if material events, such as major approvals, safety withdrawals, or currency shocks, shift the outlook, so clients always receive the latest vetted baseline.
Why Our Chronic Lymphocytic Leukemia Baseline Commands Reliability
Published CLL estimates often differ because firms choose wider oncology scopes, fold in hospital costs, or refresh on uneven schedules. Mordor's disciplined country set, drug-only lens, and yearly updates keep our number tightly aligned with what payers actually reimburse.
Key gap drivers include differing geographic baskets, whether pipeline sales are front-loaded, and how aggressively generic erosion is modeled versus branded price holds.
Benchmark comparison
| Market Size | Anonymized source | Primary gap driver |
|---|---|---|
| USD 5.42 Bn (2025) | Mordor Intelligence | - |
| USD 5.70 Bn (2024) | Global Consultancy A | Focuses on eight high-income nations, omitting emerging Asia demand |
| USD 8.61 Bn (2024) | Research Publisher B | Blends CLL therapeutics with leukemia diagnostics revenue streams |
| USD 14.41 Bn (2024) | Industry Analyst C | Combines drug sales with inpatient care and transfusion costs |
Taken together, the comparison shows that when scope widens beyond drugs or drops key regions, totals swing widely. By centering on clearly defined therapies, transparent variables, and a repeatable annual cycle, Mordor Intelligence delivers a balanced baseline that stakeholders can trust for strategic decisions.


Key Questions Answered in the Report
What is the projected chronic lymphocytic leukemia market size by 2031?
The chronic lymphocytic leukemia market size is expected to reach USD 12.29 billion by 2031, based on Mordor Intelligence estimates.
Which therapy class will grow fastest through 2031?
Immunotherapy and cell therapy are forecast to expand at an 8.10% CAGR, outpacing targeted agents.
How large is the North American share of global revenue?
North America accounted for 39.67% of global revenue in 2025, driven mainly by the United States.
What is the leading route of administration?
Oral formulations led with 51.23% revenue share in 2025 and continue to gain momentum.
Which companies dominate sales?
AbbVie, AstraZeneca, and BeiGene together controlled 58% of revenue in 2025, reflecting moderate market concentration.
What role do companion diagnostics play in CLL care?
FDA-approved NGS panels such as FoundationOne CDx guide therapy selection and are becoming standard practice, accelerating precision medicine uptake.
Page last updated on:


