中东汽车润滑油市场规模
|
|
研究期 | 2015 - 2026 |
|
|
市场容量 (2024) | 1.59 十亿升 |
|
|
市场容量 (2026) | 1.86 十亿升 |
|
|
按车辆类型划分的最大份额 | 乘用车 |
|
|
CAGR (2024 - 2026) | 3.20 % |
|
|
按国家的最大份额 | 伊朗 |
|
|
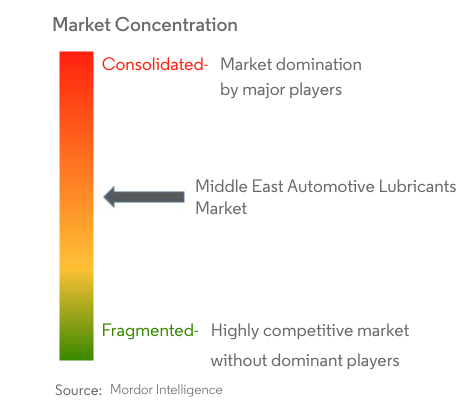
市场集中度 | 高的 |
主要参与者 |
||
|
|
||
|
*免责声明:主要玩家排序不分先后 |
为什么要从我们这里购买?
中东汽车润滑油市场分析
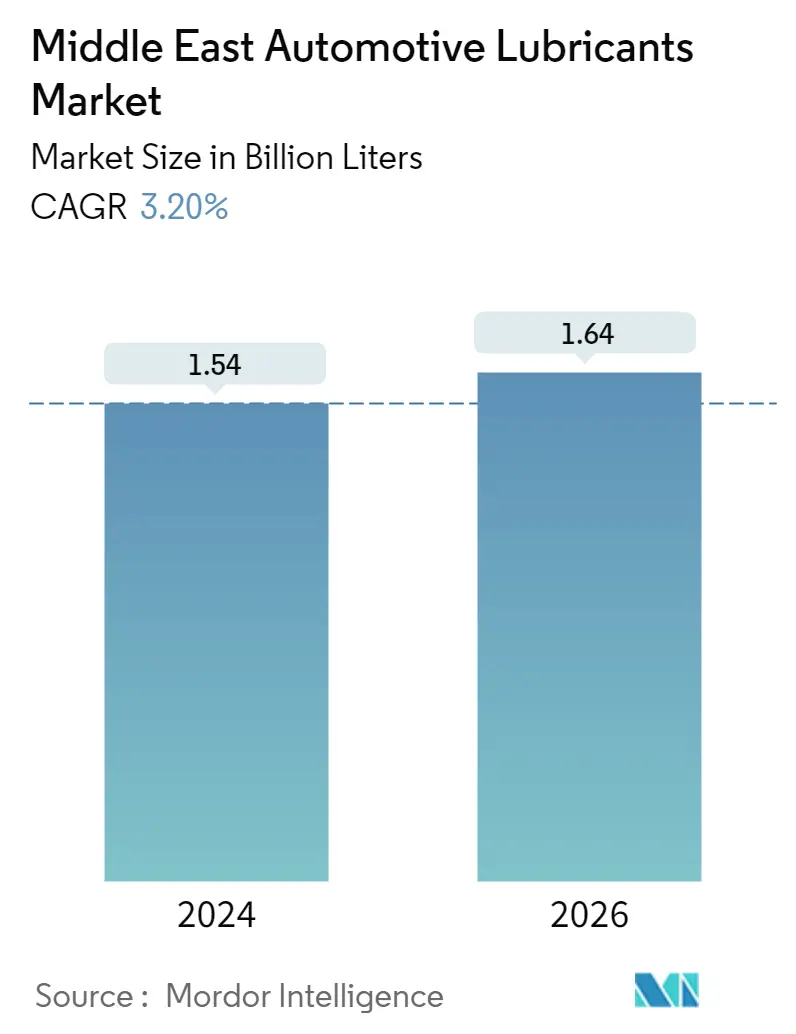
中东汽车润滑油市场规模预计到 2024 年为 15.4 亿升,预计到 2026 年将达到 16.4 亿升,在预测期内(2024-2026 年)复合年增长率为 3.20%。
- 按车辆类型划分最大的细分市场 - 乘用车:中东拥有大量活跃的乘用车保有量。因此,该行业的润滑油消费量占整个润滑油市场的最大份额。
- 按车型划分最快的细分市场 - 摩托车:自 2020 年以来,伊朗等中东国家的二手摩托车需求激增,这反过来可能会推动摩托车润滑油的消费。
- 最大的国家市场 - 伊朗:伊朗的高润滑油消耗量可归因于该国的车队以及需要大量润滑油使用的车辆平均车龄的增加。
- 增长最快的国家市场 - 土耳其:尽管发生了新冠肺炎 (COVID-19) 大流行,但由于政府大力支持汽车行业,土耳其是中东地区唯一一个销售数据呈正增长的国家。
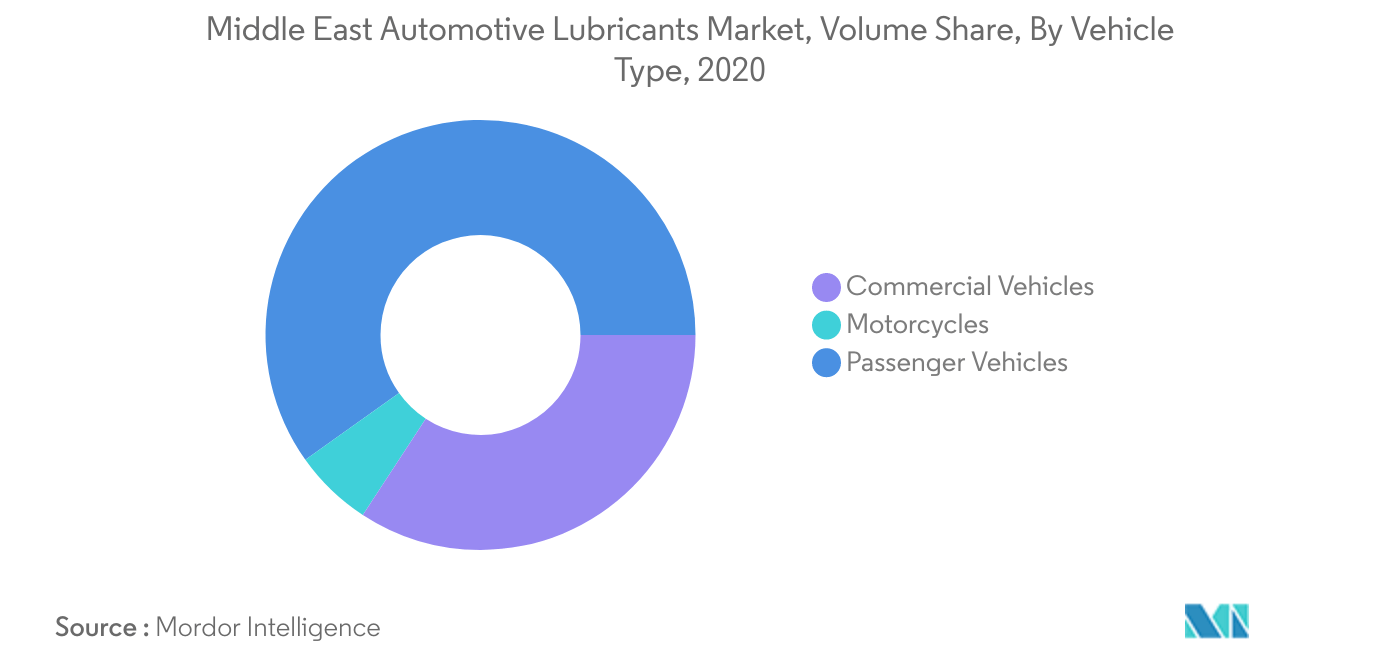
按车辆类型划分最大的细分市场:乘用车
- 在中东地区,2020年乘用车(PV)市场占道路车辆总数的近67%,其次是摩托车和商用车,分别占18.49%和14.45%的份额。
- 2020年汽车润滑油消费总量中,乘用车细分市场占比最高,为59.85%,其次是商用车细分市场,占比为34.22%。同年,为遏制新冠肺炎 (COVID-19) 而实施的旅行限制严重影响了这些车辆的使用及其润滑油消耗。
- 2021-2026年期间,摩托车润滑油领域预计复合年增长率最高,复合年增长率为3.63%。乘用车销售的复苏以及与 COVID-19 相关的旅行限制的放松可能是推动这一趋势的关键因素。
要了解主要趋势,请下载样本报告
下载PDF
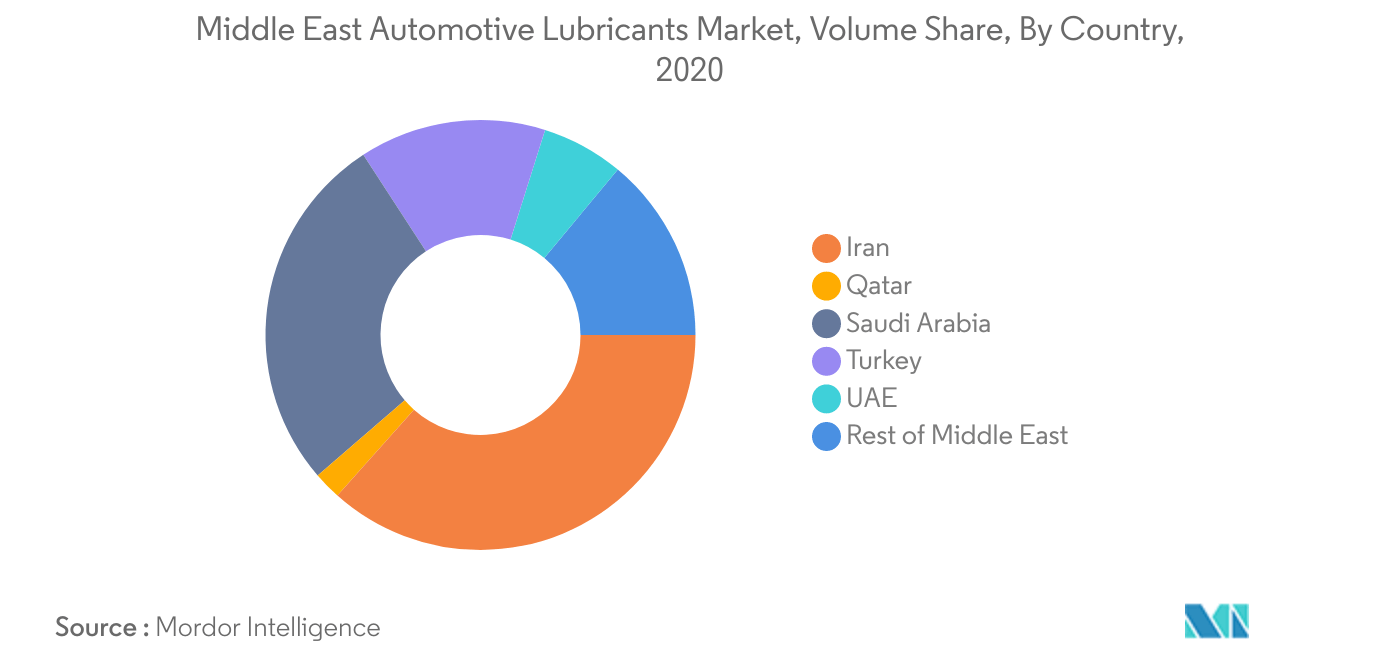
最大的国家:伊朗
- 在中东汽车润滑油市场,伊朗消费量最高,其次是沙特阿拉伯和土耳其。 2020年,伊朗约占该地区汽车润滑油消费总量的36.5%,而沙特阿拉伯和土耳其的份额分别约为27.15%和14.03%。
- 2020年,COVID-19大流行对该地区许多国家的汽车润滑油消费产生了重大影响。阿联酋受影响最大,2019-2020年下降12.47%,而土耳其受影响最小,汽车润滑油消费下降6.38%。
- 2021-2026年期间,土耳其可能成为增长最快的润滑油市场,因为消费量可能会增长,复合年增长率为6.29%,其次是阿联酋和卡塔尔,预计复合年增长率为3.01%和2.89 %, 分别。
要了解地理趋势,请下载样本报告
下载PDF
中东汽车润滑油行业概况
中东汽车润滑油市场适度整合,前五名企业占据47.35%。该市场的主要参与者包括 Behran 石油公司、BP PLC(嘉实多)、Petromin Corporation、荷兰皇家壳牌 PLC 和 TotalEnergies(按字母顺序排列)。
中东汽车润滑油市场领导者
Behran Oil Company
BP PLC (Castrol)
Petromin Corporation
Royal Dutch Shell PLC
TotalEnergies
*免责声明:主要玩家排序不分先后
需要更多关于市场参与者和竞争对手的细节吗?
下载PDF
中东汽车润滑油市场新闻
- 2022 年 1 月:自 4 月 1 日起,埃克森美孚公司由三个业务线组成:埃克森美孚上游公司、埃克森美孚产品解决方案和埃克森美孚低碳解决方案。
- 2021 年 9 月:道达尔土耳其 Pazarlama 和日产土耳其签署了一项新安排,根据该安排,日产土耳其将在未来三年内向其土耳其客户提供日产原装发动机油。 Nissan 正品发动机油是在 TotalEnergies 润滑油专业知识的帮助下生产的。
- 2021 年 7 月:Taajeer 集团和 APSCO 同意建立长期战略关系,在王国各地的Mobil Service地点为 MG 汽车提供发动机机油更换服务。
中东汽车润滑油市场报告 - 目录
1. 执行摘要和主要发现
2. 介绍
- 2.1 研究假设和市场定义
- 2.2 研究范围
- 2.3 研究方法论
3. 主要行业趋势
- 3.1 汽车行业趋势
- 3.2 监管框架
- 3.3 价值链和分销渠道分析
4. 市场细分
-
4.1 按车型分类
- 4.1.1 商务车辆
- 4.1.2 摩托车
- 4.1.3 乘用车
-
4.2 按产品类型
- 4.2.1 发动机油
- 4.2.2 润滑脂
- 4.2.3 液压油
- 4.2.4 变速箱油和齿轮油
-
4.3 按国家/地区
- 4.3.1 伊朗
- 4.3.2 卡塔尔
- 4.3.3 沙特阿拉伯
- 4.3.4 火鸡
- 4.3.5 阿联酋
- 4.3.6 中东其他地区
5. 竞争格局
- 5.1 关键战略举措
- 5.2 市场份额分析
-
5.3 公司简介
- 5.3.1 ADNOC
- 5.3.2 Behran Oil Company
- 5.3.3 BP PLC (Castrol)
- 5.3.4 ExxonMobil Corporation
- 5.3.5 FUCHS
- 5.3.6 Iranol Oil Company
- 5.3.7 Petrol Ofisi
- 5.3.8 Petromin Corporation
- 5.3.9 Royal Dutch Shell PLC
- 5.3.10 Sepahan Oil Company
- 5.3.11 TotalEnergies
6. 附录
- 6.1 附录-1 参考文献
- 6.2 附录-2 图表清单
7. 润滑油公司首席执行官面临的关键战略问题
中东汽车润滑油行业细分
按车型分类
| 商务车辆 |
| 摩托车 |
| 乘用车 |
按产品类型
| 发动机油 |
| 润滑脂 |
| 液压油 |
| 变速箱油和齿轮油 |
按国家/地区
| 伊朗 |
| 卡塔尔 |
| 沙特阿拉伯 |
| 火鸡 |
| 阿联酋 |
| 中东其他地区 |
| 按车型分类 | 商务车辆 |
| 摩托车 | |
| 乘用车 | |
| 按产品类型 | 发动机油 |
| 润滑脂 | |
| 液压油 | |
| 变速箱油和齿轮油 | |
| 按国家/地区 | 伊朗 |
| 卡塔尔 | |
| 沙特阿拉伯 | |
| 火鸡 | |
| 阿联酋 | |
| 中东其他地区 |
市场定义
- 车辆类型 - 汽车润滑油市场包括乘用车、商用车和摩托车。
- 产品类型 - 出于本研究的目的,考虑了发动机油、变速箱油、齿轮油、液压油和润滑脂等润滑油产品。
- 服务补充 - 在该研究中,在计算每辆车的润滑油消耗量时考虑了服务/维护补充。
- 工厂填充 - 该研究正在考虑为新生产的车辆首次添加润滑油。
研究方法
Mordor Intelligence在所有报告中都遵循四步方法。
- 步骤1:识别关键变量: 从一组相关变量和因素中,基于桌面研究和文献综述,选择与特定产品细分和国家相关的可量化关键变量(行业和外部);以及主要专家输入。这些变量进一步通过回归建模(如有必要)进行确认。
- 步骤2:建立市场模型: 为了建立一个强大的预测方法,将在第1步中确定的变量和因素与可用的历史市场数字进行测试。通过迭代过程,设置了市场预测所需的变量,并且该模型是基于这些变量构建的。
- 步骤3:验证和完成: 在这一重要步骤中,通过对所研究市场的广泛初级研究专家网络,验证了所有市场数字,变量和分析师呼叫。受访者被选中跨级别和功能,以产生所研究市场的整体画面。
- 步骤4:研究产出: 辛迪加报告,定制咨询任务,数据库和订阅平台。
如有任何与研究方法相关的查询,请单击此处安排与我们的分析师通话。
问个问题

80% 的客户寻求定制报告。 您希望我们如何为您量身定制?


