
Market Overview
| Study Period | 2020 - 2031 |
|---|---|
| Forecast Data Period | 2026 - 2031 |
| Historical Data Period | 2020 - 2024 |
| Market Size (2026) | USD 47.99 Billion |
| Market Size (2031) | USD 58.70 Billion |
| Growth Rate (2026 - 2031) | 4.12 % |
| Market Concentration | Medium |
Major Players *Disclaimer: Major Players sorted in no particular order Image © Mordor Intelligence. Reuse requires attribution under CC BY 4.0. | |

Indonesia Residential Real Estate Market Analysis by Mordor Intelligence
Indonesia residential real estate market size reached USD 47.99 billion in 2026 and is forecast to reach USD 58.7 billion by 2031, reflecting a 4.12% CAGR across the period. Demand is being supported by government-borne VAT relief on eligible transactions, large-scale subsidized mortgages for low-income buyers, and steady end-user absorption led by bank financing. Structural constraints continue to moderate conversion in the upper tiers, including urban land scarcity, higher development costs, and the low penetration of mortgage credit relative to peer economies. Vertical formats are gaining traction around transit nodes as cities densify, while suburban townships keep landed demand resilient where land remains available at workable prices. Digital mortgage platforms and automated underwriting are compressing approval timelines, which helps first-time buyers but does not yet offset broader affordability pressures.
Key Report Takeaways
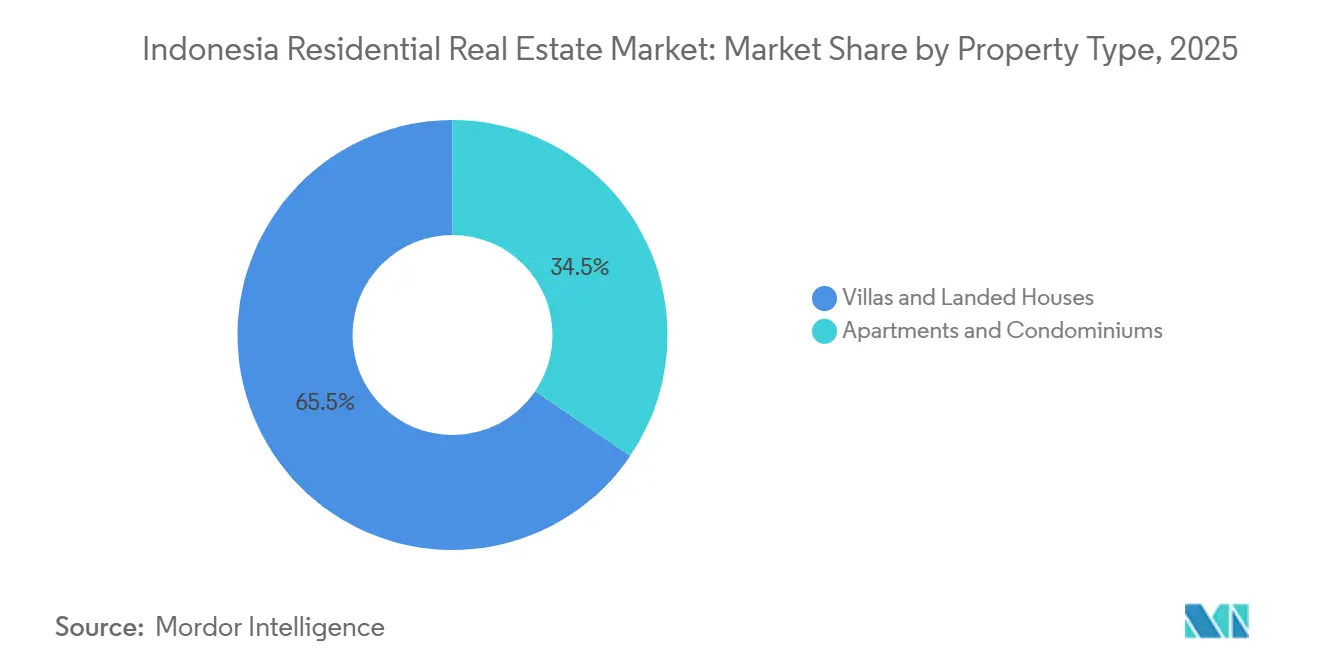
- By property type, villas and landed houses led with 65.5% of revenue share in 2025, while apartments are projected to expand at a 4.31% CAGR through 2031.
- By price band, the mid-market segment accounted for 47% of 2025 revenues, while the affordable tier is advancing at a 4.26% CAGR through 2031.
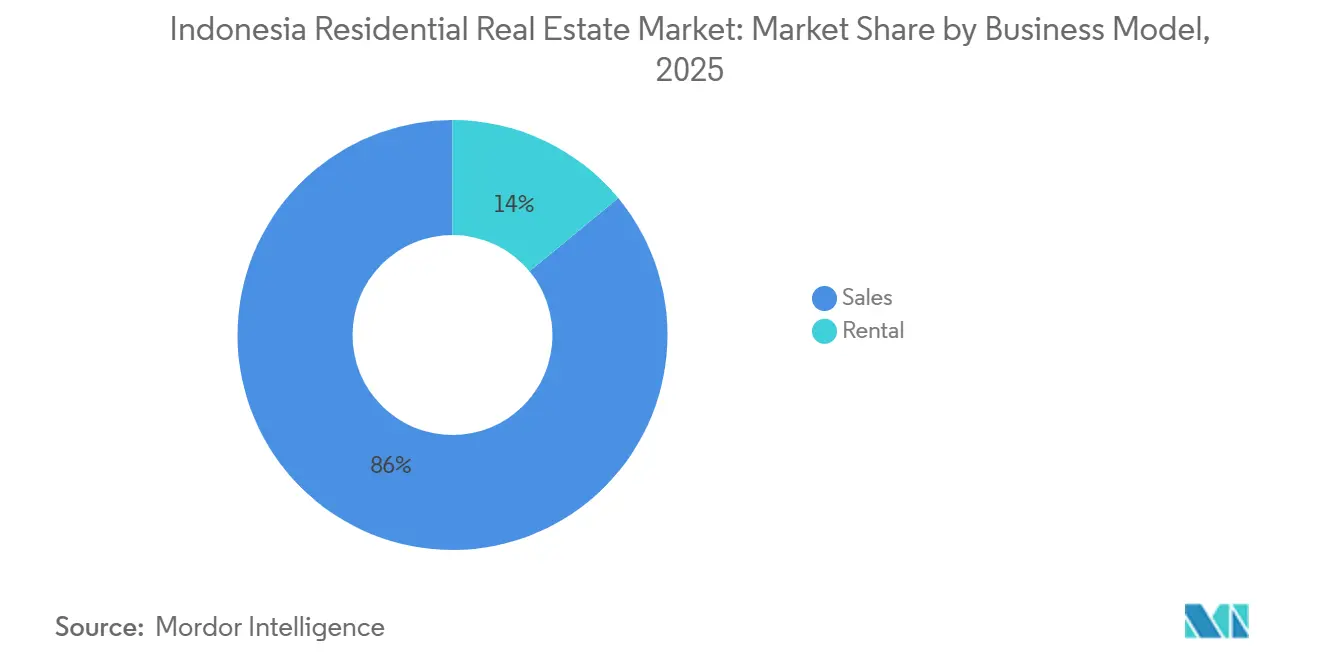
- By business model, sales captured 86% of transactions in 2025, while the rental segment is the fastest growing at a 4.40% CAGR through 2031.
- By mode of sale, secondary or resale units held a 63% share in 2025, while primary new-build transactions are growing at a 4.35% CAGR through 2031.
- By geography, Java retained a 39% share in 2025, while Kalimantan is the fastest-growing region at a 4.43% CAGR through 2031.
Note: Market size and forecast figures in this report are generated using Mordor Intelligence’s proprietary estimation framework, updated with the latest available data and insights as of January 2026.
Indonesia Residential Real Estate Market Trends and Insights
Drivers Impact Analysis*
| Drivers | (~) % Impact on CAGR Forecast | Geographic Relevance | Impact Timeline |
|---|---|---|---|
| Subsidized KPR programs underpin affordable demand volumes | +1.2% | National, spill-over strongest in West Java, Central Java, South Sulawesi | Medium term (2-4 years) |
| Mortgage financing dominance sustains end-user absorption | +0.9% | National | Medium term (2-4 years) |
| Extended VAT incentives catalyze ready stock and mid-market demand | +0.8% | National, with early gains in Greater Jakarta, Surabaya, Bandung | Short term (≤ 2 years) |
| Program Sejuta Rumah scale supports supply momentum and backlog reduction | +0.7% | National, the highest concentration in West Java, Central Java, East Java | Long term (≥ 4 years) |
| IKN Nusantara housing PPP pipeline unlocks Kalimantan demand | +0.5% | APAC core: East Kalimantan, spill-over to Balikpapan, Samarinda | Long term (≥ 4 years) |
| Digital KPR ecosystems improve approval and closing rates | +0.3% | National, early adopters in urban Jakarta, Surabaya | Short term (≤ 2 years) |
| Source: Mordor Intelligence | |||


Subsidized KPR Programs Anchor Affordable Volumes Despite Allocation Gaps
Subsidized KPR Programs Anchor Affordable Volumes Despite Allocation Gaps. The FLPP scheme distributed a record 278,868 subsidized mortgages in 2025 valued at IDR 34.64 trillion, though this met only 79.68% of the 350,000-unit target, which highlights execution bottlenecks in channels and approvals. Distribution was broad across 33 provinces, with concentration in West Java, Central Java, and South Sulawesi as urbanization corridors drove both supply and demand. Borrowers benefit from fixed 5% rates and long tenors, which stabilize monthly obligations for first-time buyers and low-income households. The World Bank recommends better alignment with actual market structure through support for self-build activity and broader inclusion of informal workers who are underrepresented in current quotas. Bank partners have committed quota delivery for 2026, which keeps a floor under affordable volumes while process improvements move forward.[1]https://www.worldbank.org/ext/en/home
Mortgage Financing Dominance Sustains End-User Absorption
Mortgages account for the majority of Indonesian home purchases, making bank credit conditions and capital-market funding central to closing rates. The policy rate eased to 5.75% by late 2024, but lending-rate transmission remained slower due to bank funding costs, which tempered the pace of rate cuts in retail mortgages. Regulators extended macroprudential incentives that allow loan-to-value ratios up to 100% for property loans through December 2026, which supports first-time buyer entry and helps inventory clearing. Banks continue to calibrate risk appetite, and a sizeable stock of undisbursed loans signals cautious underwriting alongside demand that is present but selective. The net effect is steady absorption for well-priced units in established corridors, with financing features often determining project-level sales velocity.[2]https://itb.ac.id/
Extended VAT Incentives Drive Ready-Stock Sales and Mid-Market Momentum
Indonesia has extended government-borne VAT relief through December 2027, with a 100% exemption on the first IDR 2 billion portion for homes priced up to IDR 5 billion, a structure that favors ready-to-occupy units and supports cash flow for developers holding completed inventory. The policy design directs benefits toward mid-market buyers and encourages immediate take-up of deliverable stock rather than speculative off-plan purchases. Authorities have signaled a unit-level allocation window intended to maintain transaction momentum while guarding fiscal costs. The multiplier effect of VAT relief supports related industries, including cement, steel, fixtures, and furniture, which broadens the economic benefit of each home purchase. Developers active in major townships have publicly linked presales traction to VAT relief, reinforcing its near-term role in converting inquiry pipelines into completed transactions.
Program Sejuta Rumah Drives Supply Momentum and Backlog Reduction
The Program Sejuta Rumah maintained delivery tempo into 2024 with more than 600,000 units reported by end-July, the majority serving low-income communities through various funding channels and developer participation. The program’s tripartite design brings together the government, banks, and developers, which aligns infrastructure support, mortgage liquidity, and construction capacity. This structure helps reduce the qualitative housing deficit while anchoring private-sector activity in the affordable segment. Continued execution supports regional dispersion of supply, especially where urban demand has outpaced formal stock. Bank partners have emphasized coordination on quotas and documentation to limit slippages and keep annual targets in reach.
Restraints Impact Analysis*
| Restraints | (~) % Impact on CAGR Forecast | Geographic Relevance | Impact Timeline |
|---|---|---|---|
| Urban land scarcity, high land costs, and permitting and infrastructure frictions elevate development costs | -0.9% | National, acute in Greater Jakarta, Surabaya, Bali | Medium term (2-4 years) |
| Persistent affordability and backlog constraints cap mid and upper-tier conversion | -0.7% | National, acute in DKI Jakarta, East Java | Long term (≥ 4 years) |
| Subsidized KPR allocation shortfalls versus demand constrain affordable throughput | -0.5% | National, highest pressure in West Java, Central Java, Banten | Medium term (2-4 years) |
| Demand sensitivity to rates with periodic sales moderation in smaller-unit segments | -0.4% | National | Short term (≤ 2 years) |
| Source: Mordor Intelligence | |||
Urban Land Scarcity and Permitting Frictions Drive Cost Escalation
Major urban centers face limited land availability and fragmented ownership, which delays site assembly and increases project costs. The transition to the new building approval regime has required local adoption, and uneven implementation has contributed to differing approval timelines across jurisdictions. Infrastructure deficits around water, electricity, and roads raise off-site capex needs for projects in growth corridors, which compress margins, especially in affordable units. The national infrastructure plan for 2025 to 2029 carries a large financing gap, and this gap can slow the pace of enabling works that housing depends on. These factors combine to push more developers toward peripheral locations, which then require heavier investment in connectivity to sustain buyer interest.
Affordability Constraints and Housing Backlog Limit Upper-Market Conversion
The national housing backlog stands at 12.7 million units and is driven mostly by quality deficits, with the majority of households needing improvements rather than entirely new construction. Mortgage penetration remains low compared to peers, and this limits the pool of bankable buyers who can absorb mid to upper-tier stock. Strict program eligibility rules also leave out families who do not fit income documentation norms, which narrows the addressable segment for subsidized mortgages. Academic studies point to higher stress among renters in large cities, as rent volatility and weak protections limit financial stability. Balanced-housing obligations aim to increase inclusion, but uneven enforcement and substitution mechanisms can reduce the number of affordable units built within integrated projects.
*Our forecasts treat driver/restraint impacts as directional, not additive. The impact forecasts reflect baseline growth, mix effects, and variable interactions.
Segment Analysis
By Property Type: Vertical Demand Lifts Apartment Growth Above Landed Dominance
Villas and landed houses held 65.5% of the 2025 base, giving this format the largest Indonesia residential real estate market share as developers continue to expand suburban townships with ample land banks. Apartments are the fastest-growing with a projected 4.31% CAGR through 2031 as urban density and transit-led development patterns steer both supply and buyer preferences toward vertical living near MRT, LRT, and commuter rail lines. Transit-oriented corridors have posted stronger absorption and tighter inventory churn compared with off-corridor stock, which supports higher sales velocity for well-located projects. Sales performance in select apartment submarkets that sit on rail corridors remains resilient due to access to employment hubs and daily mobility benefits. Government planning for more vertical units aims to widen the affordable apartment base, which can better align urban housing supply with land constraints.
The landed format remains a staple of Indonesian homeownership culture, and it benefits from large integrated townships that deliver schools, retail, and jobs alongside housing. Developers with long-term land banks in Greater Jakarta’s outer ring continue to launch phases that capture upgrading households and multi-generational buyers. The Indonesia residential real estate market size for apartment formats is poised to expand at a 4.31% CAGR as end-users trade lot size for access, security, and on-site amenities, especially in urban cores. Price discovery and absorption remain uneven across micro-markets, but projects next to rail stations and in mixed-use precincts have clearer demand visibility. Over time, the format mix is likely to balance further as vertical communities mature and as transit extensions improve last-mile access to jobs and services.


By Price Band: Affordable Surge Challenges Mid-Market Leadership
The mid-market band, defined by homes priced between IDR 1 billion and IDR 5 billion, captured 47% of 2025 revenue, positioning it as the largest slice of the Indonesia residential real estate market. The affordable segment, with prices under IDR 1 billion, is the fastest-growing with a 4.26% CAGR through 2031 as subsidized FLPP quotas and complementary credit programs support first-time buyer demand. The government’s credit initiatives, including subsidized mortgage interest and contractor financing through designated programs, help reduce the total cost of acquisition for qualifying households. Developers have tilted launches toward the IDR 1 to 5 billion range to align with fiscal incentives and the broadest buyer pool, which keeps mid-market absorption steady. Company disclosures show presales skewed toward mid-market bands as developers manage construction inflation and supply chain costs to maintain affordability.
Affordable housing momentum is tempered by allocation shortfalls and documentation requirements that screen out informal workers, although policy discussions continue on widening access. The Indonesia residential real estate market size at the lower price bands is supported by long-term fixed rates and low down payments for eligible borrowers, which stabilizes monthly costs and reduces credit risk. Mid-market conversion depends on VAT relief and mortgage offers, while luxury segments remain more selective and sensitive to tax treatment and macro volatility. Developers have redirected capital from high-end projects to more affordable and mid-income stock in secondary cities with improved connectivity. The Indonesia residential real estate industry will continue to see a two-speed pattern where subsidized supply moves with quotas while mid-market performs in corridors with strong transport and employment anchors.
By Business Model: Rentals Climb as Ownership Constraints Bite
Sales transactions accounted for 86% of 2025 activity, retaining the largest share of the Indonesia residential real estate market as cultural preferences and subsidized mortgages support homeownership. Rentals are the fastest-growing with a 4.40% CAGR as visa policy changes, flexible living needs, and affordability constraints encourage leasing, especially in urban cores and tourism-linked zones. Serviced apartment occupancy tracked in Jakarta shows a stable demand base as tenants value flexibility and proximity to work and amenities. Gross yields in select tourist submarkets remain attractive, which sustains investor interest in lease-driven formats alongside short-stay operations. Developers with integrated portfolios capture recurring rental income from retail and hospitality assets that complement residential sales cycles.
The Indonesia residential real estate market benefits from an improving digital mortgage ecosystem, but mortgage penetration remains low relative to peers, which sustains a larger rental cohort in key cities. Purpose-built rental remains underdeveloped, suggesting room for institutional-grade leasing products as regulations evolve and demand deepens. Lenders’ focus on credit quality and stable cash flows favors owner-occupier sales where underwriting is straightforward and policy backstops exist. As transit networks expand and urban regeneration advances, professionally managed rental communities are likely to gain traction near employment nodes. The Indonesia residential real estate industry will continue to balance ownership demand with growing leasing preferences in corridors where price-to-income gaps remain wide.
By Mode of Sale: Primary Sales Accelerate Against Resale Incumbency
Secondary or resale homes held a 63% share of 2025 transaction volume, making it the largest mode in the Indonesia residential real estate market. Primary new-build sales are the fastest-growing, with a 4.35% CAGR, as VAT relief applies to eligible new inventory and developers deploy presale plans to ease cash outlays. Policy design steers benefits toward properties with formal identity documentation, which helps developers convert ready stock and under-construction units. As a result, presale campaigns in integrated townships channel incentives into higher take-up and cash collection during construction. Buyers weigh the certainty of completed titles in the resale market against incentives and payment flexibility in the primary market.
Liquidity in the resale market can be uneven due to pricing opacity, while primary launches set clearer price points backed by marketing and financing partnerships. The Indonesia residential real estate market size for primary sales benefits from subsidized mortgage quotas and bank partnerships that align documentation and approvals at scale. Academic research shows a large share of cash transactions in Indonesia, which shapes holding periods and resale behavior. The balance between primary and secondary will continue to reflect incentive frameworks, bank underwriting, and the timing of infrastructure that unlocks new townships. Over the forecast period, developers are expected to keep prioritizing inventory turn and cash flow management with launch pacing that tracks policy windows.
Geography Analysis
Java retained a 39% share in 2025, giving it the largest Indonesia residential real estate market share due to the scale of Greater Jakarta and the strength of manufacturing and services corridors. Land scarcity and higher prices in central urban areas continue to push more buyers toward satellites and second-tier cities with upgraded transport links, including high-speed rail and toll-road improvements. Developers have increased focus on suburban nodes with schools and retail anchors to maintain sales momentum with families and upgraders. Mid-market formats dominate, and presales tend to be strongest where transit connectivity reduces commute times and where social infrastructure is mature. Policymakers continue to reinforce transport investments that tie commuter belts more closely to employment centers.
Outside Java, Sumatra’s larger cities offer affordability advantages alongside rising retail and hospitality investments that create mixed-use catchments. Developers with diversified footprints report steady unit turnover in markets where price points align with local incomes and mortgage approvals are predictable. In Kalimantan, the IKN Nusantara program is catalyzing housing investments with a PPP pipeline focused on civil servant housing and supporting services. Early stages target core-government functions and main corridors, which then drive residential demand in adjacent cities that absorb spillover. Inquiry data in East Kalimantan micro-markets reflect renewed interest in entry-level homes as relocation plans progress.
Eastern corridors, including parts of Sulawesi, benefit from subsidized mortgage allocations and domestic migration that favors growing industrial and logistics hubs. Market depth varies by province, but formal supply and mortgage disbursement have increased in line with population growth and job creation. Developers deploy joint operations in select cities to access land and expedite infrastructure, which reduces capital intensity relative to outright purchase. Financing and policy consistency are vital, as annual quotas and approval throughput shape regional sales cycles. Over the forecast horizon, Java’s scale remains decisive, while Kalimantan’s growth rate leads due to the new capital’s buildout and related investments.
Regulatory Landscape
Indonesia residential real estate regulation in the current cycle is being shaped by fiscal measures for demand and administrative digitization for approvals. On the demand side, the Ministry of Finance implemented the government-borne VAT incentive (PPN DTP) through PMK No. 90/2025. The framework provides a 100% VAT incentive on the first IDR 2 billion portion for eligible landed houses and apartment units priced up to IDR 5 billion, and it is being used as a conversion lever for primary sales and ready stock in 2026.
On the supply and program side, the Ministry of Housing and Settlement Areas (Kementerian Perumahan dan Kawasan Permukiman) issued Ministerial Regulation No. 1/2026 to update income thresholds and criteria for low-income households (MBR), and Ministerial Regulation No. 2/2026 to amend financing facilities and the assistance framework for MBR housing. The updates include adjustments that accommodate vertical housing support. For permitting, building approvals continue to migrate to the national SIMBG platform (notably SIMBG version 3.2), with integration to KKPR spatial suitability data and requirements that incorporate Green Building (BGH) standards. This affects timelines, compliance documentation, and developer readiness across provinces.
Value Chain Analysis
Indonesia's residential real estate value chain runs from land procurement and spatial compliance (including KKPR alignment) through permitting (PBG via SIMBG), design and contracting, building materials procurement (cement, steel, fixtures), construction execution, and sales or leasing supported by mortgage origination (KPR), appraisal, and notarization and registration services. Government programs and bank channels form a parallel distribution and financing spine for affordable housing, where eligibility rules, quota allocation, and documentation workflows determine how quickly units convert from bookings to disbursements.
Two recurring bottlenecks are cost and process friction. Institutional analysis points to high logistics costs across the archipelago and materials-price volatility, while sector constraints also include licensing and bureaucracy issues that slow project throughput. On the financing side, policy tools such as subsidized credit and interest support are used to keep affordable pipelines moving. For example, Ministry of Finance Regulation No. 65/2025 introduced interest subsidies for homebuyers and developer interest subsidies linked to the national housing program, reinforcing collaboration among developers, contractors, and banks to meet volume targets.
Competitive Landscape
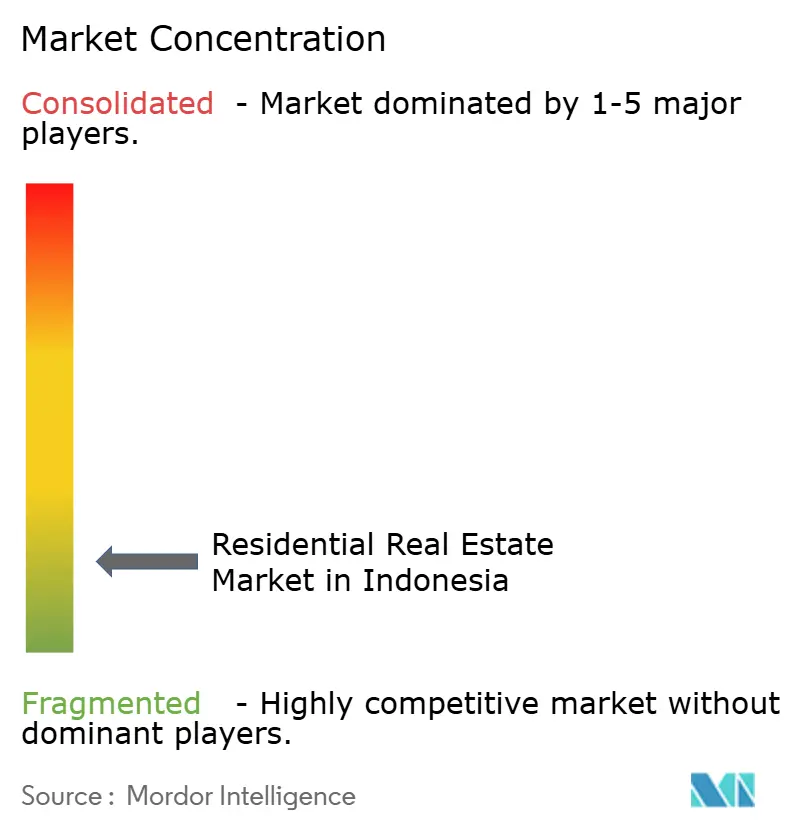
Indonesia residential real estate market competition is moderate. Competition is active among national township developers and diversified groups that combine residential, retail, and hospitality assets in integrated precincts. Large land banks support multi-year launch pipelines, while recurring income from malls and hotels cushions cash flow through sales cycles. State-owned entities have returned as offtakers in subsidized housing, which rebalances the allocation of quotas between commercial developers and the public sector. Joint operations enable mid-tier players to participate in larger townships without full land ownership, which keeps the field competitive and project pipelines broad. Market share is dispersed, with no single developer able to dominate across all regions and price bands.
Strategic moves in 2025 focused on partnerships, balance-sheet optimization, and ESG-linked financing to support green buildings and energy-efficient operations. Developers formed joint ventures for new clusters in commuter corridors that benefit from transit expansions and toll-road connectivity. Debt restructuring and capital-market issuances were used to streamline liabilities and fund construction progress, including selected green loans that align with sustainability roadmaps. Partnerships with foreign contractors brought modular construction know-how and project-management systems into townhouse and apartment clusters. These plays aim to lower costs, improve delivery reliability, and widen buyer pools through brand effects.
Digital mortgage platforms and bank decision engines continue to influence competitive positioning by lowering denial rates and accelerating approvals. Lenders partner with ecosystem platforms that aggregate property listings and integrate KPR application flows, which improves lead conversion on both primary and secondary units. Developers have linked sales rollout calendars to policy windows for VAT relief and subsidized quotas, which concentrate launches in periods with stronger buyer incentives. In parallel, integrated township operators are increasing the share of recurring revenue in their mix, which hedges against cyclical dips in residential sales. These approaches reinforce a segmented but resilient competitive environment across Indonesia’s key housing corridors.
Indonesia Residential Real Estate Industry Leaders
Agung Podomoro Land
Lippo Homes
Sinar Mas Land
Ciputra Group
Duta Anggada Realty
- *Disclaimer: Major Players sorted in no particular order

Market Opportunities and Future Outlook
A visible opportunity is the scaling of government-backed credit and subsidy channels that expand addressable demand in the affordable and lower mid-market bands. In June 2026, the government announced an increase in the Housing Credit Program (KPP) ceiling to IDR 50 trillion from IDR 36 trillion, and reported disbursement progress to more than 91,000 beneficiaries by June 20, 2026. This highlights the role of program liquidity in sustaining transaction flow where commercial mortgage affordability remains tight. The VAT incentive architecture under PMK No. 90/2025 (PPN DTP parameters for homes up to IDR 5 billion and the first IDR 2 billion portion) continues to act as a conversion lever for primary transactions that fit the eligible price envelope, encouraging developers to align product sizing and launch timing to incentive windows.
A second opportunity is tied to execution-enabling digitization and vertical-housing pathways. The 2026 updates to low-income housing assistance rules (including Ministerial Regulation No. 2/2026) and the push toward digital-based information systems for housing assistance management (including requirements introduced under Ministerial Regulation No. 4/2026) favor developers and ecosystem players that can integrate eligibility verification, documentation, and disbursement workflows into sales and construction operations. Bank Indonesia survey evidence shows primary sales contraction in Q1 2026 alongside constraints cited from building material costs, licensing issues, and loan rates. That creates room for products and operating models that reduce approval friction through SIMBG-ready permitting and standardized technical compliance, control input-cost exposure through procurement and design standardization, and serve households that sit between FLPP-type eligibility and fully commercial mortgage affordability.
Recent Industry Developments
- April 2026: Agung Podomoro Land reported first-quarter 2026 sales and revenues of IDR 2.9 trillion, up 232% year-on-year. The update emphasized how asset monetization and inventory conversion help fund project pipelines and sustain launch capacity amid affordability and rate sensitivity.
- September 2025: The IKN Nusantara Authority issued letters to proceed to six housing consortiums covering apartment towers and landed houses, with phase investment commitments announced. The approval advanced the formal residential supply pipeline tied to the new capital program, supporting developer participation and contractor mobilization in East Kalimantan.
- February 2024: Program Sejuta Rumah maintained delivery tempo, with more than 600,000 units reported by end-July 2024. Continued scale execution anchored affordable segment throughput through coordinated roles for government, banks, and developers.


Research Methodology Framework and Report Scope
Market Definition and Coverage
For this report, the market is the gross value generated from selling or renting residential homes in Indonesia, covering both new homes and resales. The scope includes apartments or condominiums, plus villas and landed houses.
Scope exclusions: We exclude bare land sales, purely commercial real estate, and co-living hostels from the market value.
Segmentation Overview
- By Property Type
- Apartments & Condominiums
- Villas & Landed Houses
- By Price Band
- Affordable
- Mid-Market
- Luxury
- By Mode of Sale
- Primary (New-Build)
- Secondary (Existing Home Resale)
- By Region
- Java
- Sumatra
- Kalimantan
- Sulawesi
- Rest of Indonesia
Data Sources, Market Sizing, and Validation
Desk Research
Desk research was used to map the real demand pool and set guardrails on what can reasonably be counted as residential real estate value in Indonesia. We reviewed public releases and data series such as Statistics Indonesia (BPS) housing and macro indicators, Bank Indonesia policy rates and selected property statistics, Ministry of Public Works and Housing program updates, OJK banking and mortgage disclosures, and local tax and regulation notices that affect eligible transactions.
Next, we used company filings, investor presentations, reputable press, and association websites to understand the launch pipeline, price movement, and the split between primary and secondary transactions. For cross-checks on company revenue ranges, deal activity, and long-term trend signals, we also used limited extracts from paid subscriptions focused on company financials and intelligence, along with news and financials. A patent database was also referenced to capture any relevant building technology signals that could affect product mix. These examples are not exhaustive, and many other sources were also used for data collection, validation, and clarification.
Primary Interviews and Surveys
Primary work focused on confirming what is actually transacted and monetized, and on stress-testing assumptions that came out of the desk research. We spoke with a mix of developers, brokerage and agency leaders, property managers, lenders, and local market specialists, and we balanced views across key housing clusters in Java, Sumatra, Kalimantan, Sulawesi, and the rest of Indonesia. When gaps showed up, we re-checked the model using on-ground pricing behavior, typical sales cycles, and rental yields, so the final numbers were not driven by one data point.
Distribution of primary research fieldwork respondents
| Company type | Respondent position |
|---|---|
| Top tier: 31% | CXOs: 14% |
| Mid tier: 52% | Functional/Unit leaders: 36% |
| Smaller Players: 17% | Managers: 50% |
Market-Sizing & Forecasting
Sizing starts with a top-down build that reconstructs the residential value pool using Indonesia housing demand indicators and transaction activity. Those volumes are then converted into value using observed price and rent levels. We corroborate the top-down estimate using selective bottom-up approximations, such as sampled project price bands times estimated absorption, channel checks on typical brokerage throughput, and rental stock checks in major cities, before totals are adjusted to stay realistic.
Key inputs (illustrative) included residential price direction by location and format, mortgage availability and interest rate trends, the pace of primary launches versus secondary resales, household formation and urbanization signals, and rental yield expectations by housing type. Because some regions and price bands have uneven disclosure, missing points were handled using conservative interpolation anchored to nearby comparable markets, and then tested again during primary calls.
For forecasting, we used scenario analysis supported by expert consensus on interest rates, housing policy support (including tax/VAT-related incentives where relevant), and supply pipeline timing. Forecasts were kept stable by checking that implied home sales values and implied rental value growth did not run ahead of broader affordability and financing reality.
Data Validation & Update Cycle
Outputs were validated through multiple checks so large jumps were not accepted without explanation. We compared the model against independent signals such as mortgage growth direction, price movement patterns, construction and handover activity cues, and reported segment momentum across sales and rental, and then investigated variances that did not align.
Before sign-off, the work goes through step-by-step analyst review. Any material mismatch triggers follow-up outreach to clarify assumptions and re-run the affected parts of the model. The report is refreshed annually, with interim updates when major policy changes, rate shifts, or demand shocks occur, and a final pre-delivery pass is completed so clients receive the most current view available.
Mordor Intelligence's Indonesia Residential Real Estate Market Size Measured Against Other Published Estimates
Published market values for Indonesia residential real estate often differ because the counted scope is not consistent, and the base year choices and pricing logic also vary. Differences show up quickly when one estimate treats real estate as one combined pool, and another separates residential sales and rental value only.
Some external figures fold in commercial property, industrial sites, and even land-only transactions, which can push the stated market size higher before residential-only filters are applied. In Mordor Intelligence's model, only residential dwellings are counted when value is clearly tied to home sales or rental activity across defined housing types, with bare land and non-residential assets kept out.
Benchmark comparison
| Source | Market Size | Gaps in Research Methodology |
|---|---|---|
| Mordor Intelligence | USD 47.99 B (2026) | |
| Global Consultancy A | USD 100.40 B (2025) | Uses an overall real estate scope that includes office, retail, hospitality, and industrial categories, so the value pool is structurally larger than residential-only sales and rental value. |
| Industry Publisher B | USD 149.20 B (2024) | Includes non-residential segments and land as part of real estate, and its business-type coverage mixes buying, selling, leasing, and investment in one total, which inflates comparability versus a residential-only definition. |
The spread is mainly explained by scope and counting rules, not by small math differences. By keeping the market tied to observable residential transactions and rent generation, and then cross-checking with financing and pricing signals, the sizing stays traceable to inputs that can be repeated during updates.


Key Questions Answered in the Report
What is the current size and growth outlook of the Indonesia residential real estate market?
The Indonesia residential real estate market size is USD 47.99 billion in 2026 and is projected to reach USD 58.7 billion by 2031 at a 4.12% CAGR.
Which segments lead by share and growth within Indonesia’s housing market?
Villas and landed houses lead by share at 65.5% in 2025, while apartments are the fastest-growing format at a 4.31% CAGR through 2031.
How are policy incentives shaping Indonesia’s housing demand in 2026?
Government-borne VAT relief and subsidized FLPP mortgages continue to support mid-market and affordable take-up, with added support from macroprudential LTV measures through 2026.
Which regions are most important for Indonesia residential real estate in 2026?
Java holds the largest share at 39% due to Greater Jakarta’s scale, while Kalimantan posts the fastest growth at a 4.43% CAGR on IKN-related activity.
What is the key constraint on expanding homeownership in Indonesia?
Low mortgage penetration relative to peers and urban land scarcity constrain conversion, even as digital KPR platforms compress approval times and improve access for first-time buyers.
How is the balance shifting between primary and secondary sales in Indonesia?
Secondary sales still dominate at 63% of volume, but primary new-build is growing at a 4.35% CAGR supported by VAT relief for eligible new inventory and developer presale programs.
Page last updated on:


 Your data is secure and never sold or shared.


