
Market Overview
| Study Period | 2020 - 2031 |
|---|---|
| Forecast Data Period | 2026 - 2031 |
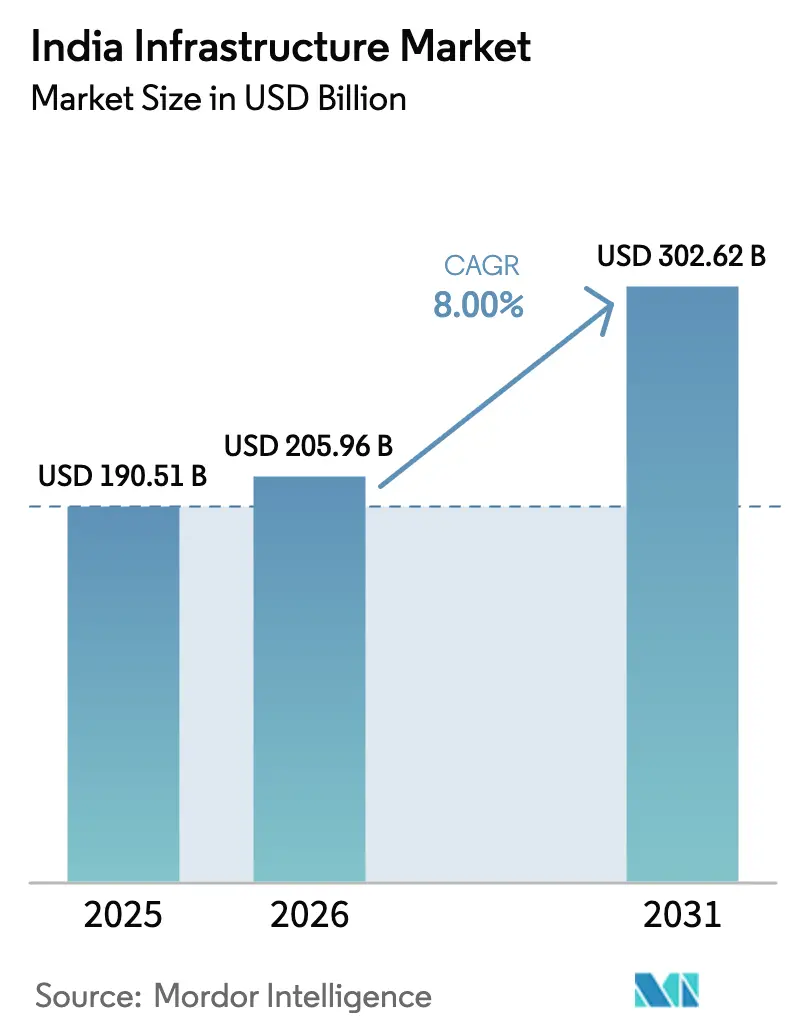
| Base Year Market Size (2025) | USD 190.51 Billion |
| Market Size (2026) | USD 205.96 Billion |
| Market Size (2031) | USD 302.62 Billion |
| Growth Rate (2026 - 2031) | 8.00% CAGR |
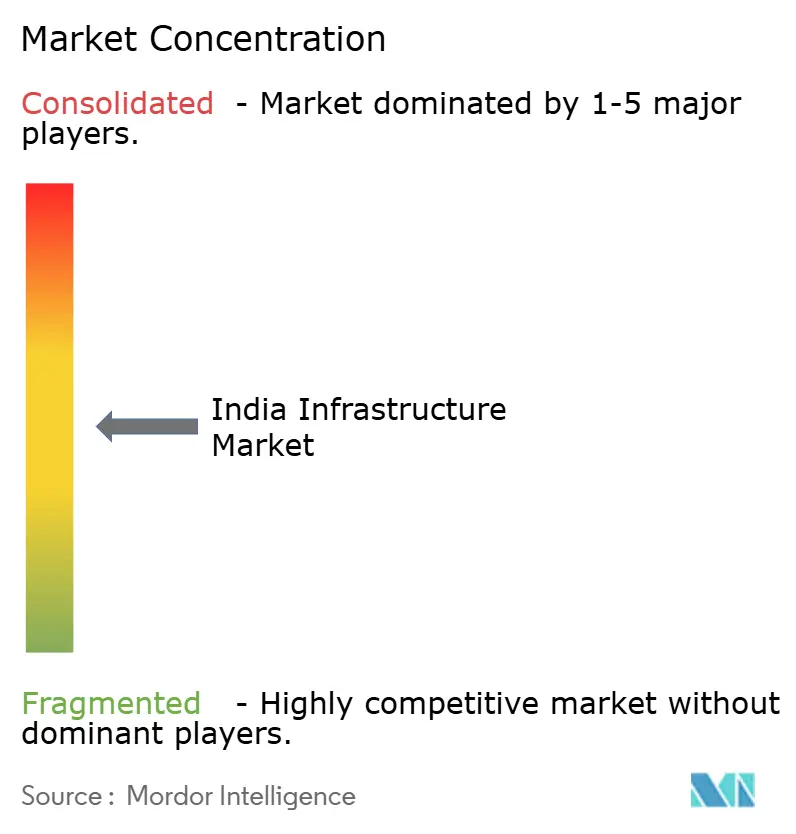
| Market Concentration | Medium |
Major Players *Disclaimer: Major Players sorted in no particular order Image © Mordor Intelligence. Reuse requires attribution under CC BY 4.0. | |
India Infrastructure Market Analysis by Mordor Intelligence
The India Infrastructure Market size is expected to grow from USD 190.51 billion in 2025 to USD 205.96 billion in 2026 and is forecast to reach USD 302.62 billion by 2031 at 8% CAGR over 2026-2031.
Strong policy coordination, sovereign climate financing, and hyperscale computing demand underpin this expansion even as tighter environmental screens reshape funding flows. The transportation segment continues to anchor activity because expressways, metro corridors, and dedicated freight routes shorten travel times for manufacturers and commuters. Digital approval platforms now halve clearance cycles, which lowers interest costs for concessionaires and improves bid competitiveness. At the same time, sovereign green bonds reduce the cost of capital for metro rail and electric-vehicle charging networks. Rising private investment in operational assets created a deep secondary market that recycles public funds into greenfield projects. However, skilled-labor shortages and stricter ESG lending norms add friction, raising the execution burden on contractors.
Key Report Takeaways
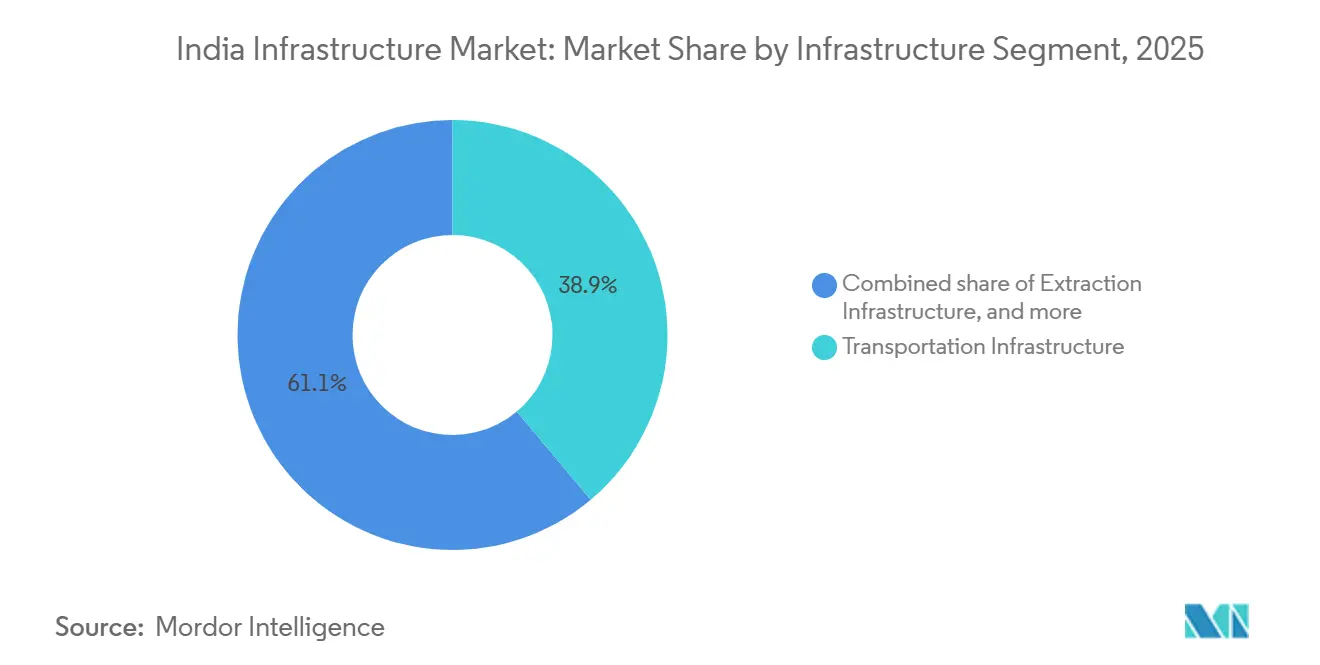
- By infrastructure segment, transportation infrastructure led with 38.89% of the 2025 India Infrastructure Sector market share, while utilities infrastructure is forecast to expand at a 10.09% CAGR through 2031.
- By construction type, new construction accounted for 79.79% of 2025 spending; renovation is advancing at a 9.79% CAGR to 2031.
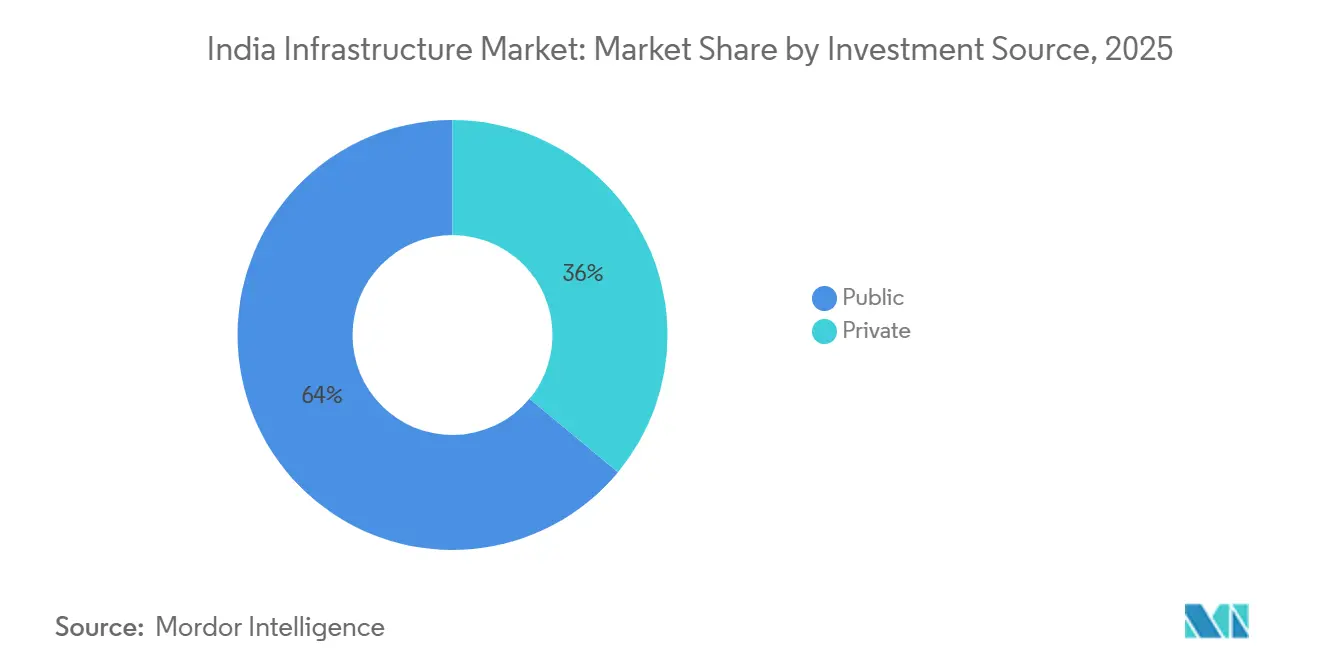
- By investment source, public entities controlled 63.99% of 2025 outlays, whereas private capital is projected to grow at a 10.59% CAGR through 2031.
- By key cities, the Mumbai Metropolitan Region held 15.59% of 2025 spending, while Hyderabad is set to grow at an 11.29% CAGR to 2031.
Note: Market size and forecast figures in this report are generated using Mordor Intelligence’s proprietary estimation framework, updated with the latest available data and insights as of January 2026.
India Infrastructure Market Trends and Insights
Drivers Impact Analysis*
| Driver | (~) % Impact on CAGR Forecast | Geographic Relevance | Impact Timeline |
|---|---|---|---|
| PM Gati Shakti unified logistics platform shortens approval cycles | +2.1% | National, early gains in Delhi NCR and Mumbai MMR | Short term (≤ 2 years) |
| Hyperscale data-centre demand catalyzes renewable-powered parks | +1.9% | Hyderabad, Mumbai MMR, Chennai, Pune | Medium term (2-4 years) |
| Green Hydrogen Mission drives pipeline, port, and storage build-out | +1.8% | Coastal states and Rajasthan solar zones | Medium term (2-4 years) |
| Sovereign green bonds unlock low-cost capital for metro and EV projects | +1.5% | Tier-1 cities | Short term (≤ 2 years) |
| Second wave of airport privatization spurs regional EPC contracts | +0.9% | Tier-2 cities | Long term (≥ 4 years) |
| Source: Mordor Intelligence | |||
PM Gati Shakti Unified Logistics Platform Shortens Infrastructure Approval Cycles
The PM Gati Shakti digital portal overlays geospatial data from 16 ministries, enabling authorities to catch right-of-way conflicts before tenders are issued. By December 2025, the portal cut inter-ministerial clearance times for logistics parks from 18 to 9 months, which saved concessionaires significant interest during bid preparation[1]Ministry of Commerce, “Gati Shakti portal reduces clearance time,” economictimes.indiatimes.com. Faster clearances also lifted the share of highway projects reaching financial closure within 120 days to 87% in fiscal 2025, up from 62% two years earlier. The platform’s machine-learning module now flags parcels with overlapping agency claims, reducing arbitration filings by 30%. Adoption still hinges on state digitization of legacy land records because only 14 states had completed compatible cadastral surveys by mid-2025. Until lagging states catch up, highway mega-projects in Uttar Pradesh and Bihar remain prone to title disputes.
Surging Hyperscale Data-Centre Demand Catalyzes Renewable-Powered Industrial Parks
India’s installed data-centre capacity hit 1,100 MW in 2025, with 1,800 MW under construction to serve AI and cloud workloads[2]Telangana IT Department, “AI City master plan announced,” business-standard.com. Operators mandate 60% renewable energy, which drives co-location of data halls with solar parks and battery storage. Telangana allocated 12,000 acres for an AI City in 2025, complete with pre-approved clearances and 500 kV grid links, a USD 1.2 billion outlay that rapidly drew global cloud firms. Navi Mumbai’s Panvel node attracted USD 800 million because three submarine-cable stations lower the latency for global traffic. Water scarcity forces investment in closed-loop cooling and wastewater reuse systems, which raises capital intensity but ensures compliance with environmental norms.
Green Hydrogen Mission Drives Pipeline, Port, and Storage Infrastructure Build-Out
The National Green Hydrogen Mission targets 5 million t of annual capacity by 2030, triggering an estimated USD 100 billion of electrolyzer plants, renewable parks, and ammonia export terminals. Incentives worth USD 2.4 billion spurred Reliance, Adani, and NTPC to announce gigawatt-scale facilities along Gujarat’s Kutch coast and the Visakhapatnam cluster. These projects require high-voltage direct-current lines, desalination plants, and cryogenic tanks that create a near-term order pipeline for EPC firms. Paradip and Tuticorin ports awarded engineering contracts in 2025 for ammonia-cracking terminals aimed at Japan and South Korea, where carbon tariffs penalize gray hydrogen. Retrofitting natural-gas pipelines remains expensive at USD 1.2 million per kilometer, underscoring the demand for hydrogen-ready networks. Front-loaded spending concentrates 60% of capital outlays in 2025-2028, offering contractors sizable but time-bound opportunities.
Sovereign Green Bonds Unlock Low-Cost Capital for Metro and EV Charging Projects
Two sovereign green-bond tranches totaling USD 4 billion lowered borrowing costs for certified clean-transport projects by 80-100 basis points[3]Ministry of Finance, “Green bond framework execution update,” reuters.com. Delhi Metro raised USD 500 million at a 6.85% coupon for Phase IV, well below its 2022 rate. Bengaluru earmarked USD 300 million to deploy 5,000 fast chargers, making 15-minute access possible citywide. The bonds widened India’s investor base by attracting European pension funds and Japanese institutions that seek ESG-compliant assets. A third USD 3 billion tranche planned for fiscal 2026 will fund coastal-highway climate proofing, indicating policy commitment to scale the program.
Restraints Impact Analysis*
| Restraint | (~) % Impact on CAGR Forecast | Geographic Relevance | Impact Timeline |
|---|---|---|---|
| Skilled-labor shortages spike wage bills during mega-project overlap | -0.9% | Tier-1 cities | Short term (≤ 2 years) |
| Tightening ESG financing norms restrict fossil-linked funding | -0.7% | Coal-belt states, thermal-power hubs | Medium term (2-4 years) |
| Source: Mordor Intelligence | |||
Skilled-Labor Shortages Amid Concurrent Mega-Projects Spike Wage Bills
Concurrent metros, expressways, and data-centre campuses lifted demand for certified carpenters, tunnel-boring operators, and high-voltage electricians beyond available supply. Daily wages for skilled rebar fixers in Bengaluru jumped 19% between January 2024 and December 2025, well above inflation. Only 12% of the construction workforce held formal certification in 2025, which curbed productivity gains from mechanization. Larsen & Toubro disclosed that labor costs rose to 22% of project expenses in fiscal 2025, from 18% two years earlier. Robotics reduced headcount on marquee projects, yet adoption remains uneconomical for contracts below USD 500 million, so the wage spiral is expected to persist into 2027.
Tightening ESG Financing Norms Restrict Funding for Fossil-Linked Projects
Reserve Bank guidelines on financed emissions prompted leading banks to cut thermal-power exposure by USD 4.2 billion in fiscal 2025. International financiers such as the Asian Development Bank withdrew from all fossil infrastructure in 2024, closing a USD 6-8 billion annual channel. The funding gap stalled coal-rail sidings in Jharkhand and Odisha, delaying Coal India’s plan to reach 1 billion t output. Contractors now pivot toward carbon-capture retrofits and mine-site solar plants, but legacy EPC players lack the specialized skills needed. Brownfield coal-plant expansions remain high risk despite shorter payback periods, underscoring the restraint’s persistence.
*Our forecasts treat driver/restraint impacts as directional, not additive. The impact forecasts reflect baseline growth, mix effects, and variable interactions.
Segment Analysis
By Infrastructure Segment – Transport Dominance Sustains Momentum
Transportation infrastructure contributed 38.89% of 2025 spending, confirming its position as the largest slice of the India Infrastructure Sector market. The Bharatmala program’s USD 18 billion annual allocation and the near-completion of 2,843 kilometers of dedicated freight corridors shortened factory-to-port transit times, unlocking just-in-time logistics for automakers and electronics assemblers. On the urban side, USD 12 billion flowed into metro rail, including the 33.5-kilometer underground Mumbai corridor that demanded precise tunnel-boring beneath dense utilities. Expressway concessions employing hybrid-annuity models drew USD 6.5 billion of private equity in fiscal 2025, validating shared-risk frameworks.
Utilities infrastructure followed with 28% of spending as Power Grid’s USD 8 billion program linked western renewables to southern demand centers. Social segments such as hospitals and affordable housing commanded 18%, while extraction infrastructure slipped to 15% because ESG funding constraints slowed coal logistics. The India Infrastructure Sector market size attributed to utilities is projected to expand at a 10.09% CAGR through 2031, supported by transmission links for green-hydrogen clusters. As corridors converge with multimodal nodes, mid-sized EPC firms specializing in high-voltage direct-current lines and bored tunnels are projected to win larger shares of upcoming bids.



By Construction Type – Renovation Rises as Assets Mature
New construction owned 79.79% of 2025 activity, but renovation is projected to post a 9.79% CAGR to 2031, slightly faster than greenfield growth. The National Highways Authority allocated USD 2.8 billion in fiscal 2025 for pavement and bridge rehabilitation that extends service life by more than a decade at one-third of replacement cost. Urban retrofits are also gathering pace; Mumbai committed USD 1.2 billion in 2025 to strengthen 47 century-old rail overbridges using seismic dampers. Delhi Metro invested USD 400 million in signaling upgrades that raised peak-hour frequency to 90 seconds.
The India Infrastructure Sector market share for renovation is expected to climb steadily as the National Monetisation Pipeline requires bidders to invest 15% of enterprise value in asset upgrades. Private operators prefer renovation because timelines run 18-24 months, minimizing exposure to land acquisition delays. Climate-resilience work, such as elevating coastal stretches in Kerala, is an emerging niche that accelerates the segment’s appeal. Despite the rise of renovation, greenfield projects remain indispensable in industrializing states where baseline connectivity gaps persist.
By Investment Source – Private Capital Broadens the Funding Base
Public entities supplied 63.99% of 2025 outlays, reflecting government dominance in mega-projects. The India Infrastructure Sector market size attributable to private players is set to grow at a 10.59% CAGR, powered by asset-monetization drives. The National Highways Authority raised USD 4.2 billion from 1,600 lane-kilometers of toll roads under the Toll-Operate-Transfer scheme, giving investors inflation-indexed cash flows. Hybrid-annuity projects totaling 3,200 kilometers attracted competitive bids from Dilip Buildcon and Ashoka Buildcon, showing that risk-sharing structures widen the pool of concessionaires.
Data-centre campuses form a pure-private wave; Adani Data Networks and Yotta Infrastructure committed USD 5 billion in 2025 without government support. New dispute-resolution frameworks featuring fast-track arbitration now shield private capital from lengthy litigation, enhancing confidence. As InvITs gain traction, secondary deals recycle capital at scale, which accelerates multiplier effects across the project pipeline.
Geography Analysis
Mumbai MMR commanded 15.59% of 2025 spending, driven by the Trans-Harbour Link, Coastal Road, and Metro Line 3, three mega-projects that together absorbed USD 18 billion. Their collective impact reduced island-city congestion and enabled Navi Mumbai International Airport, operational since 2024, to catalyze USD 6 billion in logistics villages and hotel districts. Monetization of the Mumbai-Pune Expressway raised USD 2.8 billion that will bankroll the Virar-Alibaug Multi-Modal Corridor and open fresh right-of-way for freight and commuters. Land scarcity and deep-tunnel costs temper MMR’s future growth, yet secondary projects around Panvel and Alibaug offer new momentum.
Delhi NCR ranks second by spend share, anchored by the 104-kilometer Metro Phase IV and the 82-kilometer Delhi-Meerut rapid-transit corridor. Noida’s logistics hub and data-centre park leverage proximity to the Dedicated Freight Corridor, drawing USD 4.5 billion in 2025. Completion of the Dwarka Expressway unlocked USD 8 billion in real-estate value, underscoring how road upgrades quickly translate into private-sector development. Planned corridors to Gurugram and Alwar are expected to boost the region’s ridership and freight volumes further.
Hyderabad leads on growth at an 11.29% forecast CAGR. Allocation of 12,000 acres for AI City, fast-track permitting, and a 500 MW renewable quota attract hyperscale investors. Metro Phase II will stretch the network to 148 kilometers, cutting transport emissions by 18% by 2030. The Hyderabad Growth Corridor promises four-hour trucking to Nagpur, expected to unlock USD 3 billion in pharmaceutical and electronics manufacturing by 2028. Strong governance and rapid approvals give the city an edge over legacy metros where clearances take longer and land is costlier.
Regulatory Landscape
India's infrastructure build-out is shaped by central standards and sector programs, alongside state-level approvals and enforcement. At the asset level, the Real Estate (Regulation and Development) Act, 2016 set up state Real Estate Regulatory Authorities (RERA) to regulate project registrations and developer compliance for applicable real-estate-linked development, influencing contractor documentation, disclosure discipline, and escrow-linked cash-flow practices.
On codes and permitting, the Bureau of Indian Standards (BIS) advanced an updated national baseline through the National Building Construction Standards 2026 (NBCS), including a May 2026 publication focused on fire prevention and life safety requirements. For municipal development controls, the Model Building Bye-Laws, 2016 remain a reference framework for states and urban local bodies, while industrial land and infrastructure readiness added an anchor via DPIIT's Bharat Audyogik Vikas Yojna (BHAVYA), approved with an INR 33,660 crore outlay to develop 100 plug-and-play industrial parks over FY 2026-27 to FY 2031-32.
Value Chain Analysis
India's infrastructure value chain runs from project origination (central ministries, state agencies, and ULBs) to planning and design (architectural, engineering, and PMCs), then to financing and contracting (EPC, item-rate, HAM, BOT/TOT, and PPP variants), and finally to construction delivery and O&M. Public awarding remains the main demand aggregation channel, but monetization routes such as Toll-Operate-Transfer and the growing secondary market in operational assets are recycling capital back into greenfield pipelines. This raises the cadence of bid cycles for contractors and specialist subcontractors (tunneling, HVDC, geotechnical, and MEP).
Upstream supply is shaped by bulk materials (cement, steel, aggregates) and equipment fleets, alongside an increasingly digital procurement layer that connects fragmented suppliers to large sites. Platforms such as Infra.Market and ArisInfra have expanded procurement and fulfillment through technology-enabled aggregation, helping EPC players manage multi-location deliveries and improve purchase visibility. Policy and logistics architecture also affect flow efficiency, with NITI Aayog actions in 2026, including revisions to concession frameworks for logistics parks, pointing to continued emphasis on private investment and execution efficiency. At the same time, reported bottlenecks in mining and metals logistics reflect persistent constraints for material-intensive infrastructure programs.
Competitive Landscape
Competition is moderate; the top five EPC firms hold roughly 35% of order books. Larsen & Toubro pivoted toward metro and renewable-transmission contracts that now form 42% of its USD 30 billion fiscal-2025 inflow, exiting coal EPC as bank lending shrank. Tata Projects and Shapoorji Pallonji focus on metro rail and green-hydrogen terminals, where design-build models compress execution risk and improve working-capital cycles. Mid-tier contractors differentiate through specialized skills such as tunnel-boring or HVDC transmission, securing roles on projects where incumbents cannot scale.
Adani Ports pursues vertical integration. Its 28% share of container throughput in 2025, plus rights to develop Vadhavan port, positions it at the nexus of shipping, rail connectivity, and logistics parks. GMR’s modular terminal strategy at Goa’s Mopa airport showcased how phased capacity protects returns in demand-uncertain markets. Technology adoption widens the performance gap; Tata Projects used digital twins on Mumbai Metro Line 3, cutting rework by 22% and shortening schedules by eight months. Meanwhile, smaller firms struggle to finance BIM tools and advanced geotechnical surveys required by new Indian Roads Congress standards, accelerating industry consolidation.
White-space opportunities center on climate-resilient retrofits and battery storage. Contractors that invest early in falling-weight deflectometers, advanced pavement software, and hydrogen-ready metallurgy can win outsized shares as design norms tighten. With banks rewarding ESG-aligned portfolios, firms that shift from fossil-linked EPC to renewable and digital infrastructure stand to capture premium valuations.
India Infrastructure Industry Leaders
Larsen & Toubro Ltd
Tata Projects Ltd
Hindustan Construction Company Ltd
NCC Ltd
Shapoorji Pallonji Engineering & Construction
- *Disclaimer: Major Players sorted in no particular order

Market Opportunities and Future Outlook
An investable gap is taking shape at the intersection of industrial infrastructure, urban services, and de-risked financing structures. The Union Budget 2026-27 raised public capex to INR 12.2 trillion and introduced instruments such as the Urban Challenge Fund (FY26 to FY31, INR 1 lakh crore central assistance) and an Infrastructure Risk Guarantee Fund for partial credit guarantees. These steps broaden the set of bankable structures for city-scale mobility, water, and resilience packages. Alongside this, DPIIT's BHAVYA program (INR 33,660 crore) for 100 plug-and-play industrial parks adds a programmatic pipeline for internal trunk infrastructure, utility networks, and multimodal connectivity within manufacturing-oriented land banks.
Large corridor execution progress is also translating into near-term contracting and retrofit opportunities around completion interfaces, systems integration, and capacity upgrades. As of July 2026, reported progress on flagship links such as the Delhi-Mumbai Expressway (around three-quarters complete) and the Mumbai-Ahmedabad High-Speed Rail corridor (around 80% complete, with ongoing viaduct works such as portal-beam launches in Ahmedabad by NHSRCL) indicates sustained demand for structures, MEP and systems packages, and logistics-enabling nodes around interchanges and stations. On the supply side, the 2026-27 CIE scheme to promote domestic manufacturing of high-value construction and infrastructure equipment supports localization themes, including complex tunneling and heavy-civil equipment, aligning with the market's need for mechanized execution as skilled-labor constraints persist.
Recent Industry Developments
- June 2026: Hindustan Construction Company (HCC) announced it had secured a contract from Wangchhu Hydroelectric Power Limited, Bhutan, for construction of diversion tunnels, hydromechanical gates, and cofferdams for the Wangchhu Hydroelectric Project. The award reinforces HCC's position in complex hydro-civil works and keeps cross-border project execution active as Indian contractors pursue specialized order books beyond domestic transport corridors.
- May 2026: Larsen & Toubro disclosed new domestic wins spanning industrial and marine-linked infrastructure, including piling works for JSW Utkal Steel's integrated steel plant at Paradeep and works for ship repair facilities commissioned by the Inland Waterways Authority of India, alongside a yacht marina project at Mumbai Harbour for Mumbai Port Authority. The mix broadens L&T's exposure to industrial capex and inland waterways, linking heavy civil capabilities with port and riverine logistics assets.
- November 2025: Tata Projects and Siemens Mobility commissioned a metro rolling stock manufacturing plant at Savli with a stated capacity of about 300 cars per year. The facility strengthens domestic supply for metro expansion programs and supports faster fleet procurement cycles for urban rail agencies as multiple city networks move into new phases and upgrades.


Research Methodology Framework and Report Scope
Market Definition and Coverage
For this study, the market is defined as the annual value of infrastructure build and upgrade activity executed in India, including core civil works and the installation and commissioning of physical infrastructure equipment.
Scope exclusions: We exclude land acquisition costs and purely digital assets, and we do not count telecom towers, data center fit-outs, or cloud facilities.
Segmentation Overview
- By Infrastructure Segment
- Transportation Infrastructure
- Utilities Infrastructure
- Social Infrastructure
- Extraction Infrastructure
- By Construction Type
- New Construction
- Renovation
- By Investment Source
- Public
- Private
- By Key Cities
- Mumbai Metropolitan Region
- Delhi NCR
- Pune
- Bengaluru
- Hyderabad
- Chennai
- Kolkata
- Ahemadabad
- Rest of India
Data Sources, Market Sizing, and Validation
Desk Research
We start with desk research to build the market boundary, collect baseline demand signals, and set initial assumptions that can be tested later in interviews. Public sources were used to anchor spending and project flow, such as budget documents and sector updates from the Government of India, National Statistical Office releases, Reserve Bank of India data on credit and investment, and program dashboards and publications from agencies such as NHAI and Indian Railways.
Next, we cross-check the story with disclosures from listed companies (annual reports, investor presentations, and earnings call notes), reputed press coverage, and association websites that track awards and execution progress. Where available, we also use paid subscriptions for company financials and intelligence, shipment-level import and export signals for relevant equipment categories, and patent databases to sense where technology refresh is concentrated. The sources named here are illustrative only, and many other public and paid sources were also referred to for collection, validation, and clarification.
Primary Interviews and Surveys
Primary work is used to confirm what is actually being executed on the ground, and to avoid counting plans as delivered value. We speak with a mix of EPC and project management professionals, asset owners, developers, lenders, and material and equipment participants to validate cost shares, timing slippages, and typical upgrade cycles across major Indian geographies.
To keep assumptions realistic, the interview feedback is used to adjust price progression, execution ratios, and what gets counted as renovation versus a new build, and then to re-check the totals against the desk-based model outputs.
Distribution of primary research fieldwork respondents
| Company type | Respondent position | Region |
|---|---|---|
| Top tier: 28% | CXOs: 18% | |
| Mid tier: 51% | Functional/Unit leaders: 40% | |
| Smaller Players: 21% | Managers: 42% |
Market-Sizing & Forecasting
Sizing is built using a top-down approach where national and sector spend signals are reconstructed into an annual infrastructure value pool for India, and then filtered through execution timing and typical project mix. Since single sources rarely match the exact market definition, we reconcile multiple series such as public capex allocations and actual outlays, project award pipelines, and sector indicators that reflect build activity.
To keep the model grounded, we corroborate results with selective bottom-up checks, such as sampled project cost benchmarks, channel checks on key equipment and materials, and a limited roll-up of reported revenues from relevant service lines where disclosure allows. The main inputs include public capital expenditure and infrastructure allocations, award and completion momentum on roads and rail corridors, power and utility build-out indicators, urban infrastructure project progress, and observed movements in construction input costs that affect nominal value.
For forecasting, scenario analysis is used so the base case can reflect expected funding and execution realities, and then downside and upside cases can be tested using sensitivity on award conversion, execution speed, and cost inflation. When coverage gaps appear in bottom-up checks, we use conservative imputation based on comparable project types and then revisit those assumptions in follow-up expert calls before finalizing the series.
Data Validation & Update Cycle
Validation is done through triangulation across independent signals, so a single optimistic pipeline does not drive the final value. We run variance checks by comparing implied spend to macro indicators, project execution rates, and typical cost structures, and then anomalies are flagged for review.
Before sign-off, the model is reviewed in more than one internal step, and large shifts trigger re-contact with primary respondents to confirm if the change is real or driven by a data break. The report is refreshed annually, and interim adjustments are made when material events occur, such as major budget changes, funding constraints, or policy updates that alter execution. Right before delivery, a final pass is completed so clients receive the latest view available.
Mordor Intelligence's India Infrastructure Sector Market Size Measured Against Other Published Estimates
Published market values for India infrastructure can differ by a wide margin, even when the labels look similar at first glance. The gaps typically come from what each publisher counts as infrastructure value, the year used as the base, and how planned projects are converted into executed spend.
Some estimates lean toward a broader construction style view that can implicitly pick up adjacent digital build-outs and facility fit-outs when city and investment lenses are applied. In Mordor Intelligence's model, the value is limited to physical civil works plus equipment installation and commissioning, and land costs and purely digital assets are kept out to avoid inflating the spend pool.
Benchmark comparison
| Source | Market Size | Gaps in Research Methodology |
|---|---|---|
| Mordor Intelligence | USD 205.96 B (2026) | |
| Global Data Publisher A | USD 204.06 B (2024) | Uses an earlier base year and is presented as an investment driven view with heavy emphasis on transport and logistics programs, which can shift totals depending on how multi-modal and allied works are treated and how quickly awards are assumed to convert into executed value. |
| Industry Portal B | USD 190.70 B (2025) | Builds the market through four broad infrastructure buckets and city based lenses, but the public summary does not clarify treatment of refurbishments versus new builds or how input-cost inflation is carried into nominal values, which can pull the base-year figure down or up. |
Taken together, the spread is mostly explained by base-year choice and what gets counted as spend versus pipeline, and not by a single math difference. Our approach keeps the sizing traceable to clear spend signals, execution reality checks, and repeatable adjustments, so decision makers can compare year to year changes with fewer hidden scope jumps.


Key Questions Answered in the Report
What is the current value of the India Infrastructure Sector market?
The India Infrastructure Sector market is valued at USD 205.96 billion in 2026.
How fast is private capital growing in India’s infrastructure build-out?
Private investment is projected to rise at a 10.59% CAGR between 2026 and 2031 as operational asset monetization scales.
Which city is set to record the fastest infrastructure growth through 2031?
Hyderabad is forecast to expand at an 11.29% CAGR because of large data-centre and metro rail commitments.
Why is renovation spending gaining ground against new construction?
Renovation delivers asset-life extensions at one-third of reconstruction cost and has shorter execution timelines, driving a 9.79% CAGR outlook.
Page last updated on:




