
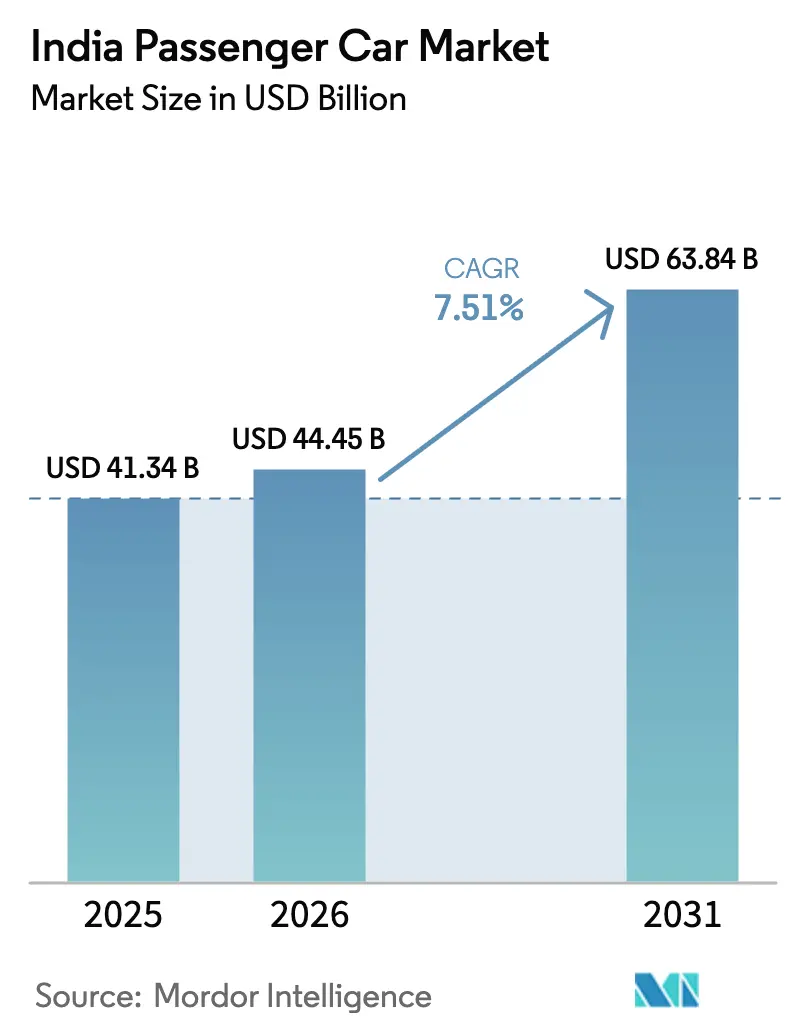
India Passenger Car Market Analysis by Mordor Intelligence
The India Passenger Car Market size is expected to increase from USD 44.45 billion in 2026 to USD 47.79 billion in 2027 and reach USD 69.67 billion by 2032, growing at a CAGR of 7.83% over 2027-2032.
In India, compact SUVs and efficient CNG cars broaden practical choice as buyers weigh space, running cost and financing together. Digital discovery makes feature clarity and fast dealer response part of the product, while urban delivery fleets reward uptime and standardized service. OEMs can respond with localized platforms, software updates and charging or refueling partnerships that shorten the path from interest to use. Competitive pressure remains uneven because elevated dealer stock can delay production decisions and entry-tier discounting can absorb the margin needed for new content. The commercial result is a market where growth depends on matching accessible formats with dependable infrastructure and disciplined channel execution.
Key Report Takeaways
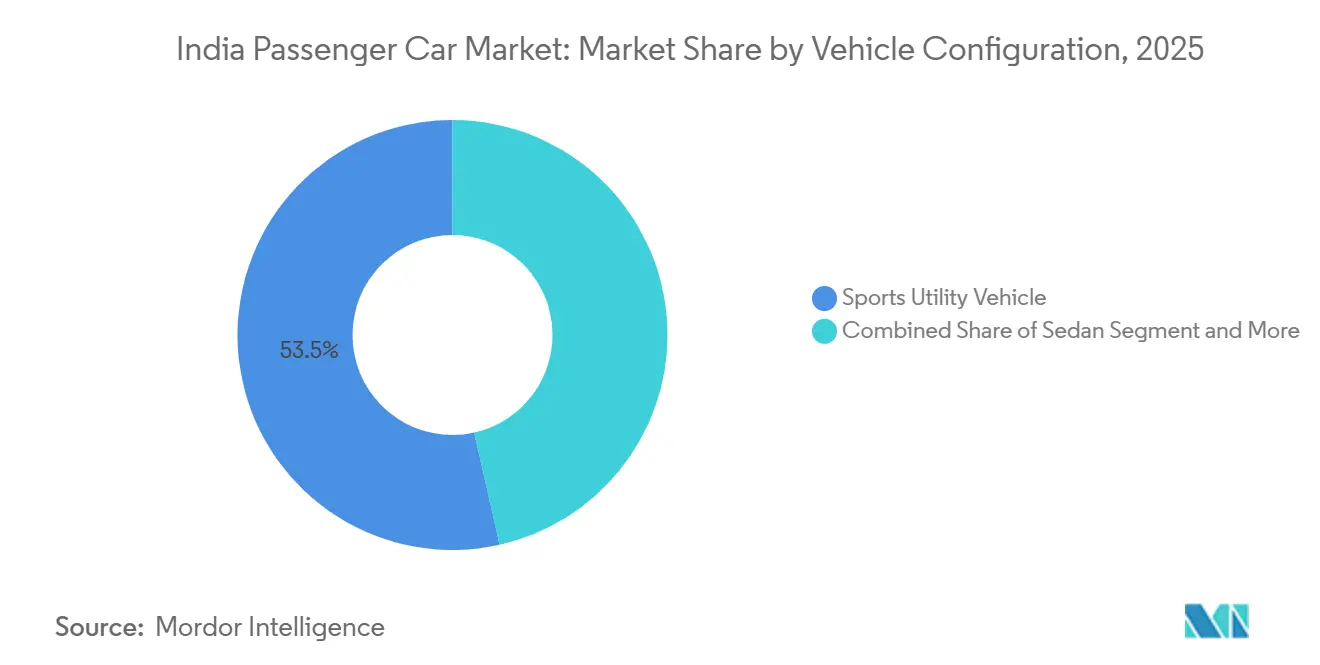
- Vehicle configuration centers on Sports Utility Vehicle, which accounted for a 53.54% share of the India Passenger Car Market size in 2026, while Sports Utility Vehicle is fastest-growing at a 7.98% CAGR over 2027-2032.
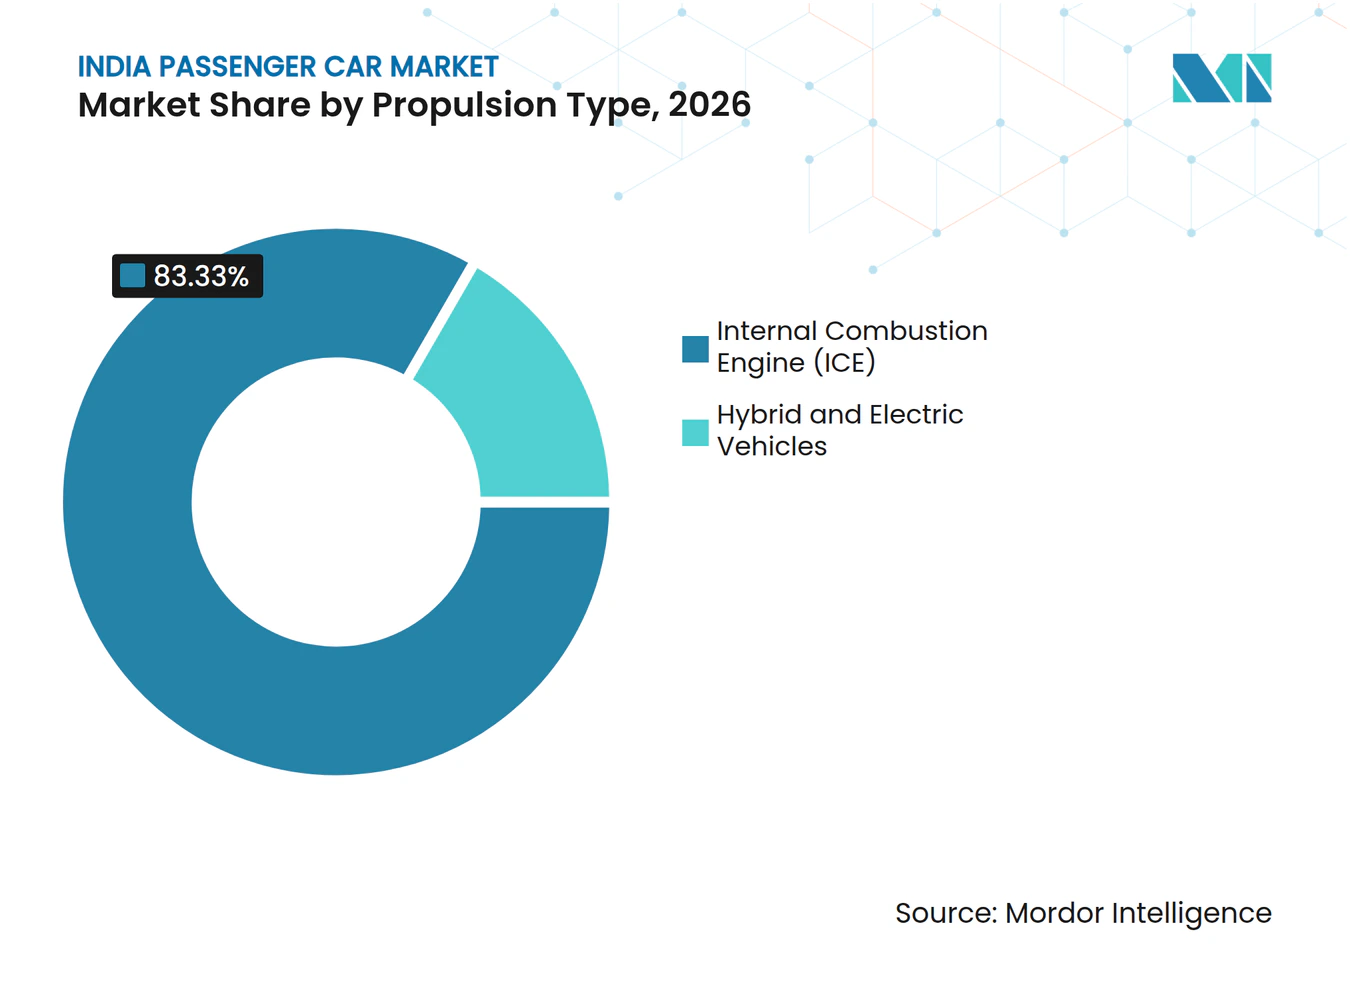
- Propulsion is led by Internal Combustion Engine (ICE), which represented an 83.33% India Passenger Car Market share in 2026, while Hybrid & Electric Vehicles are fastest-growing at a 7.96% CAGR over 2027-2032.
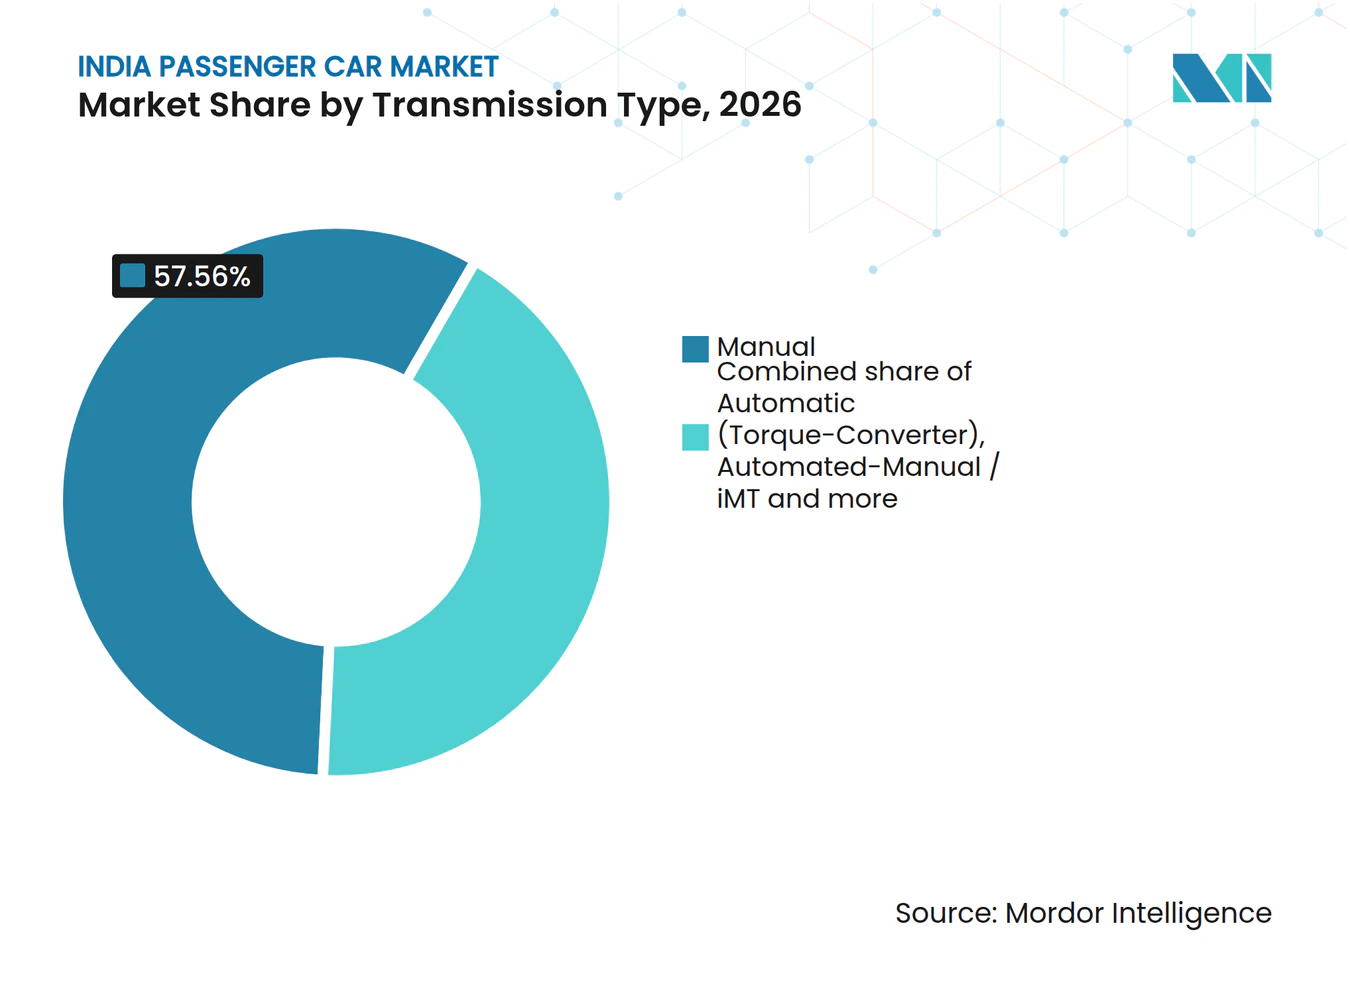
- Transmission demand remains anchored by Manual, which accounted for a 57.56% share of the India Passenger Car Market size in 2026, while Automatic (Torque-Converter) is fastest-growing at an 8% CAGR over 2027-2032.
- By price band, INR 5–10 lakh represented a 45.43% India Passenger Car Market share in 2026, while INR 10–20 lakh is fastest-growing at an 8.02% CAGR over 2027-2032.
- Ownership is dominated by Personal, which accounted for an 87.14% share of the India Passenger Car Market size in 2026, while Fleet (Ride-hailing, Subscription, Leasing) is fastest-growing at an 8.02% CAGR over 2027-2032.
- Geography spans production-heavy northern and western corridors, expanding southern EV clusters and an emerging eastern India adoption base.
Note: Market numbers in this report are based on Mordor Intelligence's proprietary estimation framework, which combines nine months of actuals with Q4 projections for base year 2026.
Market Trends and Insights
Drivers Impact Analysis of India Passenger Car Market*
| Driver | (~) % Impact on CAGR Forecast | Geographic Relevance | Impact Timeline |
|---|---|---|---|
| Surging Compact-SUV Supply From Sub-4-Meter Length Bracket | +2.5% | Nationwide passenger-vehicle markets | Medium term (2-4 years) |
| CNG Infrastructure Build-Out Reducing Running-Cost Parity Time | +2% | Nationwide CNG corridors | Medium term (2-4 years) |
| Digital-First Aspirational Younger Buyers | +1.7% | India’s urban and suburban markets | Short term (≤ 2 years) |
| E-Commerce–Fueled Urban Gig-Fleet Demand | +1.5% | India’s tier-one and tier-two cities | Medium term (2-4 years) |
| OEMs Leveraging India as Global Small-Car Export Hub | +1.1% | India’s export-oriented assembly hubs | Long term (≥ 4 years) |
| In-House Software-Defined-Vehicle Stacks Lowering Model-Cycle Time | +0.9% | India’s engineering and assembly centers | Long term (≥ 4 years) |
| Source: Mordor Intelligence | |||
Surging Compact-SUV Supply From Sub-4-Meter Length Bracket
India’s compact-SUV sub-segment recorded 1.38 million wholesales in FY2025, up 10% year over year, with sub-4-meter models accounting for nearly half of SUV sales. The bracket gained further momentum as India’s sub-4-meter SUV segment sold 116,552 units in July 2026, up 34.67% year over year from July 2025. New nameplates broadened the offer, with Škoda’s Kylaq and Kia’s Syros entering in early 2025 and selling 20,518 and 23,597 units, respectively, by May. For buyers in cities such as Delhi and Mumbai, more compact-SUV choices combine elevated seating with dimensions suited to dense streets and parking limits. That combination shifts showroom traffic toward small SUVs and gives dealers more price points to convert hatchback upgraders. Suppliers must support a wider model roster, so the commercial benefit depends on reliable availability across these new variants.
CNG Infrastructure Build-Out Reducing Running-Cost Parity Time
India had 9,158 CNG stations as of August 2026, extending the refueling network available to passenger-car buyers. Authorized city-gas entities also commissioned 1,206 new CNG stations across India in FY2024-25. The expanding network coincided with a CNG vehicle fleet increase from 5.86 million in March 2023 to 8.2 million in March 2025, with about 25% year-over-year growth in FY2024-25. For drivers in Delhi-NCR and Gujarat, denser coverage reduces the time and route deviation needed to refuel, improving the operating case for factory-fitted CNG cars. Lower access friction helps fleet operators and daily commuters compare fuel savings over a shorter ownership period. OEMs can therefore position CNG hatchbacks and compact sedans as practical cost-control choices, although station availability still shapes conversion outside established corridors.
Digital-First Aspirational Younger Buyers
Younger aspirational buyers increasingly begin vehicle consideration with digital discovery, where images, reviews, financing tools and feature comparisons shape the shortlist. That behavior raises the value of clear online specifications and rapid responses because a missed question can move a prospect to another brand. Connected infotainment, smartphone integration and safety displays therefore become visible purchase cues alongside price and fuel economy. Dealers that link digital leads to test drives can reduce friction for first-time buyers who want a guided but low-pressure process. OEMs gain a route to present higher trims and accessories before a showroom visit. The commercial effect is stronger conversion when product content is consistent across channels, while weak digital execution leaves younger demand exposed to faster-moving rivals.
E-Commerce–Fueled Urban Gig-Fleet Demand
E-commerce delivery density creates a practical need for compact cars that can complete repeated urban trips while keeping downtime predictable. Fleet buyers weigh payload access, turning radius, fuel or charging cost and service reach more heavily than private owners do. That operating profile favors durable hatchbacks and small utility vehicles that can enter congested neighborhoods and return quickly for the next assignment. Leasing and subscription structures can spread replacement decisions across a managed fleet, making standardized trims easier to deploy. OEMs and rental operators can capture this demand by packaging maintenance, telematics and uptime support with the vehicle. The opportunity remains concentrated where delivery routes are dense enough to offset utilization, so rural sales channels cannot assume the same fleet economics.
Restraints Impact Analysis of India Passenger Car Market*
| Restraint | (~) % Impact on CAGR Forecast | Geographic Relevance | Impact Timeline |
|---|---|---|---|
| Dealer Inventory Overhang Pressuring OEM Production | -0.9% | Nationwide dealership networks | Short term (≤ 2 years) |
| Intensifying Price War in Entry Hatchbacks Squeezing Margins | -0.7% | India’s entry-hatchback retail market | Medium term (2-4 years) |
| Long-Tail Chip Shortages in Body-Control & ADAS ECUs | -0.2% | India’s vehicle electronics supply chain | Medium term (2-4 years) |
| Patchy Fast-Charger Uptime Outside Tier-1 Cities | -0.1% | Cities outside India’s tier-one hubs | Medium term (2-4 years) |
| Source: Mordor Intelligence | |||
Dealer Inventory Overhang Pressuring OEM Production
Passenger-vehicle dealer inventory reached 43 to 45 days in September 2026, more than twice FADA’s 21-day benchmark. The imbalance was visible earlier, as H1 2025 wholesale dispatches rose 0.5% year over year while retail growth reached 2.5%, prompting OEMs to moderate factory output. High stock ties dealer cash in unsold cars and raises the risk that production plans misread local demand, especially for slower-moving trims. Honda Cars India said in July 2025 that it was aligning output with market demand by prioritizing retail deliveries over wholesale dispatches. That response can limit additional channel loading, but it does not clear vehicles already on dealer lots. Until inventory returns closer to the benchmark, OEMs face carrying-cost pressure and less flexibility to accelerate production for new launches.
Intensifying Price War in Entry Hatchbacks Squeezing Margins
Entry hatchbacks compete for highly price-sensitive households, so small list-price moves can redirect demand between closely matched models. Dealers may use discounts, finance support or accessory bundling to protect monthly affordability when rivals intensify promotions. Those concessions reduce the margin available to fund safety upgrades, connected features and local marketing. OEMs can protect value by simplifying variants and emphasizing ownership cost, but that approach limits choice for buyers who compare equipment line by line. Suppliers also feel pressure when automakers defer optional content or seek lower component costs. The restraint therefore constrains profitable growth in the lowest price tier even when unit demand remains resilient.
*Our forecasts treat driver/restraint impacts as directional, not additive. The impact forecasts reflect baseline growth, mix effects, and variable interactions.
India Passenger Car Market Segment Analysis
By Vehicle Configuration:
SUV-Led Utility MixSports Utility Vehicle accounted for a 53.54% share of the India Passenger Car Market size in 2026 and is the fastest-growing segment at a 7.98% CAGR over 2027-2032. Hyundai Motor India’s Creta sold 201,122 units in India in CY2025 and ranked as the country’s best-selling SUV. [1] Tata Motors Passenger Vehicles’ Nexon sold 200,559 units and ranked second among SUVs in the same year. This scale gives SUV programs purchasing power, broad showroom visibility and room for connected or electrified variants. For families and urban professionals, higher seating converts into an everyday utility proposition.
Hatchback remains the practical entry format, and Maruti Suzuki’s WagonR swivel-seat pilot shows how accessibility features can widen its use among senior citizens and persons with disabilities. Multi-Purpose Vehicle demand is supported by Toyota’s more than 200,000 Innova HyCross sales by April 2026, reinforcing a comfort and reliability proposition. Sedan buyers retain a distinct value and first-time-buyer role, with Maruti Suzuki’s Dzire selling more than 214,488 units in CY2025. These formats serve different space, access and driving needs, so SUV scale does not eliminate targeted opportunities elsewhere.



By Propulsion Type:
ICE Base With Electrification MomentumInternal Combustion Engine (ICE) represented an 83.33% India Passenger Car Market share in 2026. FADA’s September 2026 retail mix still combined petrol or ethanol, diesel and CNG or LPG powertrains, showing a broad installed base for combustion vehicles. The CY2025 mix likewise retained a substantial ICE foundation across fuel types. That installed base supports service networks and supplier familiarity because repair networks and fuel retail are already organized around these powertrains. This continuity lowers switching risk for cost-conscious households and commercial operators.
Hybrid & Electric Vehicles are forecast to be the fastest-growing segment, with a 7.96% CAGR over 2027-2032. Toyota Kirloskar Motor reported cumulative sales of 300,000 hybrid vehicles in India by May 2026, indicating meaningful customer uptake of self-charging technology. Tata Motors reported 16,231 EV wholesales in Q1 FY2026, showing that new launches can sustain interest even when quarterly volume softened. The resulting mix favors staged electrification, with hybrids and EVs expanding alongside a still-dominant ICE service ecosystem. Suppliers that can serve both electrical and combustion architectures can smooth the transition for OEM programs.

By Transmission Type:
Manual Majority, Automatic AccelerationManual accounted for a 57.56% share of the India Passenger Car Market size in 2026. Škoda Auto India said manual cars made up almost 65% to 70% of India’s sub-four-meter SUV market in 2025, linking manual demand to a high-volume compact format. Manual systems retain cost and repair familiarity for buyers outside major metros. Their scale keeps them central to entry and utility models. Dealers can stock them broadly because technicians and parts channels are already familiar, which matters when buyers prioritize purchase price over advanced electronics.
Automatic (Torque-Converter) is forecast to be the fastest-growing segment, with an 8% CAGR over 2027-2032. Automatics exceeded 60% of Škoda Auto India sales in January and February 2026, up from about 55% in 2025. Most Kylaq buyers chose automatic variants during the model’s first year, showing adoption beyond premium vehicles. Automated-Manual / iMT remains a bridge for buyers seeking convenience at lower complexity, while Dual-Clutch / CVT applications such as Hyundai’s Verna 1.5-liter Turbo GDi DCT target premium sedan customers. Suppliers therefore face a widening technology mix rather than a single replacement path.
By Price Band:
Mid-Market Center With Premium UpsideINR 5–10 lakh accounted for a 45.43% share of the India Passenger Car Market size in 2026. SBI Research also identified cars priced at INR 5 lakh to INR 10 lakh as the largest band in September–October 2025, reinforcing the mass-market center of gravity. This band balances monthly affordability with safety and convenience features. It remains the key battleground for manufacturers balancing volume and equipment. Financing terms, exchange offers and feature expectations influence movement within this band, especially when households compare monthly payments across neighboring models.
INR 10–20 lakh is forecast to be the fastest-growing segment, with an 8.02% CAGR over 2027-2032. The segment can absorb richer features and SUV body styles without the full price premium of luxury models. Less than or equal to INR 5 lakh remains a constrained entry tier where financing sensitivity is high. More than INR 20 lakh carries modest volumes but higher margins in premium SUVs, while large luxury cars above INR 30 lakh recorded 3.5% wholesale growth in April–October FY2026. The spread leaves room for brands to trade buyers upward through equipment, design and powertrain differentiation.
By Ownership Model:
Personal Base, Fleet ExpansionPersonal accounted for an 87.14% share of the India Passenger Car Market size in 2026. Private owners typically prioritize daily usability, financing predictability and broad service access. Those criteria favor models with established dealer coverage and familiar powertrains. The large base gives OEMs volume stability even as alternative ownership formats develop, while comfortable cabins and low-effort service scheduling protect private demand. Product planning must therefore preserve broad usability while adding digital and electrified features without weakening service confidence or resale expectations across metropolitan and smaller-city buyers.
Fleet (Ride-hailing, Subscription, Leasing) is forecast to be the fastest-growing segment, with an 8.02% CAGR over 2027-2032. Fleet operators can standardize trims, maintenance and replacement timing across vehicles. Ride-hailing users value uptime and operating cost, while subscription and leasing customers value flexible access. Fleet growth therefore rewards suppliers that bundle telematics, service response and residual-value management with the vehicle. Standardized procurement can accelerate safer and more efficient configurations, but economics still depend on utilization, financing terms, route density and reliable support across operating cities.
Geography Analysis
Maruti Suzuki’s July 2026 footprint links northern Haryana plants with the 1-million-unit Hansalpur facility in Gujarat, making the northern and western corridors major passenger-vehicle production bases. Delhi-NCR combines purchase and scrapping incentives with tax waivers and charging infrastructure, including 3,100 charging stations and 893 battery-swapping stations by March 2025. Gujarat also serves export-oriented production, as Hansalpur accounted for nearly 47% of overseas shipments in FY2025-26 and reached 1 million vehicles of annual capacity in July 2026. [2] Maharashtra adds an electrification node through Mahindra’s dedicated EV manufacturing and battery-assembly facility at Chakan in Pune, unveiled in February 2025. Together these corridors connect manufacturing, exports, urban incentives and emerging EV supply capabilities.
Southern states combine established production with expanding charging and battery capability, giving suppliers clear locations for component and service localization. Kia’s Anantapur plant in Andhra Pradesh has approximately 300,000 vehicles of annual capacity and has dispatched more than 630,000 vehicles, including over 150,000 exports. The Ministry of Heavy Industries approved proposals for 1,243 EV chargers in Karnataka in May 2026, strengthening Bengaluru’s charging role. Tamil Nadu was designated Hyundai Motor India’s flagship EV hub in June 2026, supported by a battery sub-assembly plant and 39 DC charging stations. These developments give southern buyers manufacturing-linked service networks and more visible electrification infrastructure while shortening coordination between plants, dealers and charging operators.
Eastern India has a documented adoption and infrastructure base, with Odisha reporting more than 219,000 registered EVs by early 2025 and West Bengal’s state EV program recording 16 operational charging sites by May 2025. The contrast with the production-heavy northern, western and southern corridors points to a different commercial task in the east. Regional operators need dependable charging, financing and service access before wider model choice can translate into sustained adoption. OEMs can use corridor partnerships and localized after-sales support to connect eastern demand with national platforms. This approach helps translate scattered registrations into repeatable retail and fleet activity.
Regulatory Framework and Outlook
This comparison covers selected jurisdictions that matter to an OEM evaluating passenger-car production and sales. India provides the national import, localization and safety framework, while Maharashtra and Tamil Nadu add state-level incentives and tax treatment. The table separates administered instruments from commercial judgments and keeps the participant perspective consistent.
Regulatory Table of India Passenger Car Market
| Decision factor | India | Maharashtra | Tamil Nadu |
|---|---|---|---|
| Primary authority | Ministry of Heavy Industries and Ministry of Road Transport and Highways | Maharashtra Government and Transport Department | Tamil Nadu Government Home (Transport-I) Department and Transport Commissioner |
| Key instruments or direction | SPMEPCI localization and import scheme; voluntary Bharat NCAP ratings | EV demand incentive, motor-vehicle-tax exemption and highway charging framework | 100% motor-vehicle-tax exemption for battery-operated vehicles through December 2027 |
| Commercial effect | Capital and domestic-value obligations raise entry cost, while qualifying EV imports can access 15% duty and safety ratings add assessment work | Incentives and tax relief reduce EV ownership cost, while charging provisions support corridor deployment | Tax relief improves EV purchase economics during the stated exemption period |
| Current policy attractiveness | Medium | High | Medium |
| Future direction of policy attractiveness | No change | No change | No change |
| Source: Mordor Intelligence | |||
For India, the national framework offers a route for qualifying EV investment but requires substantial capital, localization and compliance work, and MHI reported no SPMEPCI applications by October 2025. Maharashtra ranks High because its 2025–2030 policy combines a demand incentive, tax exemption and planned charging spacing, although technical feasibility still conditions some chargers. Tamil Nadu ranks Medium because its tax exemption is commercially useful but time-bounded through December 2027, so OEM planning must account for the post-exemption case.
Value Chain Stages
The comparison follows the India passenger-car chain from component production through after-sales support. It separates supplier earnings from buyer benefits and ties each bottleneck to a practical resilience response. Verified examples show how localization, logistics coordination and recurring service revenue shape value capture.
Value Chain Analysis Table of India Passenger Car Market
| Primary activity | Key participants | Value capture | Bottleneck | Resilience response |
|---|---|---|---|---|
| Component manufacturing | Automotive systems suppliers such as Bosch Mobility, Motherson Sumi Wiring India and Tata AutoComp | Component sales, system integration and engineering support | Imported electronics and wiring inputs expose programs to lead-time and localization risk | Digitize supply planning, localize critical parts and qualify alternate sources |
| Vehicle assembly | Passenger-vehicle OEMs such as Maruti Suzuki India Limited, Mahindra & Mahindra Limited and Tata Motors Passenger Vehicles Limited | Vehicle sales, factory integration and embedded software value | Capacity imbalances can create pending orders or constrain output while dealers carry uneven stock | Balance plant loading with retail signals and modularize platforms across powertrains |
| Inbound and production logistics | Automotive logistics providers such as Mahindra Logistics, TVS Supply Chain Solutions and Delhivery | Warehousing, sequencing, line-feeding and transport contracts | Route disruption can raise fuel and container costs and lengthen delivery times | Use multi-route planning, vendor-managed inventory and regional staging to protect line supply |
| Retail and distribution | Multi-brand and OEM dealer groups such as Landmark Cars and Popular Vehicles and Services | Vehicle margins, finance referral, accessories and dealer service intake | High inventory days tie up working capital and make model allocation harder | Link dispatches to retail throughput, expand digital leads and flex showroom formats |
| After-sales and recycling support | Aftermarket networks and service operators such as Bosch Mobility Aftermarket, Landmark Cars and Popular Vehicles and Services | Parts, diagnostics, warranty, repairs and recurring maintenance contracts | EV and software complexity raises training and diagnostic requirements across dispersed workshops | Expand authorized coverage, share diagnostic data and build technician capability around mixed powertrains |
| Source: Mordor Intelligence | ||||
The chain captures value progressively through parts, integration, logistics, vehicle sale and recurring service. Localization reduces exposure at the component and logistics stages, while retail discipline protects working capital downstream. After-sales networks become more strategic as software and electrified vehicles increase the value of diagnostics, updates and trained technicians.
Competitive Landscape
Market Concentration
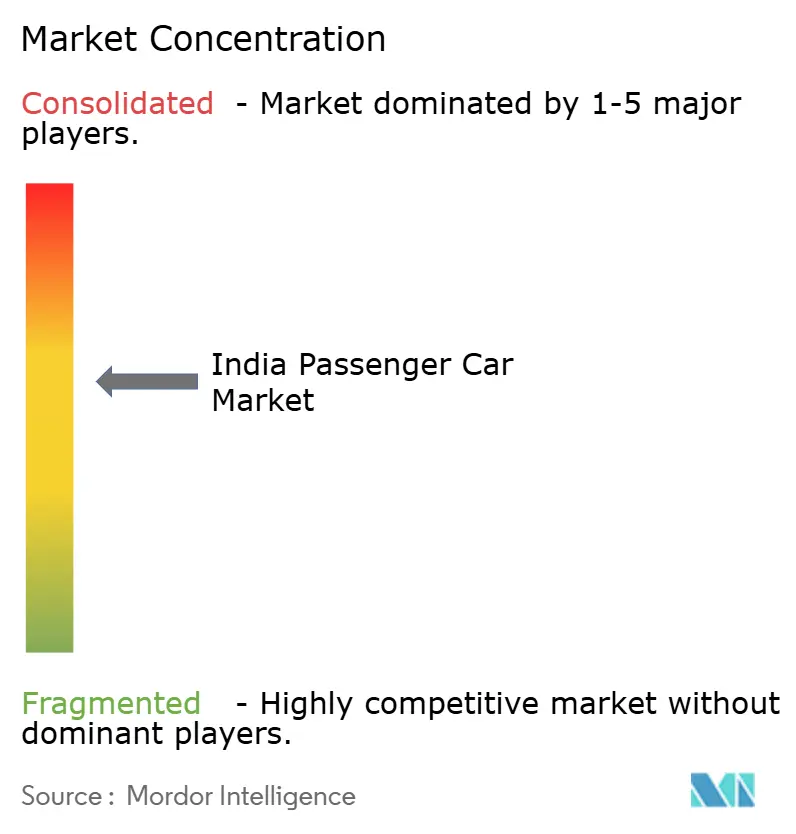
Hyundai Motor India Limited, Kia Corporation, Mahindra & Mahindra Limited, Maruti Suzuki India Limited and Tata Motors Passenger Vehicles Limited form the active leader set in that rank order. Hyundai operates manufacturing facilities in Chennai and Pune, while Kia operates an Indian plant with annual capacity of 300,000 units. Kia lifted 2025 volume 14.9% to 280,000 units, and Mahindra’s SUV sales grew 19.7% to 660,276 units in FY2025-26. The structure combines high-volume incumbents with focused SUV and EV propositions, while Maruti’s exports and Tata’s electric-vehicle specialization raise entry barriers in manufacturing, distribution and service.
Strategies increasingly pair capacity with technology and model refreshes, with Hyundai Motor Group announcing USD 15.5 billion of India investment through 2032, including manufacturing expansion across Hyundai Motor India. [3] Kia used upgraded features and the Syros and Carens PE launches to raise share to 6.1% in 2025. Tata Motors Passenger Vehicles reported 55.4% EV market share in FY2025 and launched Curvv and Curvv.ev at price parity with ICE models. Mahindra’s SUV scale and electric-SUV position support premium utility vehicles, while Maruti’s 447,000 exports in FY2025-26 extend its manufacturing base beyond domestic demand.
Competitive direction will be shaped by the ability to fund localized capacity while keeping vehicles accessible. Hyundai’s planned investment can deepen scale, but established plants and supplier ecosystems make execution speed as important as headline capital. Tata Motors Passenger Vehicles had produced more than 600,000 Punch SUVs by July 2025 and reported 38% FY2025 sub-compact SUV share, reinforcing the importance of compact utility scale. Kia and Mahindra can challenge through compact SUVs and feature-rich trims, while Tata’s EV position raises pressure on charging, software and battery economics. Regulatory compliance on emissions, safety and localization will reward firms that integrate engineering and sourcing early, leaving room for challengers that solve uptime and affordable electrification gaps.
India Passenger Car Industry Leaders
-
Hyundai Motor India Limited
-
Kia Corporation
-
Mahindra & Mahindra Limited
-
Maruti Suzuki India Limited
-
Tata Motors Passenger Vehicles Limited
- *Disclaimer: Major Players sorted in no particular order
India Passenger Car Market Companies Covered in this Report
- Maruti Suzuki India Limited
- Hyundai Motor India Limited
- Tata Motors Passenger Vehicles Limited
- Mahindra & Mahindra Limited
- Kia Corporation
- Toyota Kirloskar Motor Pvt. Ltd.
- Honda Cars India Ltd.
- JSW MG Motor India Pvt. Ltd.
- Renault India Pvt. Ltd.
- Nissan Motor India Pvt. Ltd.
- Volkswagen AG
- BYD India Pvt. Ltd.
- Audi AG
- BMW India Pvt. Ltd.
Recent Industry Developments in India Passenger Car Market
- Oct 2026: Hyundai Motor India inaugurated its Talegaon, Pune manufacturing facility with 170,000 units of current annual installed capacity.
- Sep 2026: Mahindra & Mahindra launched the Thar OG lifestyle SUV in India as a reimagined successor to the three-door Thar, with petrol and diesel powertrains.
- Jun 2026: Toyota Kirloskar Motor launched the New Innova Crysta MPV in India with refreshed exterior and interior styling and a 2.4-liter diesel engine paired with a manual transmission.
Scope and Methodology
By Vehicle Configuration
| Hatchback |
| Multi-Purpose Vehicle |
| Sedan |
| Sports Utility Vehicle |
By Propulsion Type
| Hybrid & Electric Vehicles | Battery Electric |
| Hybrid Electric | |
| Plug-in Hybrid Electric | |
| Fuel-cell Electric | |
| Internal Combustion Engine (ICE) | CNG |
| Diesel | |
| Gasoline | |
| LPG |
By Transmission Type
| Manual |
| Automatic (Torque-Converter) |
| Automated-Manual / iMT |
| Dual-Clutch / CVT |
By Price Band
| Less than or equal to INR 5 lakh |
| INR 5–10 lakh |
| INR 10–20 lakh |
| More than INR 20 lakh |
By Ownership Model
| Personal |
| Fleet (Ride-hailing, Subscription, Leasing) |
| By Vehicle Configuration | Hatchback | |
| Multi-Purpose Vehicle | ||
| Sedan | ||
| Sports Utility Vehicle | ||
| By Propulsion Type | Hybrid & Electric Vehicles | Battery Electric |
| Hybrid Electric | ||
| Plug-in Hybrid Electric | ||
| Fuel-cell Electric | ||
| Internal Combustion Engine (ICE) | CNG | |
| Diesel | ||
| Gasoline | ||
| LPG | ||
| By Transmission Type | Manual | |
| Automatic (Torque-Converter) | ||
| Automated-Manual / iMT | ||
| Dual-Clutch / CVT | ||
| By Price Band | Less than or equal to INR 5 lakh | |
| INR 5–10 lakh | ||
| INR 10–20 lakh | ||
| More than INR 20 lakh | ||
| By Ownership Model | Personal | |
| Fleet (Ride-hailing, Subscription, Leasing) | ||
Market Definition
- Vehicle Type - The category includes passenger cars.
- Vehicle Body Type - This include various body types such as Hatchbacks, Sedans, Sports Utility Vehicles, and Multi-purpose Vehicles.
- Fuel Category - The category includes various fuel types such as Gasoline, Diesel, LPG (Liquefied Petroleum Gas), CNG (Compressed Natural Gas), HEV (Hybrid Electric Vehicles), PHEV (Plug-in Hybrid Electric Vehicles), BEV (Battery Electric Vehicles), and FCEV (Fuel Cell Electric Vehicles)
| Keyword | Definition |
|---|---|
| Electric Vehicle (EV) | A vehicle which uses one or more electric motors for propulsion. Includes cars, buses, and trucks. This term includes all-electric vehicles or battery electric vehicles and plug-in hybrid electric vehicles. |
| BEV | A BEV relies completely on a battery and a motor for propulsion. The battery in the vehicle must be charged by plugging it into an outlet or public charging station. BEVs do not have an ICE and hence are pollution-free. They have a low cost of operation and reduced engine noise as compared to conventional fuel engines. However, they have a shorter range and higher prices than their equivalent gasoline models. |
| PEV | A plug-in electric vehicle is an electric vehicle that can be externally charged and generally includes all-electric vehicles as well as plug-in hybrids. |
| Plug-in Hybrid EV | A vehicle that can be powered either by an ICE or an electric motor. In contrast to normal hybrid EVs, they can be charged externally. |
| Internal combustion engine | An engine in which the burning of fuels occurs in a confined space called a combustion chamber. Usually run with gasoline/petrol or diesel. |
| Hybrid EV | A vehicle powered by an ICE in combination with one or more electric motors that use energy stored in batteries. These are continually recharged with power from the ICE and regenerative braking. |
| Commercial Vehicles | Commercial vehicles are motorized road vehicles designed for transporting people or goods. The category includes light commercial vehicles (LCVs) and medium and heavy-duty vehicles (M&HCV). |
| Passenger Vehicles | Passenger cars are electric motor– or engine-driven vehicles with at least four wheels. These vehicles are used for the transport of passengers and comprise no more than eight seats in addition to the driver’s seat. |
| Light Commercial Vehicles | Commercial vehicles that weigh less than 6,000 lb (Class 1) and in the range of 6,001–10,000 lb (Class 2) are covered under this category. |
| M&HDT | Commercial vehicles that weigh in the range of 10,001–14,000 lb (Class 3), 14,001–16,000 lb (Class 4), 16,001–19,500 lb (Class 5), 19,501–26,000 lb (Class 6), 26,001–33,000 lb (Class 7) and above 33,001 lb (Class 8) are covered under this category. |
| Bus | A mode of transportation that typically refers to a large vehicle designed to carry passengers over long distances. This includes transit bus, school bus, shuttle bus, and trolleybuses. |
| Diesel | It includes vehicles that use diesel as their primary fuel. A diesel engine vehicle have a compression-ignited injection system rather than the spark-ignited system used by most gasoline vehicles. In such vehicles, fuel is injected into the combustion chamber and ignited by the high temperature achieved when gas is greatly compressed. |
| Gasoline | It includes vehicles that use gas/petrol as their primary fuel. A gasoline car typically uses a spark-ignited internal combustion engine. In such vehicles, fuel is injected into either the intake manifold or the combustion chamber, where it is combined with air, and the air/fuel mixture is ignited by the spark from a spark plug. |
| LPG | It includes vehicles that use LPG as their primary fuel. Both dedicated and bi-fuel LPG vehicles are considered under the scope of the study. |
| CNG | It includes vehicles that use CNG as their primary fuel. These are vehicles that operate like gasoline-powered vehicles with spark-ignited internal combustion engines. |
| HEV | All the electric vehicles that use batteries and an internal combustion engine (ICE) as their primary source for propulsion are considered under this category. HEVs generally use a diesel-electric powertrain and are also known as hybrid diesel-electric vehicles. An HEV converts the vehicle momentum (kinetic energy) into electricity that recharges the battery when the vehicle slows down or stops. The battery of HEV cannot be charged using plug-in devices. |
| PHEV | PHEVs are powered by a battery as well as an ICE. The battery can be charged through either regenerative breaking using the ICE or by plugging into some external charging source. PHEVs have a better range than BEVs but are comparatively less eco-friendly. |
| Hatchback | These are compact-sized cars with a hatch-type door provided at the rear end. |
| Sedan | These are usually two- or four-door passenger cars, with a separate area provided at the rear end for luggage. |
| SUV | Popularly known as SUVs, these cars come with four-wheel drive, and usually have high ground clearance. These cars can also be used as off-road vehicles. |
| MPV | These are multi-purpose vehicles (also called minivans) designed to carry a larger number of passengers. They carry between five and seven people and have room for luggage too. They are usually taller than the average family saloon car, to provide greater headroom and ease of access, and they are usually front-wheel drive. |
Research Methodology
Mordor Intelligence follows a four-step methodology in all its reports.
- Step-1: Identify Key Variables: To build a robust forecasting methodology, the variables and factors identified in Step-1 are tested against available historical market numbers. Through an iterative process, the variables required for market forecast are set and the model is built based on these variables.
- Step-2: Build a Market Model: Market-size estimations for the historical and forecast years have been provided in revenue and volume terms. Market revenue is calculated by multiplying the sales volume with their respective average selling price (ASP). While estimating ASP factors like average inflation, market demand shift, manufacturing cost, technological advancement, and varying consumer preference, among others have been taken into account.
- Step-3: Validate and Finalize: In this important step, all market numbers, variables, and analyst calls are validated through an extensive network of primary research experts from the market studied. The respondents are selected across levels and functions to generate a holistic picture of the market studied.
- Step-4: Research Outputs: Syndicated Reports, Custom Consulting Assignments, Databases & Subscription Platforms.


