
Market Overview
| Study Period | 2021 - 2031 |
|---|---|
| Market Size (2026) | USD 72.51 Billion |
| Market Size (2031) | USD 97.62 Billion |
| Growth Rate (2026 - 2031) | 6.13 % |
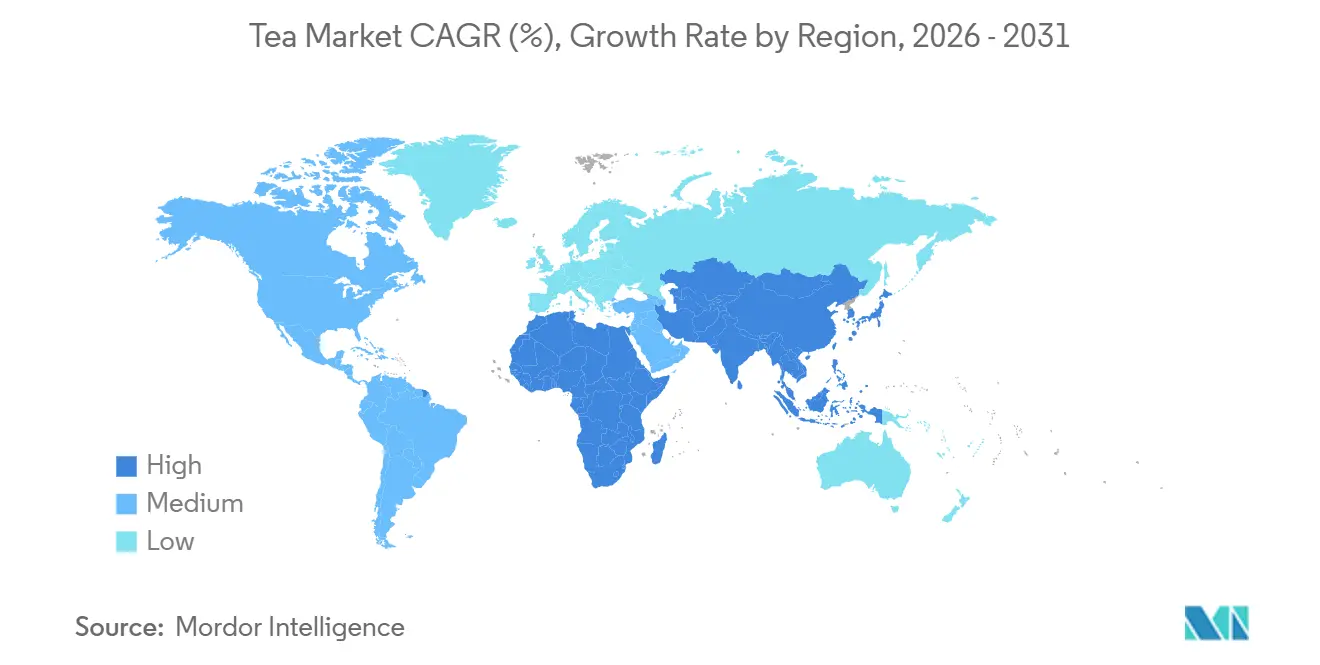
| Fastest Growing Market | Middle East and Africa |
| Largest Market | Asia Pacific |
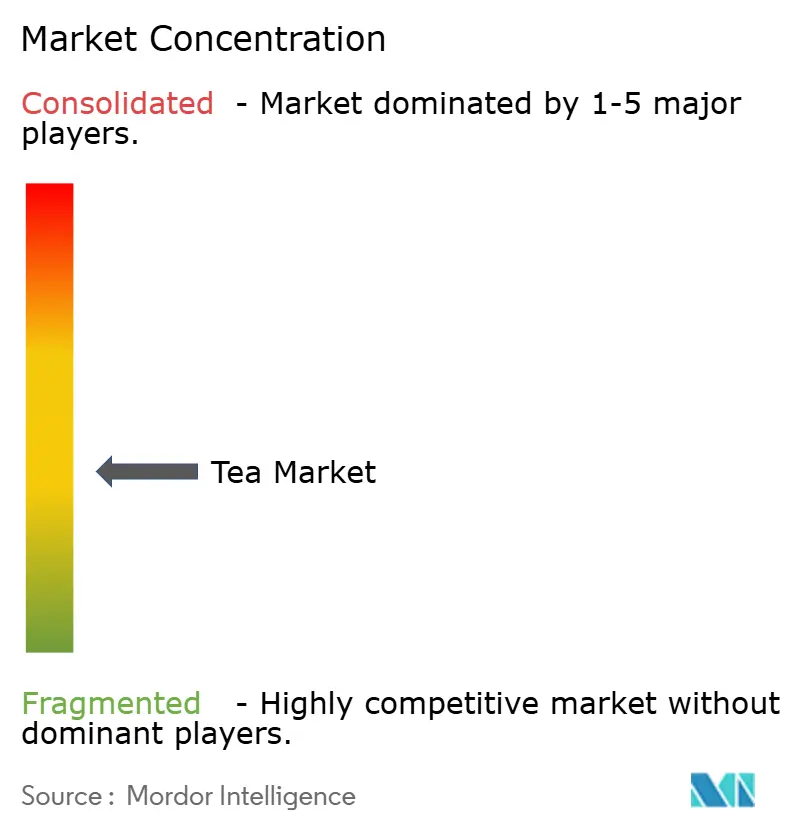
| Market Concentration | Medium |
Major Players *Disclaimer: Major Players sorted in no particular order Image © Mordor Intelligence. Reuse requires attribution under CC BY 4.0. | |
Tea Market Analysis by Mordor Intelligence
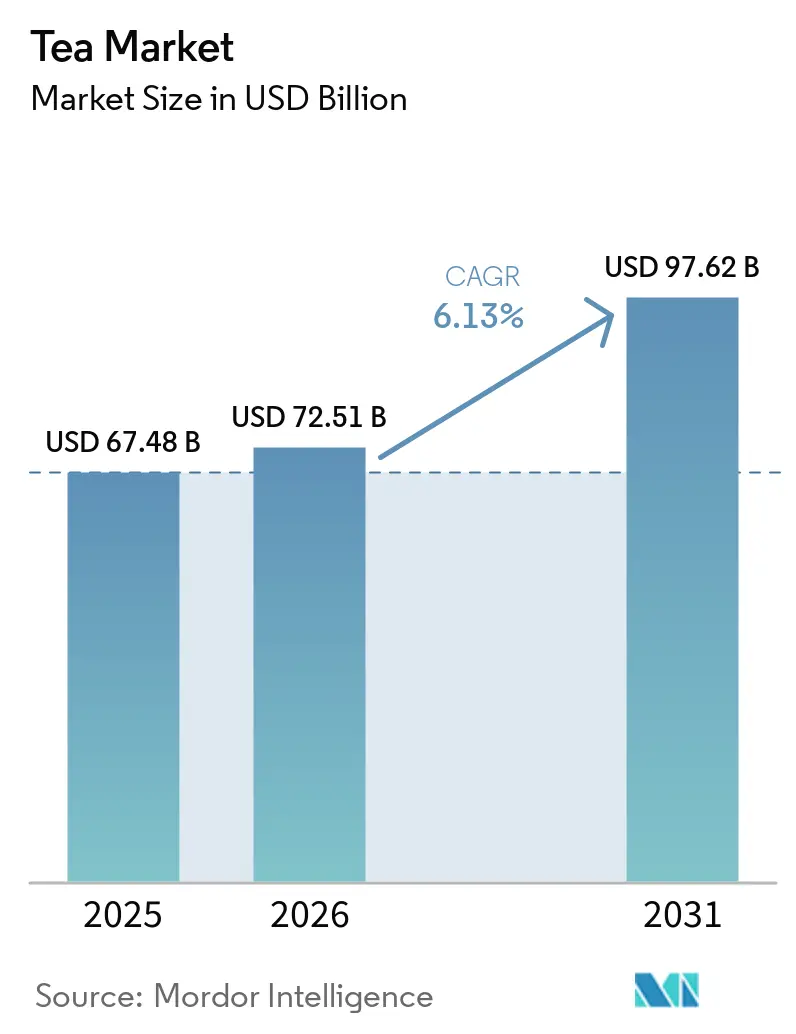
The tea market is expected to grow from USD 72.51 billion in 2026 to USD 97.62 billion by 2031, with a compound annual growth rate (CAGR) of 6.13% during the forecast period. This growth is driven by increasing consumer demand for healthier and premium tea options, as well as a focus on sustainability and certified production practices. Younger consumers, particularly those from the Gen Z demographic, are showing a preference for teas that are low in caffeine, organic, and ethically sourced. These consumers are prioritizing quality and value over quantity, which is influencing how companies approach their sales and distribution strategies. Brands are innovating by introducing new products, such as collagen-infused teas and environmentally friendly packaging, including mono-material pouches, which are attracting a broader range of consumers. Overall, the tea market remains moderately fragmented, with numerous players competing to meet evolving consumer preferences and regulatory requirements.
Key Report Takeaways
- By form, CTC (crush/tear/curl) tea commanded 61.25% of the tea market share in 2025, while leaf tea is projected to grow at a 6.45% CAGR through 2031.
- By product type, black tea accounted for 41.57% of the tea market size in 2025; herbal and fruit infusions are expected to expand at a 7.52% CAGR through 2031.
- By category, conventional tea held an 92.43% revenue share in 2025, whereas organic tea is forecasted to record the highest CAGR at 9.49% through 2031.
- By flavoring, unflavored tea accounted for 75.71% of sales in 2025, while flavored variants advanced at a 7.26% CAGR to 2031.
- By packaging type, box formats held a 71.25% share in 2025; pouches exhibited the fastest growth rate of 7.07% through 2031.
- By distribution channel, off-trade represented 69.05% share in 2025, yet on-trade is accelerating at 9.51% CAGR to 2031.
- By geography, Asia-Pacific led with 36.75% of tea market share in 2025; Middle East and Africa is the fastest-growing region at an expected 8.53% CAGR.
Note: Market size and forecast figures in this report are generated using Mordor Intelligence’s proprietary estimation framework, updated with the latest available data and insights as of January 2026.
Market Trends and Insights
Drivers Impact Analysis of Tea Market*
| Driver | (~) % Impact on CAGR Forecast | Geographic Relevance | Impact Timeline |
|---|---|---|---|
| Increased health consciousness boosting demand for green and herbal teas | +1.2% | Global, with concentration in North America, Europe, and urban Asia-Pacific | Medium term (2-4 years) |
| Consumer preference for sustainable and ethically sourced products | +0.9% | North America, Europe, Australia; emerging in Middle East premium segments | Long term (≥ 4 years) |
| Innovation in flavors, blends, and packaging | +1.5% | Global, led by Asia-Pacific (China, Japan) and North America | Short term (≤ 2 years) |
| Gen-Z preference for wellness teas with low caffeine or decaffeinated options | +0.8% | North America, Europe, urban Asia-Pacific (Singapore, South Korea) | Medium term (2-4 years) |
| Demand for single-origin tea driving premiumization | +0.6% | North America, Europe, Japan; niche growth in Middle East | Long term (≥ 4 years) |
| Tea consumption patterns and cultural importance | +0.7% | Asia-Pacific (China, India, Japan), Middle East, North Africa, United Kingdom | Long term (≥ 4 years) |
| Source: Mordor Intelligence | |||
Increased health consciousness is boosting the demand for green and herbal teas
Growing health awareness is driving the demand for green and herbal teas, as more consumers opt for beverages that offer additional health benefits beyond basic hydration. According to an article published by the Cleveland Clinic Organization in September 2024, drinking 2 to 4 cups of green tea daily can lower the risk of stroke by up to 24%[1]. Green tea contains compounds such as catechins and L-theanine, which are known to promote heart health, enhance cognitive function, and reduce stress levels. These proven health advantages are encouraging a shift, particularly among younger and health-conscious consumers, from sugary drinks to natural, low-calorie tea options. In response to this trend, brands are expanding their product offerings to include more functional teas for issues such as weight management. For instance, in June 2025, Tetley introduced Tetley Green Tea Slim Care, which is infused with L-Carnitine to cater to the growing interest in teas that support metabolism and weight management.
Gen-Z increasingly prefers wellness teas with low caffeine or decaffeinated options.
Gen Z's focus on wellness is driving a growing demand for low-caffeine and decaffeinated teas. Younger consumers are increasingly seeking beverages that support mental health, promote better sleep quality, and alleviate stress. This trend is supported by findings from Mental Health America’s 2024 Mind the Workplace report, which reveals that 71% of Gen Z employees and 59% of Millennials have poor workplace health scores[2]. Three out of four employees in the United States report that work-related stress negatively affects their sleep. As a result, many Gen Z consumers are turning to teas that offer relaxation or calm energy without causing overstimulation. This has led to a rising interest in low-caffeine options, CO₂-extracted decaffeinated teas, and herbal blends that maintain flavor while minimizing stimulant content. Brands that clearly label caffeine levels and market tea as a beverage for stress relief or evening relaxation are successfully meeting this demand.
Tea consumption patterns and their cultural importance
Tea consumption habits and their cultural importance are significant factors driving the tea market. The daily tradition of drinking tea ensures a steady and reliable demand in both developed and developing markets. According to the Tea and Coffee Trade Journal in May 2025, China had the highest per capita tea consumption at 1.92 kg per person annually, followed by Morocco at 1.87 kg, Ireland at 1.52 kg, and the United Kingdom at 1.36 kg[3]. These numbers demonstrate the profound impact of tea on the daily lives of people across various regions. In many countries, tea is a symbol of hospitality, a key part of social interactions, and a regular feature in workplace and home routines. This strong cultural connection drives frequent purchases, ensuring the market remains stable and resilient, even during periods of economic uncertainty. The growing popularity of specialty teas and health-conscious options has further strengthened tea's role in everyday life, contributing to the market's consistent growth.
Innovation in flavors, blends, and packaging
The tea market is evolving as companies are moving beyond traditional tea formats to attract younger audiences, health-conscious individuals, and environmentally aware buyers. Specialty teas, such as hojicha and oolong, which were once limited to niche cafés, are becoming widely available in mainstream retail stores. Sustainability in packaging has also emerged as a significant factor influencing consumer choices. For example, in July 2024, Esah Tea launched the world’s first microplastic-free tea bags made from biodegradable, chemical-free cotton. This innovation directly addresses increasing concerns about plastic contamination in tea bags. Functional and affordable tea formats are helping expand the market by reaching new consumer segments. In December 2025, Assam-based startup Oji introduced a ready-to-drink iced tea enriched with vitamin C, which positions tea as a strong competitor to juices and other functional beverages.
Restraints Impact Analysis of Tea Market*
| Restraint | (~) % Impact on CAGR Forecast | Geographic Relevance | Impact Timeline |
|---|---|---|---|
| Intense competition from coffee and other beverages | -0.8% | Global, particularly North America and Europe where coffee culture dominates | Short term (≤ 2 years) |
| Climate change and agricultural risks | -1.1% | Asia-Pacific (India, China, Sri Lanka, Kenya), East Africa | Long term (≥ 4 years) |
| Consumer shift toward instant and functional beverages | -0.6% | North America, Europe, urban Asia-Pacific | Medium term (2-4 years) |
| Regulatory challenges and import/export barriers | -0.5% | Global, with acute impact on cross-border trade between Asia, Europe, and North America | Medium term (2-4 years) |
| Source: Mordor Intelligence | |||
Intense competition from coffee and other beverages
Coffee and functional beverages are increasingly limiting the growth of the tea market by capturing frequent consumption occasions and a significant share of consumer spending. This trend is particularly evident in regions like North America and Europe, where coffee has become a staple in daily routines. For instance, the National Coffee Association’s Specialty Coffee Report from June 2025 revealed that 46 percent of American adults consumed specialty coffee in the past day. This highlights coffee’s stronghold on morning and on-the-go consumption occasions, areas where tea has traditionally competed. Innovations in coffee products, such as single-serve pods, nitro cans, and high-caffeine cold brews, have raised consumer expectations for convenience, flavor intensity, and functional benefits. At the same time, the rise of functional beverages, such as energy drinks and protein shakes, is further dividing consumer spending in the beverage market.
Regulatory challenges and import/export barriers hinder the smooth functioning of supply chains
Regulatory challenges and import and export barriers are slowing down the growth of the tea market by disrupting international trade and increasing costs across the supply chain. Tea producers must comply with stringent regulations, including limits on pesticide residues, food safety standards, and traceability requirements, particularly when exporting to major markets such as the European Union, the United States, and Japan. These regulations are often complex and subject to frequent changes, such as updates to maximum residue limits or new rules for packaging, labeling, and sustainability. As a result, producers face higher costs for testing, certification, and documentation, which can be particularly burdensome for small-scale growers and exporters. Import duties, port delays, and customs inspections further complicate the process. These issues slow down shipments, reduce the efficiency of supply chains, and increase the overall costs for tea brands.
*Our forecasts treat driver/restraint impacts as directional, not additive. The impact forecasts reflect baseline growth, mix effects, and variable interactions.
Tea Market Segment Analysis
By Form:
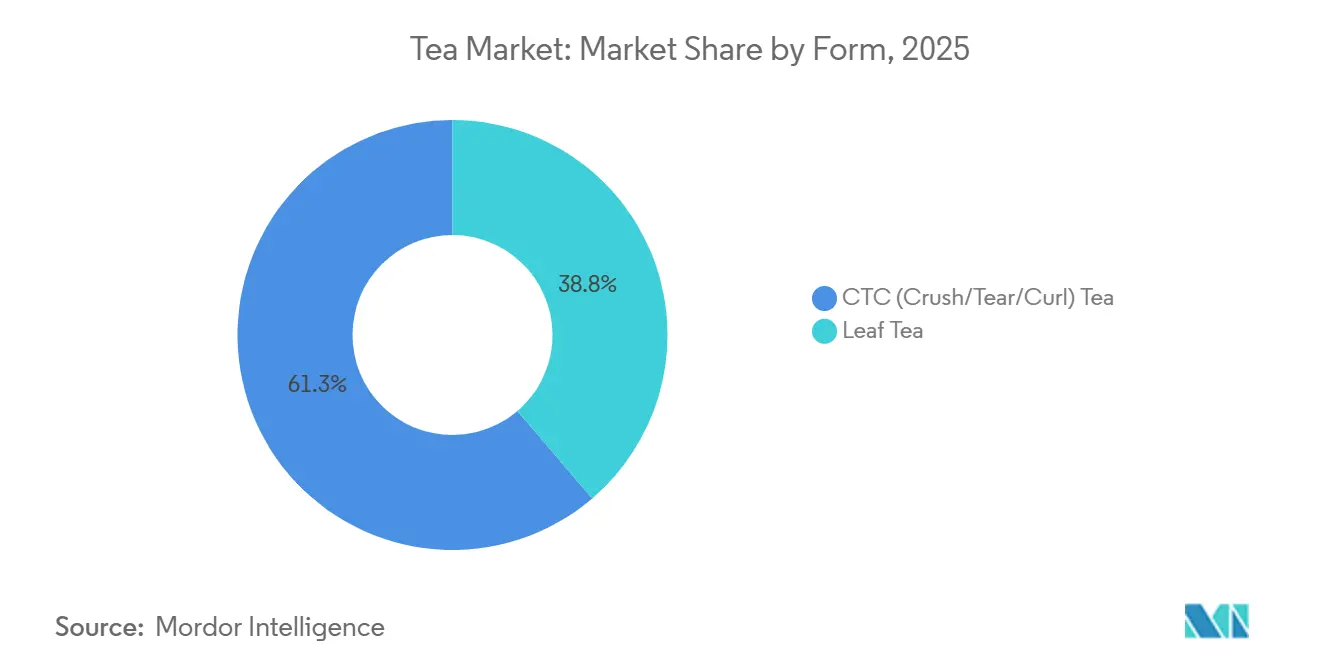
Leaf Premiumization Challenges CTC DominanceCTC (Crush, Tear, Curl) tea remains a dominant force in the tea market, primarily due to its widespread use in everyday consumption and mass-market channels. In 2025, it held a 61.25% global market share, reflecting its popularity in retail stores, foodservice outlets, and institutional catering. Its quick brewing process, strong flavor, and affordability make it a preferred choice for black tea blends, tea bags, and chai. This format is especially popular in high-demand regions, such as India, Africa, and parts of the Middle East, where it caters to large-scale consumption needs and remains a staple in the tea industry.
In contrast, leaf tea is emerging as the fastest-growing segment, driven by a shift toward premium and specialty products. This segment is projected to grow at a 6.45% CAGR through 2031, as consumers increasingly opt for whole-leaf, artisanal, and specialty teas. The growing interest in green, oolong, white, and high-quality black teas is supported by trends like café culture and home brewing. Leaf tea is often associated with better quality, authenticity, and health benefits, making it particularly appealing to urban and higher-income consumers who are willing to pay a premium for a superior tea experience.
By Product Type:
Herbal Infusions AccelerateBlack tea continued to dominate the tea market in 2025, accounting for 41.57% of the total market share. Its popularity is driven by its strong cultural significance in regions such as India, the United Kingdom, and the Middle East, where it is an integral part of daily routines. The versatility of black tea, which pairs well with milk, sugar, and various spices, makes it a favorite for both home consumption and food service. Its availability in various formats, such as tea bags, instant tea, and ready-to-drink options, ensures its appeal across different consumer segments, from budget-friendly to premium categories.
On the other hand, herbal and fruit infusions are emerging as the fastest-growing segment in the tea market, with a projected CAGR of 7.52% through 2031. These teas are gaining traction among health-conscious consumers who prefer caffeine-free and wellness-focused beverages. Popular for their perceived benefits, such as aiding relaxation, digestion, immunity, and sleep, these infusions are particularly appealing to younger demographics. The growing demand for natural, plant-based, and clean-label products is driving their adoption in regions such as North America, Europe, and the Asia Pacific. As a result, herbal and fruit teas are transitioning from niche wellness products to mainstream retail offerings, shaping the future growth of the tea market.
By Category:
Organic Certification Captures Value GrowthIn 2025, conventional tea remained the leading segment in the tea market, accounting for 92.43% of the total market share. This dominance is attributed to its affordability, large-scale production, and widespread availability in retail outlets like supermarkets and convenience stores, as well as foodservice channels. It remains a popular choice for daily consumption, particularly in high-demand regions such as India, China, and Africa, where tea is a cultural staple. Additionally, its strong presence in formats such as tea bags, loose tea, and institutional catering ensures consistent demand and reinforces its position as the backbone of the tea industry.
Meanwhile, organic tea is emerging as the fastest-growing segment, with a projected CAGR of 9.49% through 2031, driven by increasing consumer focus on health and sustainability. Concerns over pesticide residues, a preference for eco-friendly farming practices, and the demand for clean-label products are key factors boosting its popularity. The availability of organic tea has improved significantly through modern retail stores and e-commerce platforms, while certifications for organic products have built consumer trust. Although organic tea currently holds a smaller market share, its rapid growth indicates a shift toward healthier and more environmentally conscious choices among consumers.
By Flavouring:
Novelty Drives Flavoured UptakeUnflavored tea continued to dominate the tea market in 2025, accounting for 75.71% of the total market share. This dominance is largely due to cultural traditions in key tea-consuming countries, such as China, India, and Japan, where tea is valued for its natural taste and purity. These regions often prefer unflavored tea in loose-leaf forms, which are commonly used in ceremonial practices and daily brewing. The strong demand for unflavored tea spans both premium and mass-market segments, making it a staple choice for consumers in these markets.
On the other hand, flavored tea is the fastest-growing segment, expected to grow at a CAGR of 7.26% through 2031. This growth is driven by increasing consumer interest in diverse flavors and functional benefits. Younger and urban consumers are particularly drawn to blends featuring fruits, spices, flowers, and botanicals, as they offer unique taste experiences. The rise of ready-to-drink teas, café culture, and gifting options has further boosted the popularity of flavored teas. These factors are helping flavored teas carve out a larger share in the market by appealing to evolving consumer preferences.
By Packaging Type:
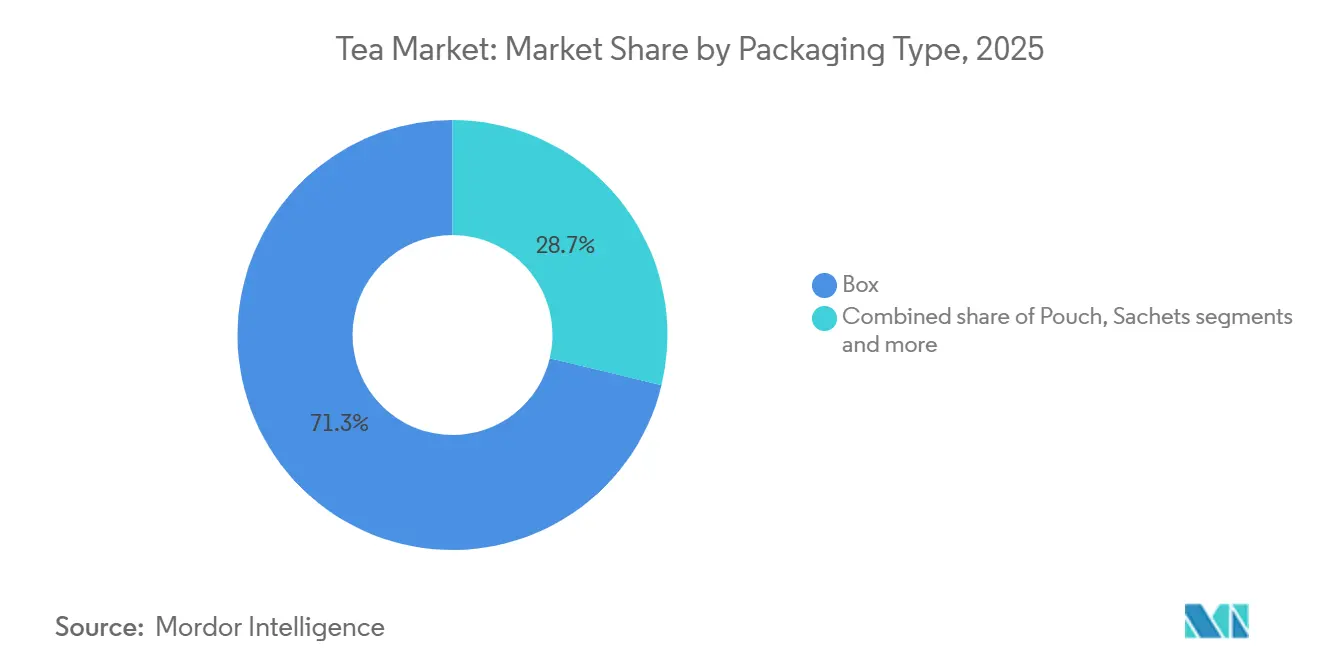
Pouches Reduce Environmental FootprintBox packaging remains the most popular choice in the tea market, holding 71.25% of the market share in 2025. This is largely because consumers are familiar with it, and it is easy to store and display on retail shelves. Carton boxes are widely used for packaging both tea bags and loose-leaf tea, offering good protection for the product and helping brands stand out. Their strong presence in supermarkets and traditional stores, combined with their ability to support large-scale distribution, ensures their continued dominance in the tea packaging market.
Meanwhile, pouches are quickly becoming the fastest-growing packaging option, with an expected CAGR of 7.07% through 2031. The rising demand for eco-friendly and cost-efficient packaging solutions drives this growth. Regulations like the EU Regulation 2025/40 are encouraging brands to switch to recyclable and compostable materials, making flexible mono-material and paper-based pouches more attractive. Pouches also use less material, are lighter for transportation, and have a smaller environmental impact. As a result, many tea manufacturers are moving away from rigid boxes and adopting pouches to meet both regulatory requirements and consumer preferences for sustainable packaging.

By Distribution Channel:
Experience-Led On-Trade ScalesOff-trade channels, including supermarkets, hypermarkets, convenience stores, and online platforms, held the largest share of the tea market in 2025, accounting for 69.05%. These channels are popular because they offer convenience, affordability, and easy access to a wide variety of tea products. Bulk purchasing options, promotional discounts, and strong shelf visibility make them the go-to choice for regular tea buyers. The growth of e-commerce and modern retail outlets has made it easier for consumers to explore and purchase different tea brands and formats from the comfort of their homes.
On the other hand, on-trade channels, including cafés, tea bars, and restaurants, are the fastest-growing segment, with a projected CAGR of 9.51% through 2031. The increasing popularity of café culture and premium tea experiences is driving this growth, as more people seek out specialty beverages like matcha lattes, bubble tea, and artisanal teas. Social dining, tourism, and the demand for unique, experiential retail experiences are also contributing to the rise of on-trade tea consumption. These venues are becoming important spaces for introducing premium tea products and enhancing brand visibility in the market.
Geography Analysis
APAC Tea Market
Asia Pacific was the largest regional market for tea, accounting for 36.75% of the global market value by 2025. A robust production base and a long-standing tradition of tea consumption drive this dominance. China and India lead both production and demand, while Japan boosts exports of specialty teas. Southeast Asia is experiencing rapid growth in the ready-to-drink tea segment, with countries like South Korea and Australia contributing through premium imports and a thriving café culture. The region’s focus on high-quality and certified teas ensures its central role in the tea market.
MEA Tea Market
The Middle East and Africa are the fastest-growing tea markets, with a CAGR of 8.53% through 2031. Urbanization, a young population, and increasing demand for imported packaged beverages are driving this growth. Gulf countries are expanding their retail and foodservice sectors, while East Africa remains a key supplier of black tea globally. In North Africa, traditional green tea and mint blends are popular, but premium and organic teas are gaining attention among urban consumers. However, the region faces challenges such as agricultural risks and climate-related issues that could impact supply.
Europe and the Americas Tea Market
Europe and North America are mature tea markets but continue to grow through innovation and sustainability efforts. In Europe, stricter regulations are pushing companies to adopt recyclable and compostable packaging, which is changing product designs and shelf displays. In the United States and Canada, there is rising demand for cold-brew, ready-to-drink, and wellness-focused teas, supported by cafés, specialty stores, and online platforms. South America, though smaller in market size, is seeing increased interest in herbal and wellness teas, particularly in countries like Brazil and Chile, where health awareness is growing.
Regulatory Landscape
Tea is regulated under food safety, contaminants and pesticide maximum residue limits (MRLs), labeling, and increasingly, packaging sustainability rules, which shape cross-border trade into major consuming markets. In the European Union, Commission Regulation (EU) 2023/1536 tightened MRL requirements for nicotine in tea, with the updated limit applying after 22 February 2026, increasing testing and documentation intensity for exporters supplying EU buyers.
National regimes add product-definition and quality requirements that affect formulation and compliance spend for brands. India regulates tea under FSSAI standards covering identity and purity, including requirements relevant to flavored tea, while China implemented GB 31608-2023 from 2024, setting food safety requirements covering sensory properties, contaminants, and pesticide residues. In Africa, Kenya uses licensing and standards alignment (including ISO-linked national standards) across participants in the tea value chain, while Nigeria's NAFDAC published draft Tea and Related Products Regulations (2026) that include caffeine thresholds for decaffeinated tea and instant decaffeinated tea, reinforcing the need for batch testing and accurate label claims for both imported and locally produced products.
Value Chain Analysis
The global tea value chain runs from input supply and cultivation on farms and estates through primary processing (withering, rolling/CTC manufacture, and drying), then aggregation and price discovery via brokers and auctions. After that, blending, flavoring, and packaging often move closer to consuming markets, with downstream actors capturing more value while upstream participants face higher supply and logistics exposure.
Major trade hubs anchor bulk black-tea flows, including Mombasa (Kenya), Colombo (Sri Lanka), and Kolkata (India), supporting export-oriented shipments into Europe, North America, and the Middle East. Climate variability and operational constraints in producing regions can tighten leaf availability and quality, and disruption on major shipping corridors has added lead-time uncertainty for exporters and importers, which keeps diversified sourcing, inventory buffers, and contracted logistics in focus. Sustainability and human-rights due diligence programs, including initiatives disclosed by large brand owners and buyers, are also becoming operational requirements, pushing traceability, audit readiness, and certification alignment deeper into farm-level procurement and factory processing.
Competitive Landscape
The tea market is moderately fragmented, which indicates a mix of large multinational companies and numerous regional or niche players. Major brands, such as Unilever, Tata Consumer Products, and Associated British Foods, dominate the market due to their strong distribution networks, brand recognition, and cost advantages resulting from large-scale operations. However, smaller brands are increasingly competing by focusing on unique selling points such as wellness benefits, premium quality, and authentic origin stories. This creates a competitive environment where both large-scale operations and niche branding strategies are essential for success.
Leading companies are actively investing in strategies to maintain their market positions and adapt to changing consumer preferences. For example, Tata Consumer Products is expanding its presence in cafés and out-of-home consumption through its partnership with Starbucks, targeting premium tea drinkers. Unilever has revamped its Lipton brand by introducing sustainable packaging and certifications, while Associated British Foods, through its Twinings brand, has focused on eco-friendly tea bags and compliance with environmental regulations. These efforts help established brands stay relevant as consumers increasingly prioritize sustainability, ethics, and quality in their purchasing decisions.
Meanwhile, smaller premium brands like Rishi Tea and Botanicals, Numi Organic Tea, and Dilmah are gaining traction by emphasizing organic ingredients, direct trade practices, and transparency in their supply chains. These brands are also leveraging technology, such as traceability tools and digital engagement, to connect with consumers and justify higher price points. Additionally, large beverage companies are entering the tea segment through partnerships and innovations in ready-to-drink products, such as PepsiCo’s collaborations in Asia and North America. As a result, the market is evolving into a structure where global giants dominate one end, while premium, craft-focused brands thrive on the other, creating a dynamic and competitive landscape.
Tea Industry Leaders
-
PepsiCo Inc.
-
Tata Consumer Products Ltd.
-
Associated British Foods PLC
-
ITO EN, Ltd.
-
Unilever plc
- *Disclaimer: Major Players sorted in no particular order
Tea Market Companies Covered in this Report
- PepsiCo Inc.
- Tata Consumer Products Ltd.
- Associated British Foods PLC
- ITO EN, Ltd.
- The Hain Celestial Group, Inc.
- Taiwan Tea Corporation
- RC Bigelow, Inc.
- Dilmah Ceylon Tea Company PLC
- DavidsTea Inc.
- Harney & Sons Fine Teas
- Apeejay Surrendra Group
- Rishi Tea & Botanicals
- Lupicia Co., Ltd.
- Kirin Holdings Co., Ltd.
- Ten Ren Tea Co.
- Unilever plc
- JAB Holding Company
- McLeod Russel India Limited
- Teekanne GmbH & Co. KG
- Numi Organic Tea
- The Republic of Tea
- Bettys & Taylors of Harrogate Ltd.
Market Opportunities and Future Outlook
Capacity additions and format shifts toward instant and ready-to-drink (RTD) tea create near-term whitespace in manufacturing, private label, and ingredient supply. In May 2026, Tata Consumer Products approved up to INR 160 crore to build a 2,000 MT instant tea manufacturing facility in India, pointing to continued investment in soluble formats that support RTD, foodservice, and convenience-led consumption. Functional positioning is also expanding within mainstream RTD tea, illustrated by the April 2026 launch of Pure Leaf Mental Focus in the United States by the Pepsi Lipton Tea Partnership, which combines caffeine and L-theanine in a sparkling tea format.
Sustainability-driven compliance and packaging transition are another opportunity area across brands and converters, particularly for suppliers that can deliver traceability, residue-compliant sourcing, and recyclable packaging systems at scale. Reported innovations such as microplastic-free tea bag materials and the growing use of mono-material pouches align with tighter packaging and food-contact scrutiny, while EU MRL updates such as Commission Regulation (EU) 2023/1536 (applying after 22 February 2026) increase demand for standardized testing, documentation, and quality assurance services across exporter networks. On the production and distribution side, regional hub investments are also supporting responsiveness, including Dammann Freres inaugurating a 26,500 square meter production hub in Dreux, France (April 2026), which supports faster blending and packing for European customers.
Recent Industry Developments in Tea Market
- May 2026: Tata Consumer Products approved a capital investment of up to INR 160 crore to construct a new 2,000 MT capacity instant tea manufacturing facility in India. The project strengthens in-house supply of soluble tea used across instant and ready-to-drink applications and supports scalability for high-volume channels. It also increases competitive pressure on regional instant tea suppliers and contract processors serving brand owners.
- April 2026: The Pepsi Lipton Tea Partnership launched Pure Leaf Mental Focus, a sparkling functional ready-to-drink tea line in the United States featuring caffeine and L-theanine. The launch expands tea's presence in functional beverage occasions that are commonly served by energy and wellness drinks. It also raises the bar for formulation, claims discipline, and speed-to-market in RTD tea portfolios.
- April 2026: Dammann Freres inaugurated a 26,500 square meter production hub in Dreux, France, enabling faster blending and packing responsiveness for European customers. The hub strengthens regional production capacity and supports accelerated supply to European retailers.
Tea Market Report Scope and Research Methodology
Market Definition and Coverage
For this study, the tea market covers the value of tea sold for consumption as hot or cold brewed products, including conventional and organic tea, and including flavored variants across major regions.
Scope exclusions: We exclude coffee and cocoa, and we also exclude tea accessories and brewing equipment because they do not represent tea sales.
Segments Covered in This Report
- By Form
- Leaf Tea
- CTC (Crush/Tear/Curl) Tea
- By Product Type
- Black Tea
- Green Tea
- Oolong Tea
- Herbal and Fruit Tea Infusions
- Other Product Types
- By Category
- Conventional Tea
- Organic Tea
- By Flavouring
- Unflavoured
- Flavoured
- By Packaging Type
- Box
- Bag
- Pouch
- Sachets
- Other Packaging Type
- By Distribution Channel
- Off-Trade
- Supermarkets/Hypermarkets
- Convenience/Grocery Stores
- Online Retail Stores
- Other Distribution Channels
- On-Trade
- Off-Trade
- By Geography
- North America
- United States
- Canada
- Mexico
- Rest of North America
- South America
- Brazil
- Colombia
- Chile
- Peru
- Argentina
- Rest of South America
- Europe
- United Kingdom
- Germany
- France
- Italy
- Spain
- Poland
- Belgium
- Sweden
- Rest of Europe
- Asia-Pacific
- China
- Japan
- India
- Australia
- Indonesia
- South Korea
- Thailand
- Singapore
- Rest of Asia-Pacific
- Middle East and Africa
- South Africa
- Saudi Arabia
- United Arab Emirates
- Nigeria
- Egypt
- Morocco
- Turkey
- Rest of Middle East and Africa
- North America
Data Sources, Market Sizing, and Validation
Desk Research
Desk work was used to set the market boundary and to build the starting data series that a model can stand on. We relied on public production, consumption, and trade signals for tea, then used them to understand supply availability, export intensity, and demand direction by region.
Examples of sources that supported this step include FAOSTAT for agriculture output, UN Comtrade for trade flows, and national statistics releases for food and beverage consumption where available. We also used publications and data pages from tea boards and trade bodies such as the International Tea Committee summaries, along with peer reviewed food science and nutrition literature to track product shifts like green tea, herbal infusions, and organic demand. Company filings, investor presentations, and reputed press were reviewed to understand portfolio mix, pricing direction, and channel emphasis. In addition, we used paid subscriptions for company financials and intelligence, patent databases, and shipment-level import/export checks where relevant. This desk research list is not exhaustive, and many other sources were also reviewed to collect data, validate assumptions, and clarify gaps.
Primary Interviews and Surveys
Primary work focused on aligning desk signals with what buyers and sellers are actually seeing, especially on pricing, channel mix, and demand shifts by tea type. We spoke with producers, blenders, packers, distributors, retailers, and foodservice stakeholders, and we also included functional experts from sales, procurement, and category management across APAC, EMEA, and the Americas.
Distribution of primary research fieldwork respondents
| Company type | Respondent position | Region |
|---|---|---|
| Top tier: 27% | CXOs: 21% | APAC: 39% |
| Mid tier: 52% | Functional/Unit leaders: 34% | EMEA: 36% |
| Smaller Players: 21% | Managers: 45% | Americas: 25% |
Market-Sizing & Forecasting
Sizing starts from a top-down build where production and trade data reconstruct the available tea pool by region, which is then filtered through apparent consumption patterns and category splits such as black, green, oolong, and herbal or fruit infusions. To keep the value estimate grounded, we translate volume signals into value using pricing logic that is consistent with packaging formats, channel mix (on-trade versus off-trade), and the observed premiumization in specialty and organic lines.
Once the first cut is ready, we corroborate totals with selective bottom-up checks so the number remains realistic. These checks use supplier and brand revenue context from public filings, channel checks with distributors and retailers, and sampled price per unit mapped to plausible volumes for key countries where tea is heavily consumed. When gaps show up, the model is adjusted using a simple rule set that prioritizes the most verifiable signals, such as export intensity, retail price movements, and the share of packaged tea versus loose tea.
For forecasting, scenario analysis is used because tea demand is shaped by several moving parts that do not always trend in a straight line. Inputs that matter in the forward view include planted area and yield direction, export share changes, inflation driven retail pricing, organic and flavored uptake, and channel shifts between home consumption and out-of-home use. Assumptions are aligned to expert views from interviews, then stress tested so the forecast remains stable even when one variable, like pricing, moves faster than expected.
Data Validation & Update Cycle
Validation is done through several passes so that one data source does not overly steer the outcome. We compare outputs against independent signals such as production versus absorption gaps, export volumes, and country level consumption direction, and then we review any large variances before final sign-off.
If an anomaly is found, we revisit the inputs, recheck currency timing, and re-contact relevant respondents to confirm the explanation. Reports are refreshed annually, and interim updates are made when material events occur, such as major supply shocks, abrupt price swings, or trade policy changes. Before delivery, an analyst completes a fresh pass to confirm the latest assumptions are reflected in the final view.
Mordor Intelligence's Global Tea Market Size Measured Against Other Published Estimates
Published tea market values often differ because each publisher chooses a different boundary, then applies its own conversion from volumes and prices into a single value number. In tea, the biggest confusion usually comes from mixing retail value with trade value, and from treating herbal infusions, RTD tea, and foodservice consumption in different ways.
Production and export tonnage signals, together with on-trade versus off-trade channel checks, are the evidence points that keep Mordor Intelligence tied to a broad tea consumption value pool that counts conventional, organic, and flavored tea sold across regions, rather than only a narrow packaged retail subset.
Benchmark comparison
| Source | Market Size | Gaps in Research Methodology |
|---|---|---|
| Mordor Intelligence | USD 159.53 B (2026) | |
| Trade Journal A | USD 91.98 B (2030) | This figure is presented as a forward value and is cited from another report, and it likely reflects a narrower product boundary or a different value layer (often packaged retail only), which can exclude foodservice volumes and some tea formats captured in broader consumption sizing. |
| Industry Publisher B | USD 26.80 B (2024) | The estimate is much smaller because the implied scope can be limited to select packaged categories and may not consistently convert global volume signals into value across both loose and packaged tea, which can undercount high-consumption regions when pricing and channel mix are not reconciled. |
The spread across the table is mainly explained by what is counted as tea value, and which year is used as the anchor for the number. By keeping the scope explicit and checking it against observable production, trade, and channel patterns, the sizing remains traceable to clear steps that can be repeated and reviewed.
Key Questions Answered in the Report
How large will the global tea market be by 2031?
It is forecast to reach USD 97.62 billion by 2031, growing at a 6.13% CAGR.
Which tea segment is expanding the quickest?
Organic certified products lead with a 9.49% CAGR as tighter enforcement boosts consumer trust.
Which distribution channel is growing fastest?
On-trade venues such as cafés and specialty bars register the highest 9.51% CAGR as consumers pay premiums for curated experiences.
Why is Gen Z important to tea growth?
Gen Z drives demand for low-caffeine, functional blends and amplifies product discovery on social media, influencing reformulation and labeling transparency.