
Market Overview
| Study Period | 2021 - 2031 |
|---|---|
| Market Size (2026) | USD 46.44 Billion |
| Market Size (2031) | USD 59.43 Billion |
| Growth Rate (2026 - 2031) | 5.05 % |
| Fastest Growing Market | Asia Pacific |
| Largest Market | North America |
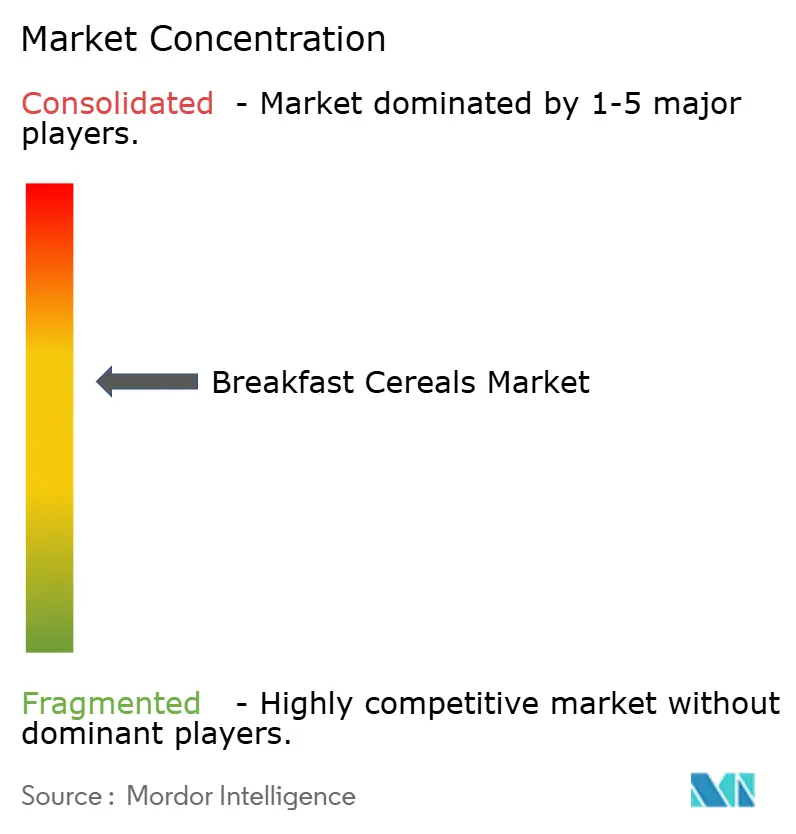
| Market Concentration | Medium |
Major Players *Disclaimer: Major Players sorted in no particular order Image © Mordor Intelligence. Reuse requires attribution under CC BY 4.0. | |
Breakfast Cereals Market Analysis by Mordor Intelligence
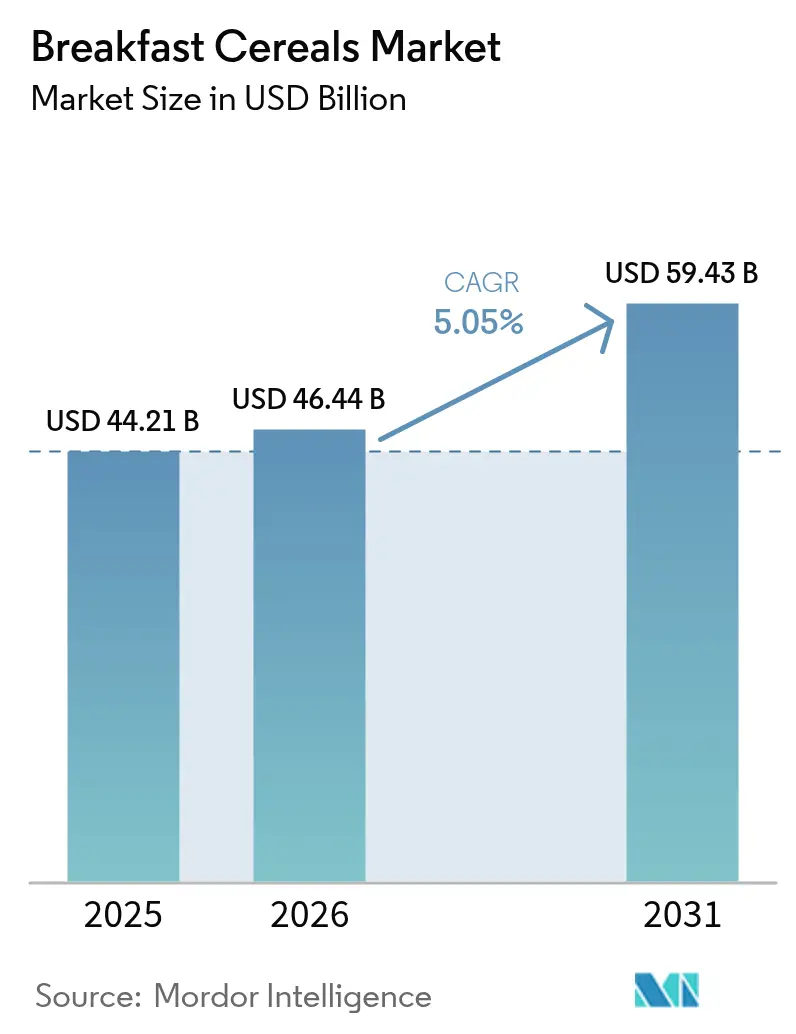
The global breakfast cereals market size was valued at USD 44.21 billion in 2025 and estimated to grow from USD 46.44 billion in 2026 to reach USD 59.43 billion by 2031, at a CAGR of 5.05% during the forecast period (2026-2031). The market growth is driven by changing consumer preferences, increased health consciousness, and demand for convenient breakfast options. The fast-paced modern lifestyle has increased the demand for ready-to-eat and hot cereal products that offer quick meal solutions. Consumers are seeking cereals with enhanced nutritional profiles, including those fortified with fiber, protein, whole grains, and probiotics, while preferring options with reduced sugar content. The market is also experiencing growth in plant-based, organic, and gluten-free varieties to meet specific dietary requirements. In addition, the rise of e-commerce and digital grocery platforms has improved product accessibility, particularly in developing markets, contributing to the breakfast cereals market's expansion.
Key Report Takeaways
- By product type, ready-to-eat cereals led with 74.60% of breakfast cereals market share in 2025; the ready-to-cook segment is advancing fastest at a 5.75% CAGR through 2031.
- By ingredient source, corn captured a 36.40% share of the breakfast cereals market size in 2025, whereas oat-based products are set to expand at a 6.25% CAGR to 2031.
- By packaging, traditional paperboard boxes retained 64.70% of 2025 revenue, while cups and other on-the-go formats are growing at a 9.45% CAGR, reflecting evolving packaging trends in the breakfast cereals market.
- By distribution channel, supermarkets/hypermarkets commanded 54.70% share of the breakfast cereals market size in 2025, while online retailers are advancing at an 10.85% CAGR through 2031.
- By age group, adults accounted for 47.60% of the breakfast cereals market share in 2025, while the children’s segment is projected to grow at a 5.07% CAGR through 2031.
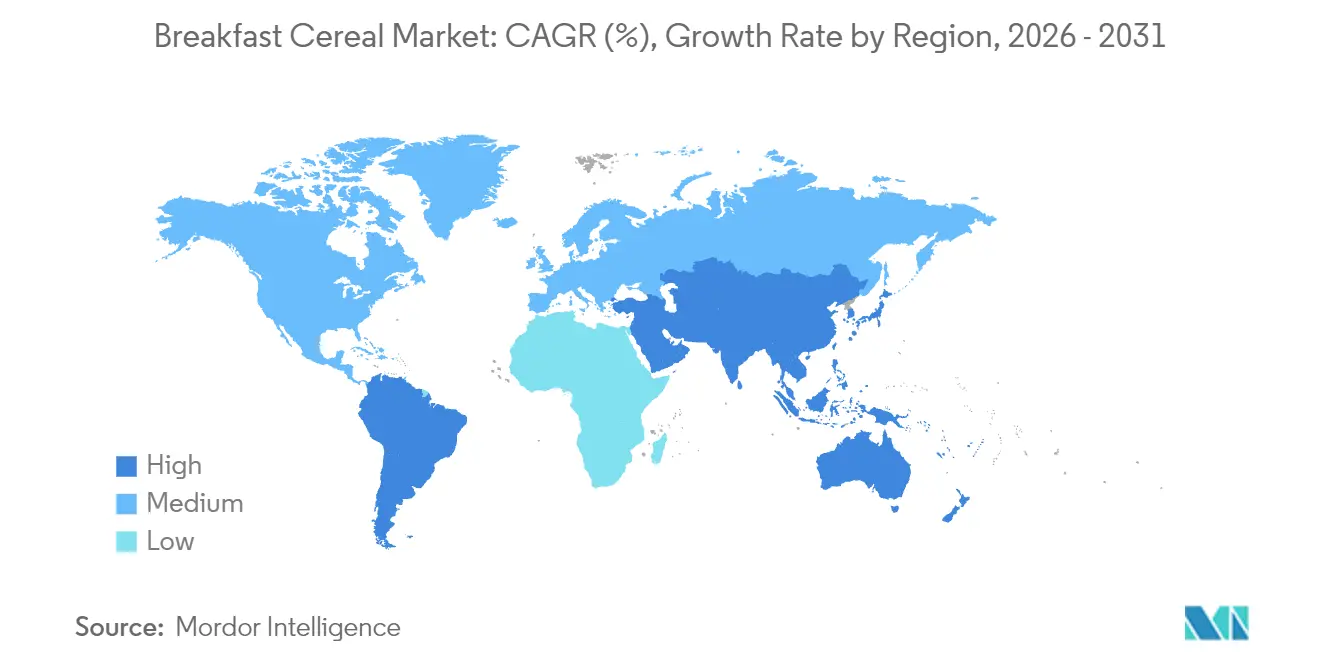
- By geography, North America maintained a 36.30% share of the breakfast cereals market in 2025; Asia-Pacific is projected to rise at a 6.10% CAGR over 2026-2031.
Note: Market size and forecast figures in this report are generated using Mordor Intelligence’s proprietary estimation framework, updated with the latest available data and insights as of 2026.
Market Trends and Insights
Drivers Impact Analysis of Breakfast Cereals Market*
| Driver | (~) % Impact on CAGR Forecast | Geographic Relevance | Impact Timeline |
|---|---|---|---|
| Rising demand for high-protein cereal variants among consumers | +1.2% | Global, with concentration in North America and Europe | Medium term (2-4 years) |
| Surge in single-serve breakfast habits fueling on-the-go cereal cups | +0.8% | Global, particularly urban centers in Asia-Pacific and North America | Short term (≤ 2 years) |
| Growing penetration of gluten-free grains expanding multi-grain cereals | +1.1% | North America and Europe core, expanding to Asia-Pacific | Medium term (2-4 years) |
| Private-label premiumization driving value growth | +0.7% | Global, with strongest impact in Europe and North America | Long term (≥ 4 years) |
| Production technology advances enhance product quality | +0.9% | Global, with early adoption in developed markets | Long term (≥ 4 years) |
| Rising children's population increases nutritional focus | +0.6% | Asia-Pacific core, spill-over to Middle East and Africa and South America | Long term (≥ 4 years) |
| Source: Mordor Intelligence | |||
Rising Demand for High-Protein Cereal Variants Among Consumers
The breakfast cereals market is experiencing a notable transition toward protein-enriched products, driven by increased consumer focus on nutrition and health. In December 2024, General Mills Inc. expanded its Cheerios portfolio by introducing Cheerios Protein, which contains 8 grams of protein per serving. This product launch reflects market trends, supported by the 2024 Food and Health Survey from the International Food Information Council, which revealed that 71% of consumers aim to increase their protein consumption [1]. The protein cereal segment has gained particular momentum among millennial parents seeking both nutritional value and convenience, enabling manufacturers to implement premium pricing strategies. Manufacturers are also expanding their protein sources beyond dairy to include plant-based alternatives, addressing the growing flexitarian consumer base and creating new market opportunities in the breakfast cereal category. This shift continues to shape the breakfast cereals market.
Surge in Single-Serve Breakfast Habits Fueling On-the-Go Cereal Cups
The global breakfast cereals market is experiencing significant growth driven by increasing demand for single-serve and on-the-go breakfast formats, particularly cereal cups. This trend reflects the impact of urbanization and changing lifestyles among working professionals and students who have limited time for traditional breakfast meals. Single-serve cereal cups meet consumer needs by combining convenience with nutrition through portable, portion-controlled options that are easy to prepare. These formats are particularly popular in urban areas where consumers often eat breakfast during their commute or at work. Also, major cereal manufacturers are responding by diversifying their product lines with portable formats that incorporate ingredients such as granola, oats, seeds, and various milk options. The products feature improved packaging designs, including microwaveable containers, resealable lids, and recyclable materials, which enhance both functionality and environmental sustainability in the breakfast cereals market. For instance, in October 2024, Inventure launched four of its popular cereal flavors in a new 'on the go' cup format, designed for consumption at pre-school, office, or as a snack, requiring consumers to simply peel back the lid and add milk.
Growing Penetration of Gluten-Free Grains Expanding Multi-Grain Cereals
The global breakfast cereals market is experiencing growth driven by the increasing adoption of gluten-free grains and multi-grain cereals. Rising cases of gluten sensitivity, celiac disease, and consumer preference for gluten-free options have increased the demand for cereals made from alternative grains, including quinoa, amaranth, millet, sorghum, buckwheat, and brown rice. These alternatives address dietary restrictions while meeting consumer interest in wellness and gut health. Multi-grain cereals are gaining popularity due to their nutritional benefits across the breakfast cereals market, including high fiber content, essential vitamins, minerals, and complex carbohydrates that support digestive health, sustained energy, and cardiac function. For instance, in May 2024, Three Wishes, a family-owned health-focused cereal brand, launched its first grain-free granola line in three varieties: Chocolate Almond, Maple Pecan, and Original.
Private-Label Premiumization Driving Value Growth
Private label breakfast cereal brands have evolved from basic lower-cost alternatives into significant market competitors within the breakfast cereals segment. The Private Label Manufacturers Association's 2024 Annual Private Label Report indicates that store brand sales grew by 4.7% in 2023 compared to 2022. This transformation is particularly evident in health-focused breakfast cereal segments, where retailers use adaptable supply chains to introduce products that meet emerging nutritional preferences in the breakfast foods category. Retailers have enhanced their private label breakfast cereal offerings through improved packaging and merchandising while maintaining competitive pricing against national breakfast cereal brands. This increased competition has prompted national breakfast cereal manufacturers to accelerate product innovation and reevaluate their market positioning. The private label growth in breakfast cereals is strongest in North America and Europe, where consolidated retailers have developed robust consumer research capabilities and product development infrastructure for breakfast food categories.
Restraints Impact Analysis of Breakfast Cereals Market*
| Restraint | (~) % Impact on CAGR Forecast | Geographic Relevance | Impact Timeline |
|---|---|---|---|
| Volatile oat and corn commodity prices compressing margins | -0.9% | Global, with acute impact in North America and Europe | Short term (≤ 2 years) |
| Intensifying anti-sugar advocacy affecting cereal sales | -0.7% | Global, with regulatory leadership in North America and Europe | Medium term (2-4 years) |
| Environmental concerns about packaging | -0.5% | Global, with regulatory pressure in Europe and North America | Medium term (2-4 years) |
| Supply chain issues and raw material cost fluctuations | -0.4% | Global, with acute impact in emerging markets | Short term (≤ 2 years) |
| Source: Mordor Intelligence | |||
Volatile Oat and Corn Commodity Prices Compressing Margins
Cereal manufacturers face increasing margin pressure as key ingredient costs experience significant volatility, affecting pricing strategies and production planning. The Food and Agriculture Organization (FAO) forecasts global cereal trade to decline to 478 million tonnes in 2024/25, a 6.8% decrease from 2023/24. Agricultural adaptations, including stress-tolerant hybrids and improved farming practices, have partially offset grain price volatility caused by climate change and erratic weather patterns. However, market dynamics remain unstable. The United States Department of Agriculture (USDA) projects tightening supplies for key grains in 2024-25, despite minor increases in global wheat production. This supply constraint affects manufacturers with global supply chains, as regional production disruptions impact interconnected ingredient markets. Companies are managing these challenges through long-term supplier contracts, flexible ingredient formulations, and hedging programs to stabilize input costs.
Intensifying Anti-Sugar Advocacy Affecting Cereal Sales
Growing consumer awareness of sugar's health implications presents a significant market restraint, fundamentally impacting product development and market performance across the breakfast cereals category. This constraint is particularly evident in children's cereals, where manufacturers face increasing pressure to reduce high sugar content, which traditionally served as a key taste differentiator. In 2024, the Food and Drug Administration (FDA)'s Dietary Guidelines Advisory Committee report further intensifies market challenges by recommending added sugar limitation to less than 10% of daily calories and identifying breakfast cereals as a major source of hidden sugars in the diet. In response to these market constraints, manufacturers are implementing various reformulation strategies, including alternative sweeteners, flavor-enhancing technologies that maintain sweetness perception at lower sugar levels, and gradual reduction approaches to minimize consumer rejection across the breakfast cereals market.
*Our forecasts treat driver/restraint impacts as directional, not additive. The impact forecasts reflect baseline growth, mix effects, and variable interactions.
Breakfast Cereals Market Segment Analysis
By Ingredient Source:
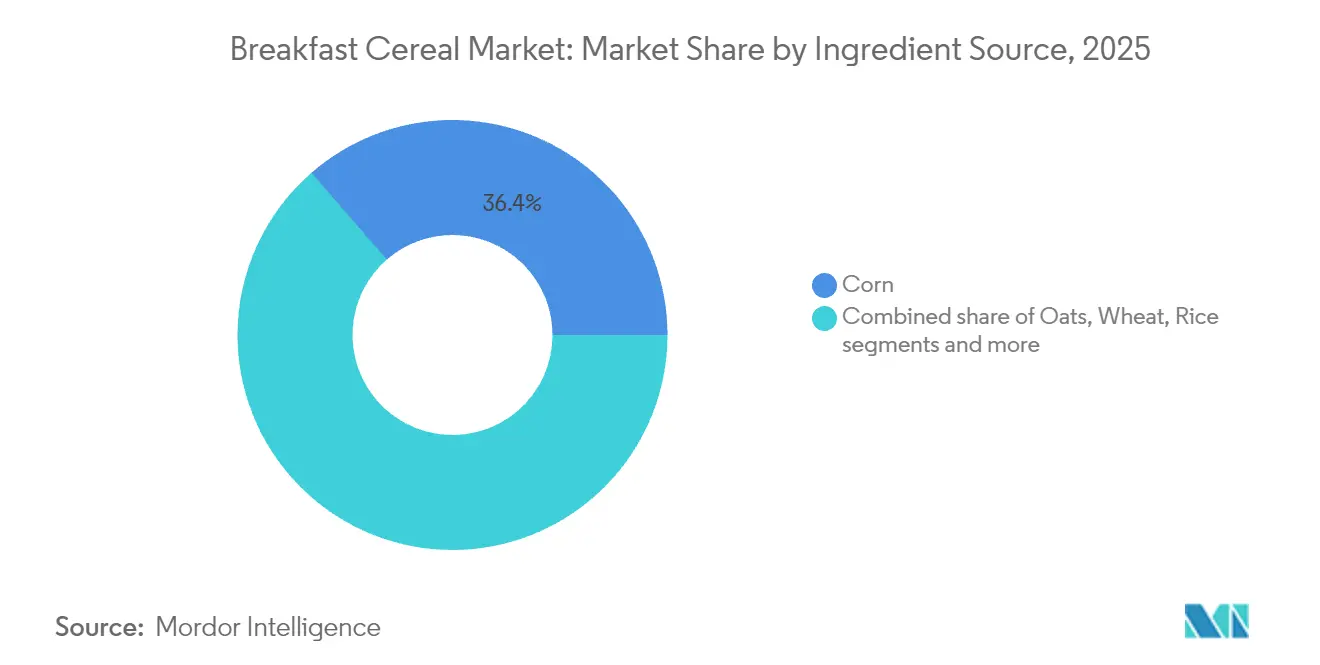
Corn Leads While Oats SurgeCorn-based cereals hold a dominant 36.40% market share in 2025, benefiting from cost advantages and manufacturing efficiencies that enable competitive pricing in value segments. Oat-based products show the highest growth rate at 6.25% CAGR (2026-2031), supported by their established nutritional benefits and adaptability in both ready-to-eat (RTE) and ready-to-cook (RTC) formats. Technological advancements in oat processing have improved texture and flavor while maintaining nutritional value. The European Union leads global oats production at 33%, followed by Canada at 15% for 2024/25, according to the United States Department of Agriculture (USDA) . The regional consumption of oat-based breakfast cereals continues to increase, driven by consumer demand for nutritious, high-fiber breakfast products in the breakfast cereals market.
Wheat-based cereals continue to hold substantial market share, especially in flaked formats, while rice-based cereals gain traction in the gluten-free category. Barley remains limited to multi-grain formulations despite its nutritional benefits. Alternative grains, including quinoa and amaranth, show rapid growth in premium segments, though their overall market share remains small. This expanding range of grain sources reflects industry efforts to develop distinct products for specific dietary requirements, as demonstrated by Nestlé's commitment to using whole grains as the primary ingredient in all their ready-to-eat cereals.

By Product Type:
RTE Dominates While RTC AcceleratesReady-to-eat (RTE) cereals hold a dominant 74.60% market share in 2025, primarily due to their convenience for time-constrained households. Ready-to-cook (RTC) cereals are experiencing faster growth with a CAGR of 5.75% (2026-2031), as consumers increasingly view hot cereals as more nutritious and filling. Hot oatmeal, in particular, has gained popularity due to its health benefits and adaptability for customization with various toppings.
In the Ready-to-eat (RTE) segment, flakes remain the largest sub-segment, while granola and clusters show higher growth rates due to their wholesome ingredients and texture. Protein enrichment is driving new product development in this category. For example, in November 2024, FUEL10K introduced Multigrain Flakes in Chocolate and Red Berry flavors, featuring high-protein, high-fiber wholegrain wheat flakes. In the RTC segment, premium muesli and specialized porridge mixes are growing faster than basic oatmeal, indicating consumers' willingness to pay more for higher quality and enhanced nutritional benefits.
By Packaging Type:
Boxes Dominate While Cups InnovateTraditional boxes hold a dominant 64.70% market share in 2025, supported by established manufacturing infrastructure and consumer familiarity. Cups and bowls represent the fastest-growing segment with a projected 9.45% CAGR from 2026 to 2031, as they meet the needs of consumers seeking convenience. This format shift enables cereal consumption beyond breakfast, creating new opportunities in the snacking category.
Stand-up pouches are increasing in adoption within premium and natural cereal segments, offering product differentiation and freshness preservation. The "others" category, comprising plastic jars and bags, serves specific market segments but faces limitations in growth due to production costs and environmental concerns. Manufacturers are focusing their packaging development on both functional improvements and environmental responsibility, with substantial investment in research and development of biodegradable and recyclable materials that maintain product protection standards.
By Distribution Channel:
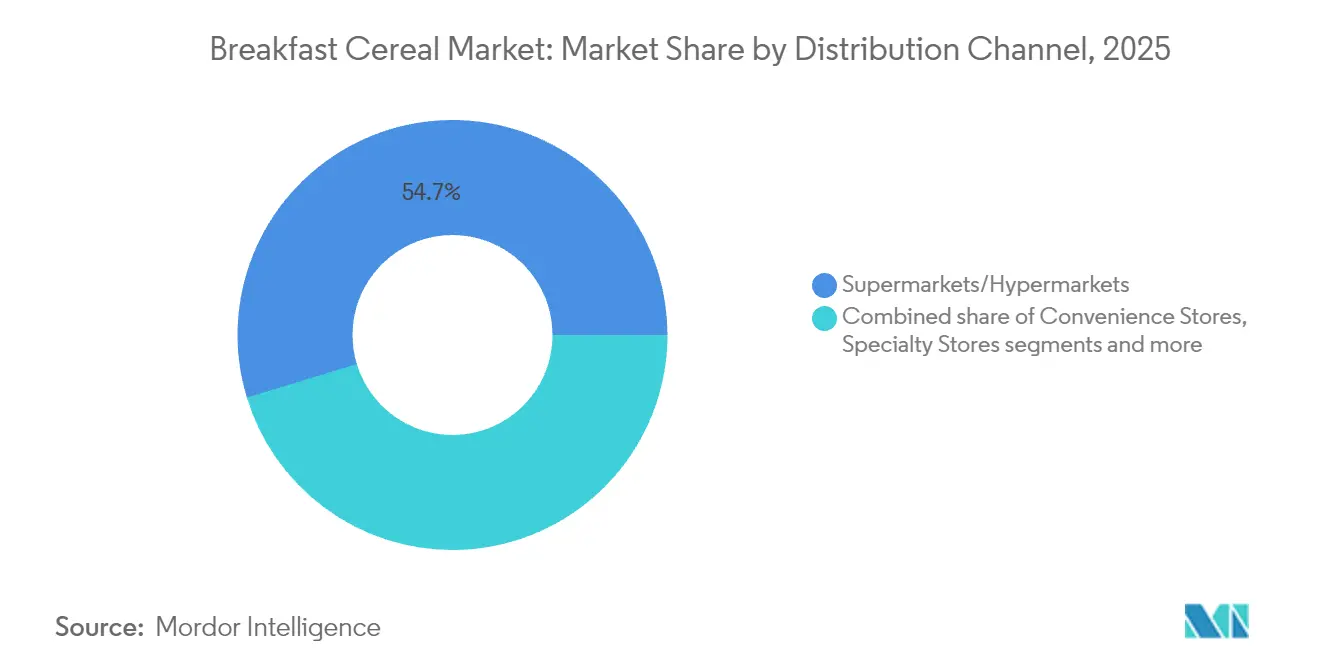
Supermarkets Lead While E-commerce SurgesSupermarkets/hypermarkets hold a dominant 54.70% market share in breakfast cereals distribution in 2025, driven by their extensive product assortment and high consumer footfall. The e-commerce channel is experiencing significant growth at 10.85% CAGR (2026-2031), as consumers increasingly purchase breakfast cereals online. According to the Census Bureau of the Department of Commerce, U.S. retail e-commerce sales reached USD 300.2 billion in Q1 2025, adjusted for seasonal variation but not price changes. The digital transition is particularly evident among younger consumers who prefer online platforms for their convenience and ability to compare products and access nutritional information.
Convenience stores and grocery outlets maintain a strong market presence, particularly for immediate consumption needs, while specialty stores cater to premium and health-conscious consumer segments. The other distribution channels, including direct-to-consumer and food service segments, represent an emerging segment as companies explore new distribution methods. This distribution landscape evolution requires manufacturers to develop integrated channel strategies that ensure brand consistency while adapting to specific channel requirements, affecting packaging, pricing, and promotional strategies in the breakfast cereals market.
By Age Group:
Adults Dominate While Children's Segment GrowsAdult-oriented cereals hold a 47.60% market share in 2025, reflecting demographic shifts and the category's expansion beyond its traditional children's focus. The children's segment maintains a higher growth trajectory at 5.07% CAGR (2026-2031), driven by manufacturers balancing nutritional value with taste appeal. This growth aligns with reformulation efforts to reduce sugar content while maintaining child-friendly flavors and formats. According to the USDA's 2024 School Breakfast Program report, 80% of weekly grains offered in school meal programs must be whole grain-rich .
The adult segment has developed distinct sub-categories focused on specific health benefits, including heart health, digestive wellness, and weight management. Manufacturers like General Mills are working to increase household penetration by targeting children who influence family purchasing decisions. This approach requires developing products that meet parents' nutritional requirements while satisfying children's taste preferences, presenting manufacturers with formulation and research challenges.
Geography Analysis
North America Breakfast Cereals Market
North America holds a 36.30% share of the global breakfast cereals market in 2025, supported by high per-capita consumption and extensive retail distribution networks. The region shows moderate growth as manufacturers develop value-added products to address volume challenges in mature segments. Health-oriented innovations, specifically protein-enriched varieties and reduced-sugar formulations, drive market expansion. The FDA's 2024 nutrition labeling requirements have enhanced transparency for added sugars, prompting manufacturers to adapt formulations to meet consumer preferences.
APAC Breakfast Cereals Market
Asia-Pacific demonstrates the highest growth potential with a projected CAGR of 6.10% (2026-2031), supported by urbanization, increasing disposable incomes, and evolving dietary habits. China, India, and Southeast Asian countries show robust growth as urban consumers adopt Western-style breakfast options. International manufacturers are customizing products for local tastes while promoting nutritional benefits, establishing foundations for sustained market expansion.
Europe Breakfast Cereals Market
Europe exhibits distinct regional consumption patterns and product preferences in a mature market environment. Consumers demonstrate high nutritional awareness, favoring organic, whole grain, and reduced-sugar products. The European Food Safety Authority's 2024 nutritional guidelines emphasize whole grain consumption and sugar reduction, affecting consumer choices and product formulations. Private label products maintain a significant market presence, with retailers developing competitive offerings across price segments. Eastern European markets present growth opportunities as rising disposable incomes support increased breakfast cereal consumption.
Regulatory Landscape
Breakfast cereals are regulated through a combination of international standards and country-level rules for labeling and claims, which in turn affect formulation, pack communication, and compliance for permitted additives. At the global level, Codex GSFA Online places breakfast cereals, including rolled oats, under food category 06.3, which many jurisdictions use as a reference point for permitted additive uses and documentation. In July 2026, the FAO/WHO Codex Alimentarius Commission (49th session) adopted new standards, including revisions to the General Standard for Food Additives (CXS 192-1995), and this can feed into reformulation and specification reviews for multinational cereal portfolios.
In practice, compliance pressure is most visible in nutrition labeling and claims governance. In the United States, FDA actions around nutrition labeling include the updated "Healthy" nutrient content claim (effective February 25, 2025, subject to FDA implementation timing) and a January 16, 2025 Federal Register proposed rule for front-of-package nutrition labeling using interpretive indicators (low/medium/high) tied to percent daily value for saturated fat, sodium, and added sugars. In Europe and the United Kingdom (Northern Ireland), claim usage is anchored to the EU permitted health claims framework, including Commission Implementing Regulation (EU) 2025/1560, while Northern Ireland transposed Breakfast Directives-related amendments through The Breakfast Foods (Amendment) Regulations (Northern Ireland) 2026, with a transitional compliance deadline no later than 14 June 2026.
Value Chain Analysis
The breakfast cereals value chain begins with agricultural inputs such as corn, wheat, oats, rice, and other emerging grains, then moves through cleaning, milling, blending, and thermal processing steps (including extrusion, flaking, toasting, and drying) that can be high-capital and throughput-sensitive. Manufacturers then apply fortification and inclusions (nuts, dried fruit, chocolate) and convert product into packaging formats such as boxes, pouches, and single-serve cups, before distribution through wholesale and retail channels where supermarkets and hypermarkets lead globally, alongside rising e-commerce importance for broader assortment and replenishment models.
Sourcing programs and supply chain investments increasingly influence cost-to-serve and resilience. WK Kellogg Co. announced a USD 500 million supply chain modernization plan with infrastructure investments across Battle Creek (Michigan), Lancaster (Pennsylvania), and Belleville (Ontario), and it also outlined a phased production shutdown of its Omaha (Nebraska) facility beginning in late 2025 and ending by end-2026, reflecting footprint optimization and equipment upgrading in mature cereal markets. Ingredient strategies are also evolving, including General Mills expanding commercial use of Kernza by incorporating it into four Cascadian Farm cereals (November 2025) to help build a stable market for U.S. organic farmers. Logistics efficiency remains a focus as well, evidenced by Weetabix extending its warehouse management partnership with XPO Logistics for its Burton Latimer and Corby facilities (May 2026).
Competitive Landscape
The global breakfast cereals market operates under a moderately consolidated structure, with five major corporations controlling the industry: General Mills, Post Holdings, Nestlé, PepsiCo, and Marico Ltd. These organizations maintain significant operational infrastructure and distribution networks, necessitating continuous optimization of manufacturing processes while demonstrating responsiveness to evolving consumer preferences and market demands across the breakfast cereals industry.
The competitive landscape is primarily defined by strategic initiatives centered on nutritional enhancement and format diversification. According to Nestlé's 2024 Annual Report, the corporation has implemented comprehensive nutritional improvement programs across its breakfast cereal portfolio, with its Indian subsidiary achieving a 30% reduction in added sugars within the infant cereals category. Additionally, specialized manufacturers operating in high-protein and grain-free segments are demonstrating substantial growth trajectories, despite their limited market presence, thereby compelling established manufacturers to accelerate their product development cycles within the breakfast cereals industry.
The competitive environment is experiencing increased complexity due to the substantial market penetration of private label offerings. This development has intensified the necessity for established manufacturers to emphasize product differentiation and implement strategic brand positioning initiatives. Such measures are essential for maintaining premium price points and ensuring sustained consumer loyalty in an increasingly competitive market environment shaping the breakfast cereals industry.
Breakfast Cereals Industry Leaders
-
General Mills Inc.
-
Post Holdings Inc.
-
Nestlé S.A.
-
PepsiCo Inc.
-
Marico Ltd.
- *Disclaimer: Major Players sorted in no particular order
Breakfast Cereals Market Companies Covered in this Report
- General Mills Inc.
- Post Holdings Inc.
- Nestlé S.A.
- PepsiCo Inc.
- Marico Ltd.
- Calbee Inc.
- Sanitarium Health & Wellbeing Company
- Nature’s Path Foods
- Tata Consumer Products Limited
- The Hain Celestial Group, Inc.
- Bob’s Red Mill Natural Foods
- Bagrrys India Limited
- Dr. Oetker GmbH
- Jordan’s & Ryvita Company
- Rude Health Foods Ltd.
- Three Wishes Cereal
- Familia AG
- Hero AG
- Purely Elizabeth
- Shantis Food
Market Opportunities and Future Outlook
Opportunities are shaped by three observable shifts: nutrition-led reformulation (protein, fiber, and reduced artificial additives), manufacturing and capacity upgrades, and sustainability-linked sourcing and packaging changes that are becoming more visible to shoppers and retailers. General Mills reported progress in its 2026 Global Responsibility Report (April 2026), including a 14% total value chain emissions reduction versus a 2020 baseline and 95% recyclable or reusable packaging by weight, which supports demand for cereals that pair performance nutrition with circular-packaging messaging. On the product side, protein fortification continues to be commercialized across large brands, supported by launches such as Cheerios Protein (General Mills, December 2024) and Honey Bunches of Oats Protein (Post Consumer Brands, January 2026), creating room for premiumization across both ready-to-eat and ready-to-cook formats.
Operational and route-to-market opportunities also track with announced investments and site upgrades. Kellanova announced a GBP 75 million investment in its Wrexham, UK facility to double capacity to 1.5 million boxes per day and integrate AI-driven production lines (October 2024), reflecting how high-efficiency plants can support wider SKU proliferation and faster innovation cycles. Alongside this, personalization and digital engagement are emerging as demand-shaping levers, with Calbee continuing the rollout of its Body Granola personalized nutrition platform in Japan, reaching 50,000 users since April 2023 (reported July 2026). These moves support opportunities for brands to pair single-serve and on-the-go packaging with data-enabled targeting, including subscriptions, tailored bundles, and localized assortments, as online retailers expand cereal discovery beyond shelf constraints.
Recent Industry Developments in Breakfast Cereals Market
- April 2026: Nestle launched Nesquik Strawberry cereal in the UK and Ireland, marking the first time the strawberry flavor has been offered as a cereal in the region since the brand's 1957 debut. The launch extends a legacy beverage brand into the cereal aisle and strengthens flavored and kid-friendly SKU rotation in a mature market where differentiation increasingly relies on recognizable IP and taste-led innovation.
- November 2025: General Mills introduced four Cascadian Farm cereals containing 1% Kernza, a perennial grain, as part of a program to support U.S. organic farmers and soil health initiatives. Incorporating Kernza into mainstream SKUs links regenerative-leaning sourcing to packaged cereal propositions and provides a template for scaling alternative grains without a full portfolio overhaul.
- December 2024: General Mills expanded its Cheerios portfolio with the launch of Cheerios Protein, offering 8 grams of protein per serving in Cinnamon and Strawberry variants. The launch underscores the category shift toward functional nutrition and gives incumbents a direct way to defend shelf space against high-protein granola and better-for-you entrants.
Breakfast Cereals Market Report Scope and Research Methodology
Market Definition and Coverage
This market covers packaged breakfast cereals sold through retail and foodservice channels, measured in value terms at the manufacturer selling price. It includes ready-to-eat cereals and ready-to-cook cereal products made from common grains like wheat, corn, oats, rice, and barley.
Scope exclusions: cereal bars, bakery mixes, and milk flavoring powders are excluded from this market sizing.
Segments Covered in This Report
- By Product Type
- Ready-to-Eat Cereals
- Flakes
- Puffed Cereals
- Granola and Clusters
- Others (Coated/Sugar-Frosted Cereals, Shredded and Threaded)
- Ready-to-Cook Cereals
- Hot Oatmeal
- Muesli and Porridge Mixes
- Other Ready-to-Cook Cereals
- Ready-to-Eat Cereals
- By Ingredient Source
- Wheat
- Corn
- Oats
- Rice
- Barley
- Others
- By Packaging Type
- Boxes
- Stand-Up Pouches
- Cups and Bowls
- Others (plastic jars, and bags, etc.)
- By Distribution Channel
- Supermarkets/Hypermarkets
- Convenience Stores
- Specialty Stores
- Online Retailers
- Other Distribution Channels
- By Age Group
- Adults
- Children
- By Geography
- North America
- United States
- Canada
- Mexico
- Rest of North America
- Europe
- Germany
- United Kingdom
- Italy
- France
- Spain
- Netherlands
- Poland
- Belgium
- Sweden
- Rest of Europe
- Asia-Pacific
- China
- India
- Japan
- Australia
- Indonesia
- South Korea
- Thailand
- Singapore
- Rest of Asia-Pacific
- South America
- Brazil
- Argentina
- Colombia
- Chile
- Peru
- Rest of South America
- Middle East and Africa
- South Africa
- Saudi Arabia
- United Arab Emirates
- Nigeria
- Egypt
- Morocco
- Turkey
- Rest of Middle East and Africa
- North America
Data Sources, Market Sizing, and Validation
Desk Research
Desk research begins by building a basic demand and supply picture using public reference sources, then mapping it to how cereals are manufactured and sold. For breakfast cereals, we relied on national agriculture and food statistics portals, customs and trade statistics, USDA-style food availability data, FAO data series, and peer reviewed nutrition and consumption studies that inform category trends.
We also reviewed company filings, annual reports, investor presentations, and brand press releases to track pricing moves, pack-size changes, and product mix shifts across ready-to-eat and hot cereals. Where available, a paid subscription for company financials and a news and financials database were used to cross-check revenue direction, M&A activity, and major capacity or distribution moves. These desk sources are illustrative only, and we used many other references for data collection, cross-checking, and clarification.
Primary Interviews and Surveys
Primary interviews were used to pressure-test what we built from desk research, especially around price realization, channel mix, and how promotions were affecting volumes. We spoke with a range of stakeholders, including cereal manufacturers, ingredient and packaging participants, distributors, retailers, and foodservice-aligned respondents across APAC, EMEA, and the Americas. When the assumptions did not match observed market behavior, we closed gaps by re-contacting experts.
Distribution of primary research fieldwork respondents
| Company type | Respondent position | Region |
|---|---|---|
| Top tier: 37% | CXOs: 15% | APAC: 39% |
| Mid tier: 47% | Functional/Unit leaders: 33% | EMEA: 35% |
| Smaller Players: 16% | Managers: 52% | Americas: 26% |
Market-Sizing & Forecasting
Sizing starts with a top-down model that reconstructs category consumption and sales signals by region, then converts them into value using observed price ladders and mix shifts. To keep results realistic, we corroborate with selective bottom-up checks, such as sampling supplier and brand revenue disclosures, reviewing channel splits, and validating a few volume versus average selling price combinations before final totals are locked.
Key model inputs include indicators such as urbanization and working population trends that affect convenience foods, household cereal penetration and repeat purchase patterns, grain and sugar price movements that influence shelf pricing, promotion intensity in modern retail, and the balance between ready-to-eat and ready-to-cook formats. Forecasts are built using scenario analysis, where raw material costs, private label expansion, and premiumization assumptions are adjusted in a controlled way, and the resulting demand and price paths are aligned to what primary respondents consider achievable. When bottom-up signals are limited for smaller countries or channels, we apply proxy ratios from comparable markets, then correct them through expert validation.
Data Validation & Update Cycle
Validation is done through multiple checks to keep the market total consistent with real-world signals. We compare modeled totals against independent indicators such as trade flows, packaged food category growth cues, and company reported performance. We then investigate outliers that break expected price or volume patterns.
Before sign-off, the model and assumptions go through staged review, and follow-up calls are triggered when the variance between sources stays high or when a major market event changes price or distribution conditions. Reports are refreshed annually, with interim updates when material events occur, and a final pre-delivery review is completed so clients receive the latest updated view.
Mordor Intelligence's Breakfast Cereals Market Size Versus Other Published Estimates
Published market sizes for breakfast cereals can vary because each publisher uses a different value point in the chain and does not always treat product scope the same way. Differences also show up when one study relies more on trade value proxies while another leans on consumer spend, which affects what is counted.
The main gap comes from whether retail margins and downstream costs are added on top of manufacturer selling price. In Mordor Intelligence's approach, the market is kept at manufacturer selling price for packaged cereals, instead of being inflated to a consumer checkout value that includes retailer margin and retail-level add-ons.
Benchmark comparison
| Source | Market Size | Gaps in Research Methodology |
|---|---|---|
| Mordor Intelligence | USD 46.44 B (2026) | |
| Global Consultancy A | USD 41.12 B (2024) | Uses a different base year and a narrower framing by product and channel that can compress value, and its growth window starts earlier which can miss recent price-led expansion in some regions. |
| Trade Journal B | USD 69.40 B (2024) | Builds value from producer and importer revenues tied to trade accounting, which can diverge from a packaged-cereal sell-in view by region and can shift totals depending on how import value and pricing cycles are treated. |
The table shows that the spread is largely explained by what is counted in the price basis, the year chosen for the snapshot, and how tightly the cereal scope is defined. By keeping inputs tied to clear demand signals and then checking them with sell-side and channel feedback, our estimate stays traceable and repeatable when the market moves.
Key Questions Answered in the Report
What is the current size of the breakfast cereals market?
The breakfast cereals market is valued at USD 46.44 billion in 2026 and is projected to reach USD 59.43 billion by 2031.
Which product type is growing fastest within the breakfast cereals market?
Ready-to-Cook hot cereals are growing at a 5.75% CAGR, surpassing the broader market trajectory.
Why are oat-based cereals gaining momentum?
Oats offer fiber and cholesterol benefits, driving a 6.25% CAGR and helping brands satisfy gluten-free and clean-label demand.
How is online retail affecting breakfast cereals sales?
Digital channels are expanding at an 10.85% CAGR, enabling subscription models and wider SKU discovery beyond shelf limits.