Market Overview
| Study Period | 2021 - 2031 |
|---|---|
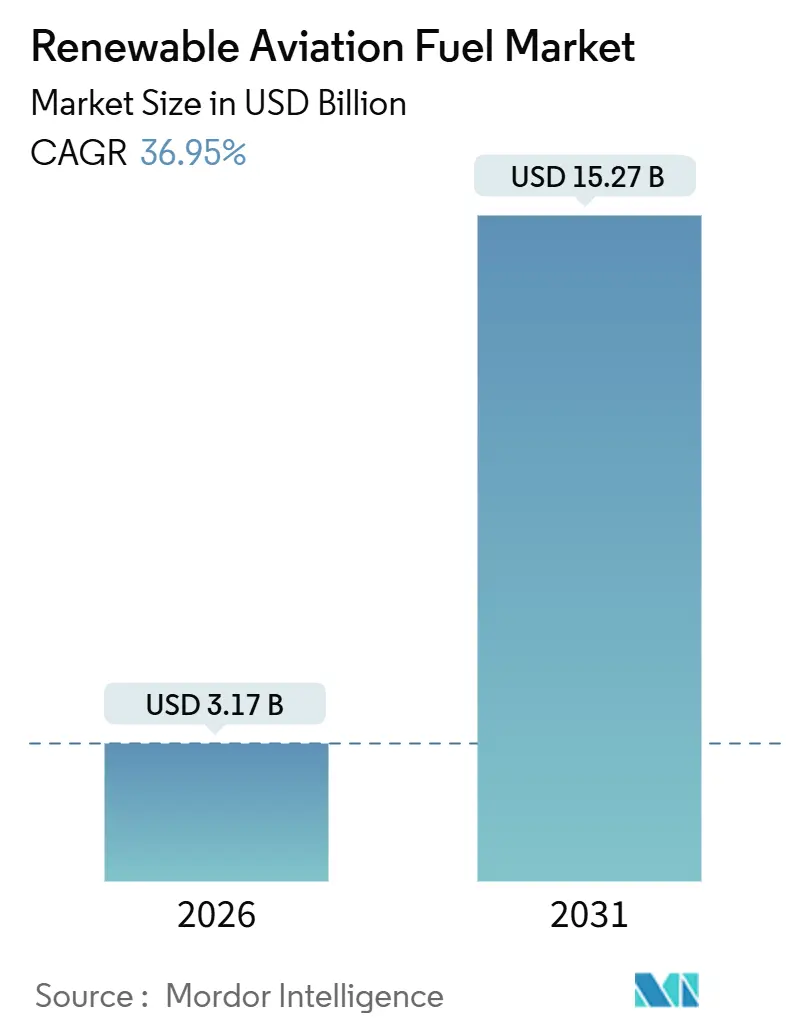
| Market Size (2026) | USD 3.17 Billion |
| Market Size (2031) | USD 15.27 Billion |
| Growth Rate (2026 - 2031) | 36.95% CAGR |
| Fastest Growing Market | Europe |
| Largest Market | North America |
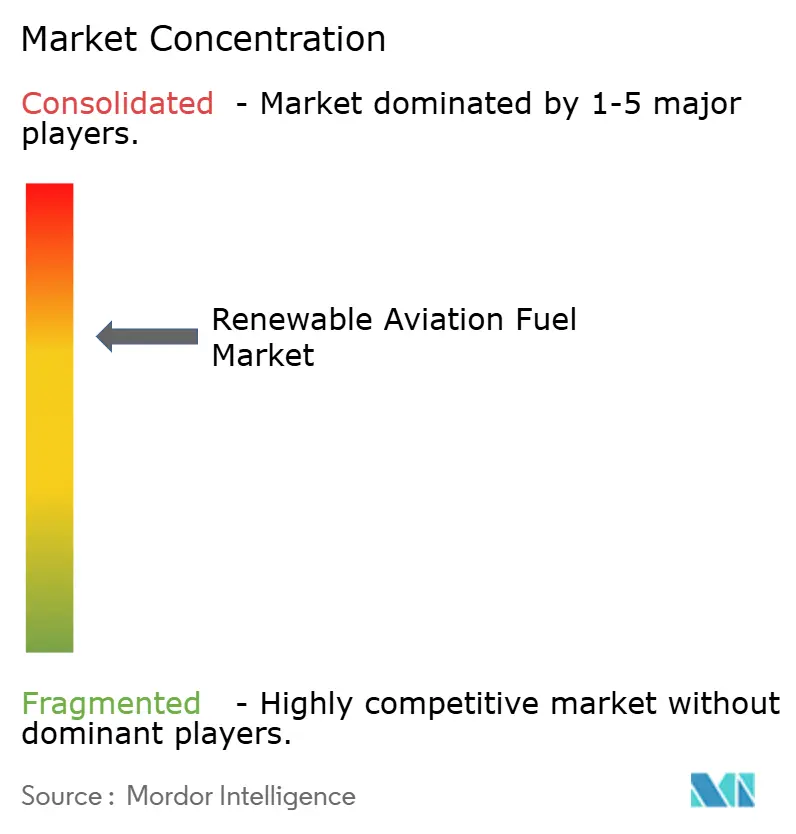
| Market Concentration | Medium |
Major Players *Disclaimer: Major Players sorted in no particular order Image © Mordor Intelligence. Reuse requires attribution under CC BY 4.0. | |
Renewable Aviation Fuel Market Analysis by Mordor Intelligence
The Renewable Aviation Fuel Market size is estimated at USD 3.17 billion in 2026, and is expected to reach USD 15.27 billion by 2031, at a CAGR of 36.95% during the forecast period (2026-2031).
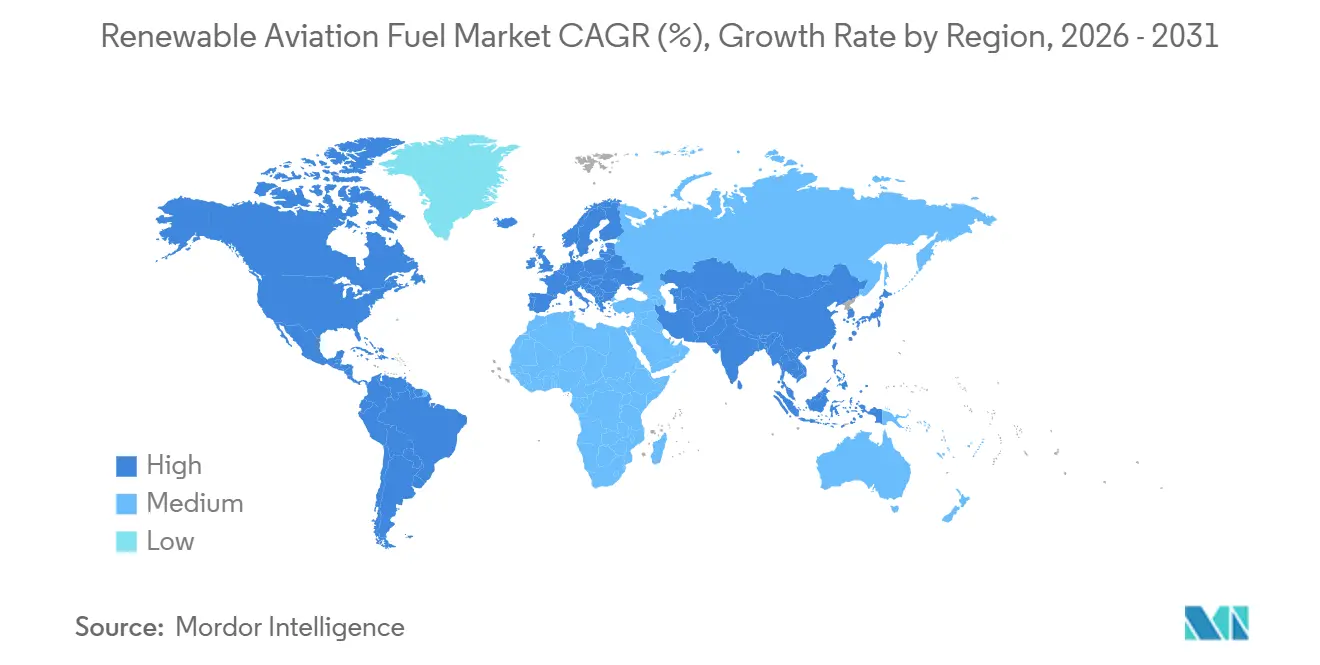
Stricter global mandates, escalating corporate net-zero pledges, and improving power-to-liquid economics are accelerating the renewable aviation fuel market transition away from voluntary initiatives toward compliance-driven growth. North America maintained leadership on the back of Section 45Z production credits, yet Europe’s ReFuelEU Aviation law is catalyzing faster capacity additions, while Asia-Pacific governments are rapidly introducing blend targets despite limited domestic supply. Technology advances, particularly in solid-oxide electrolysis and modular Fischer-Tropsch reactors, are narrowing the cost gap with Jet A-1, and airports in Amsterdam, Paris, Frankfurt, Los Angeles, and Singapore have invested in dedicated blending and storage systems that cut delivery costs. Competitive dynamics are shifting as integrated oil majors convert brownfield assets, new entrants commercialize alcohol-to-jet pathways, and airlines lock in multi-decade offtake agreements that underpin project finance.
Key Report Takeaways
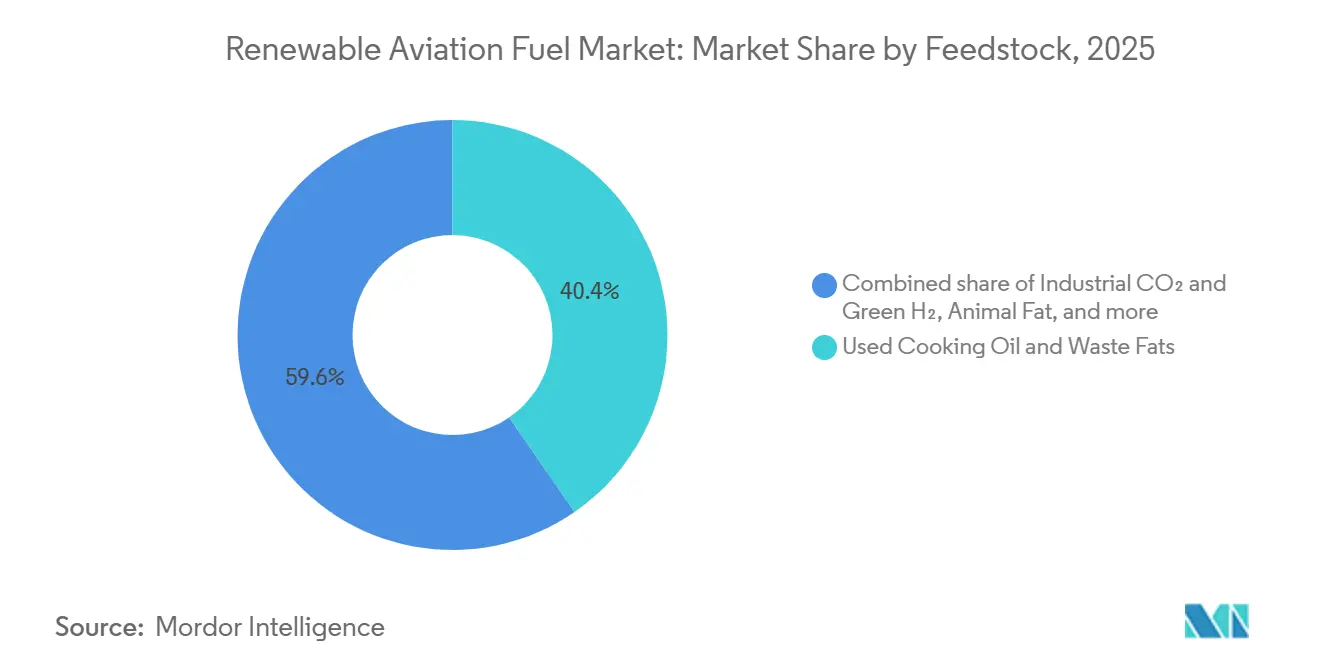
- By feedstock, used cooking oil and waste fats led with 40.4% share of the renewable aviation fuel market size in 2025; industrial CO₂ and green hydrogen are forecasted to expand at 59.5% CAGR from 2026 to 2031.
- By technology, hydroprocessed esters and fatty acids (HEFA) dominated with 69.9% share of the renewable aviation fuel market size in 2025, whereas power-to-liquid/e-SAF is estimated to grow at 55.8% CAGR to 2031.
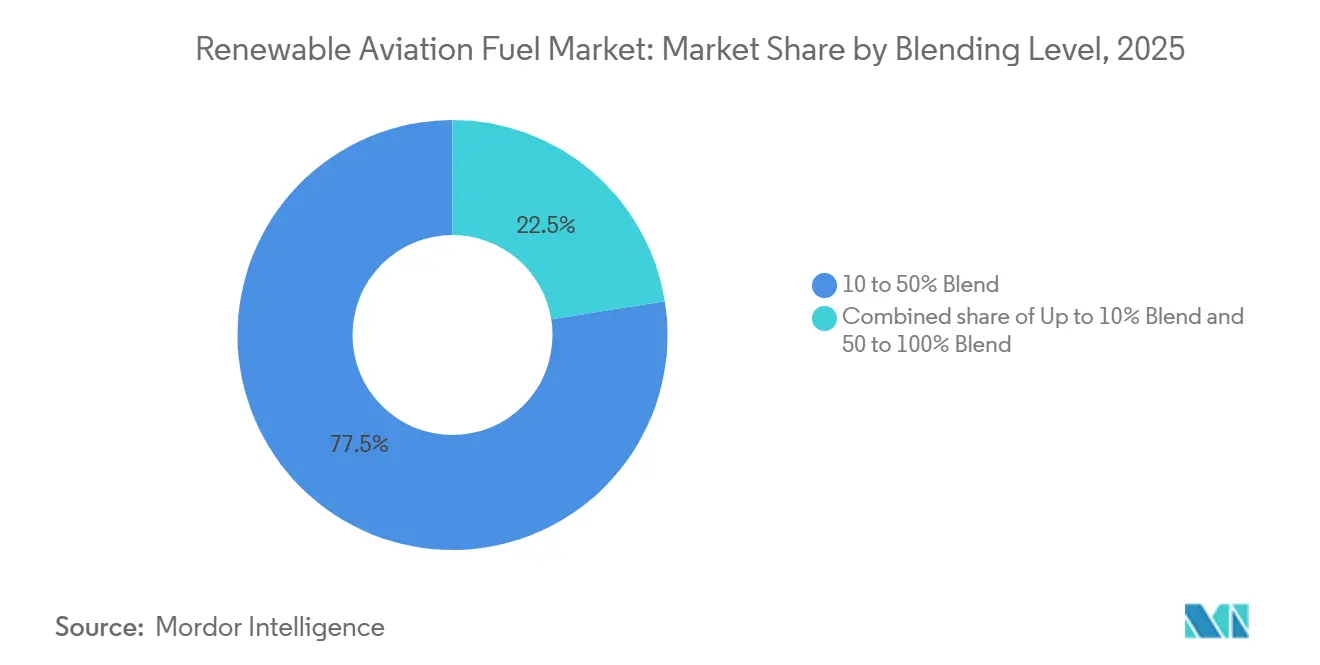
- By blending level, the 10-50% segment held 77.5% share of the renewable aviation fuel market size in 2025; the 50-100% segment is anticipated to climb at 52.6% CAGR through 2031.
- By application, commercial airlines captured 80.1% share of the renewable aviation fuel market size in 2025, and the segment is poised for a 39.2% CAGR over the forecast period.
- By geography, North America accounted for a 42.6% renewable aviation fuel market share in 2025, while Europe is projected to record a 43.0% CAGR through 2031.
Note: Market size and forecast figures in this report are generated using Mordor Intelligence’s proprietary estimation framework, updated with the latest available data and insights as of January 2026.
Global Renewable Aviation Fuel Market Trends and Insights
Drivers Impact Analysis
| Driver | (~) % Impact on CAGR Forecast | Geographic Relevance | Impact Timeline |
|---|---|---|---|
| Increased government regulations for GHG emissions | 12.30% | Global, led by EU & North America | Medium term (2-4 years) |
| Airline net-zero emission commitments | 8.70% | Global, concentrated in EU & North America | Medium term (2-4 years) |
| Corporate travel decarbonization pressure | 4.10% | North America & Europe, rising in Asia-Pacific | Short term (≤ 2 years) |
| Electro-fuels technology breakthroughs | 6.90% | Europe & Middle East | Long term (≥ 4 years) |
| Regional airport SAF-infrastructure funding | 5.50% | Europe, North America, Singapore | Medium term (2-4 years) |
| Source: Mordor Intelligence | |||
Increased Government Regulations for GHG Emissions
Binding mandates are replacing voluntary frameworks as the principal demand catalyst. The EU’s ReFuelEU Aviation regulation compels a 2% SAF blend in 2025, 6% by 2030, and 70% by 2050, with penalties of EUR 95 per tonne of CO₂-equivalent for non-compliance.[1]European Commission, “Questions and Answers: ReFuelEU Aviation Initiative,” europa.eu The same law carves out a synthetic fuel sub-target of 1.2% by 2030 and 35% by 2050, steering investment toward power-to-liquid pathways. CORSIA’s first compliance phase began in 2024, and because each liter of SAF yields 3.5 times more eligible credits than carbon offsets, airlines favor direct blending.[2]International Civil Aviation Organization, “CORSIA,” icao.int Japan’s 10% mandate for 2030 and India’s phased 1-2% mandates deepen regulatory momentum in Asia, underscoring that statutory blend floors, not feedstock availability, dictate regional uptake.
Airline Net-Zero Emission Commitments
Carrier-level pledges translate into sizable, long-term contracts that de-risk capital. United Airlines agreed to purchase 1.5 billion gallons of SAF over 20 years, including 900 million gallons from Neste. Air France-KLM inked a 10-year deal for 800,000 tonnes with TotalEnergies, anchoring revenue for the Grandpuits biorefinery. Emirates earmarked USD 200 million annually for SAF procurement, signaling willingness to import from Europe and Asia. These offtakes lock in volume at USD 1.50-2.50 per gallon premiums over spot Jet A-1, satisfying project-finance lenders’ revenue-certainty tests.
Corporate Travel Decarbonization Pressure
Large enterprises are embedding SAF clauses in travel contracts, creating a parallel demand stream. Microsoft, Google, and Meta pledged to buy 150 million gallons of SAF credits through the Sustainable Aviation Buyers Alliance, shifting cost burdens from airlines to end users. Business-aviation operators NetJets and Flexjet introduced SAF-inclusive memberships in 2025 that cost 15-20% more yet achieved 30% uptake among Fortune 500 clients. The EU Corporate Sustainability Reporting Directive compels Scope 3 disclosure, nudging corporations to favor verifiable SAF over offsets.[3]European Commission, “Questions and Answers: ReFuelEU Aviation Initiative,” europa.eu
Electro-Fuels (PtL) Technology Breakthroughs
Capital costs are falling as electrolysis and reactor designs mature. Germany’s DLR produced jet fuel at EUR 3.50 per liter using power at EUR 0.05 per kWh in 2024, a 40% cost drop from 2022 pilots. OXCCU raised GBP 70 million in 2025 to commercialize direct CO₂-to-jet conversion, targeting sub-USD 3.00 per gallon by 2028. Topsoe and Sasol’s joint venture aims for 100,000 tonnes of e-SAF annually by 2030 via solid-oxide electrolyzers. Masdar committed USD 1 billion to a 200,000 tonne plant in Abu Dhabi, leveraging abundant solar power and direct air capture.
Restraints Impact Analysis
| Restraint | (~) % Impact on CAGR Forecast | Geographic Relevance | Impact Timeline |
|---|---|---|---|
| High production cost vs. conventional jet fuel | -8.40% | Global, acute in Asia-Pacific & South America | Medium term (2-4 years) |
| Feedstock supply competition & constraints | -6.20% | Europe, North America, Asia-Pacific | Short term (≤ 2 years) |
| Volatility in policy-driven credits | -3.70% | North America & Europe | Short term (≤ 2 years) |
| Certification & safety-approval delays | -2.10% | Global | Long term (≥ 4 years) |
| Source: Mordor Intelligence | |||
High Production Cost vs. Conventional Jet Fuel
SAF prices remained 2-5 times higher than Jet A-1 in 2025. HEFA costs USD 3-6 per gallon to produce versus USD 2-3 for petroleum jet, while e-fuels often exceeded USD 8 per gallon before subsidies. The U.S. Section 45Z credit of USD 1.75 per gallon narrows the gap but expires in 2027, clouding long-term economics. Capital intensity amplifies risk; PtL plants require about USD 1 billion for 100,000 tonnes of annual capacity.
Feedstock Supply Competition & Constraints
Global UCO supply totaled 10 billion liters in 2024 against 15 billion liters demand, lifting prices to USD 1,200 per tonne in 2025. Europe imported more than 60% of its UCO from China, exposing producers to fraud investigations that revealed up to 20% mis-certification. Animal fat markets tightened as renewable diesel projects absorbed supply, raising tallow prices 35% between 2024 and 2025.
Segment Analysis
By Feedstock: Waste Oils Dominate, Synthetic Pathways Accelerate
Used cooking oil and waste fats accounted for 40.4% of the renewable aviation fuel market share in 2025, reflecting HEFA maturity and entrenched collection networks. Industrial CO₂ paired with green hydrogen is forecast to grow at a 59.5% CAGR through 2031, the fastest among all feedstocks, as ReFuelEU’s synthetic sub-mandate underwrites offtake.[4]DLR German Aerospace Center, “Power-to-Liquid,” dlr.de Animal fats remain volume-constrained, while lignocellulosic biomass trails due to capital-intensive gasification-FT processes that only Fulcrum BioEnergy has scaled commercially.
Demand for lipid feedstocks is tightening rapidly. Global UCO imports surged, prompting the European Commission to audit certification chains and consider stricter traceability standards. Vegetable oils face sustainability scrutiny; the EU excluded palm oil-derived HEFA in 2024, redirecting procurement toward lower-yield soybean and rapeseed oils. As lipid ceilings loom, synthetic e-SAF emerges as the only route capable of delivering the 35% blend requirement embedded in EU law by 2050.
Note: Segment shares of all individual segments available upon report purchase
Get Detailed Market Forecasts at the Most Granular Levels
Download PDF
By Technology: HEFA Incumbency Faces PtL Disruption
HEFA dominated with 69.9% of the renewable aviation fuel market size in 2025, driven by Neste’s 1.9 million tonne Singapore facility and TotalEnergies’ Grandpuits conversion.[5]Neste Corporation, “Singapore Expansion,” neste.com Yet lipid reliance caps future output at roughly 10 million tonnes annually. PtL/e-SAF is projected to surge at 55.8% CAGR, aided by falling electrolyzer costs and growing availability of ultralow-cost solar in the Middle East. ATJ and FT-SPK play transitional roles: LanzaJet’s Freedom Pines plant reached 10 million gallons in 2025, while Velocys finally obtained ASTM approval for its municipal solid-waste route, unlocking Bayou Fuels construction.
HEFA’s brownfield advantage remains strong in the near term; co-processing at petroleum refineries slashes capex by up to 50% relative to greenfield builds. Nevertheless, investors are gravitating toward PtL projects with 15-year offtake agreements as policy certainty improves. Technology licensing has become a strategic choke-point: Honeywell UOP’s Ecofining process underpins more than 70% of global HEFA capacity and generated USD 200 million in license fees in 2024.
By Blending Level: Mid-Range Blends Dominate, Neat SAF Gains Momentum
The 10-50% blend category captured 77.5% of market demand in 2025 because it requires no aircraft or engine modifications. Airlines are now shifting upward as mandates tighten; the 50-100% segment is expected to grow at 52.6% CAGR during 2026-2031. Airbus and Boeing have certified all new deliveries for 100% SAF since 2025. Emirates and Virgin Atlantic completed demonstration flights using neat SAF, proving operational feasibility.
Airlines favor higher blends because a 10% mix yields only an 8% lifecycle CO₂ cut, far short of net-zero pathways. Regulatory floors are climbing: ReFuelEU effectively requires blends greater than 10% by 2030, while Singapore’s levy finances supply-side subsidies aimed at 3-5% blends by 2030. As engine approvals broaden, airlines will transition toward 50-100% operations, provided cost incentives persist.
Note: Segment shares of all individual segments available upon report purchase
Get Detailed Market Forecasts at the Most Granular Levels
Download PDF
By Application: Commercial Aviation Dominates, Defense Emerges
Commercial airlines represented 80.1% of the renewable aviation fuel market size in 2025 and are projected to expand at a 39.2% CAGR. United Airlines, Air France-KLM, Southwest, and Ryanair have layered offtake commitments totaling more than 3 billion gallons, locking in demand visibility. Defense adoption is rising; the U.S. Air Force allocated USD 500 million in 2024-2025 SAF contracts targeting a 50% share of fuel by 2030. Business aviation plays a high-margin role, with NetJets’ SAF tier achieving 30% penetration among large corporate accounts. Cargo carriers such as FedEx plan 30% blends by 2030 to satisfy shipper decarbonization requirements.
Governments increasingly view SAF procurement as an energy-security strategy. Military incorporation of e-SAF in logistics reduces exposure to petroleum supply shocks, while corporate flight departments demand book-and-claim certificates to meet Scope 3 goals. These dynamics diversify the customer base and spread price premiums across multiple payer categories.
Geography Analysis
Europe is expected to record a 43.0% CAGR through 2031, surpassing North America despite North America’s 42.6% renewable aviation fuel market share in 2025. The EU blended 193,000 tonnes of SAF in 2024, just 0.6% of jet fuel consumption, yet announced projects would lift capacity to 3.2 million tonnes by 2030, mainly in the Netherlands, France, and Germany. Airport infrastructure programs in Amsterdam, Paris, and Frankfurt reduce logistics costs and anchor supply.
North America benefits from established HEFA capacity at World Energy’s Paramount refinery and generous production credits under the Inflation Reduction Act. Section 45Z offers up to USD 1.75 per gallon but faces renewal risk after 2027, causing some developers to delay investment decisions. Canada introduced a USD 1.1 billion subsidy scheme targeting 10% domestic production by 2030, but feedstock competition from renewable diesel limits immediate growth.
Asia-Pacific is awakening. Singapore’s 1% mandate launches in 2026, Japan targets 10% by 2030, and India phases in 1-2% requirements by 2028. China aims for 50,000 tonnes of output by 2025, but fell short at 30,000 tonnes due to feedstock scarcity. Australia committed USD 720 million to SAF funding in 2025, targeting 10% blend by 2030. The Middle East positions itself as a PtL hub; Masdar’s 200,000 tonne Abu Dhabi facility will leverage low-cost solar, and the UAE’s Emirates has signed a 15-year offtake agreement.
Get Analysis on Important Geographic Markets
Download PDF
Competitive Landscape
The renewable aviation fuel market is moderately concentrated: the five largest producers, Neste, TotalEnergies, Shell, World Energy, and BP, controlled roughly 60% of global capacity in 2025. Neste approved a 500,000 tonne expansion at Rotterdam in 2026, which will become the world’s largest single-site SAF plant. TotalEnergies extended its offtake deal with Air France-KLM through 2035, securing downstream demand. Shell purchased a 25% stake in LanzaJet and signed a 20-year contract for Fulcrum BioEnergy output, cementing access to ATJ and waste-to-jet technologies.
Disruptors such as Gevo and LanzaJet focus on alcohol-to-jet pathways that alleviate lipid constraints but face capital hurdles; Gevo’s Net-Zero 1 restarted construction only after securing USD 350 million in debt in September 2025. Technology licensors wield growing influence; Honeywell UOP’s Ecofining process dominates HEFA, while Johnson Matthey, Topsoe, and Emerging Fuels Technology compete in PtL catalysts. Smaller players, including Aemetis, Red Rock Biofuels, and Swedish Biofuels, target feedstock niches yet grapple with financing delays, foreshadowing consolidation pressure as mandates tighten and capital gravitates toward scale.
The landscape is evolving toward vertical integration: oil majors retrofit refineries, airlines secure supply equity, and airports finance infrastructure, blurring traditional value-chain boundaries. Producers able to combine feedstock security, technology optionality, and long-dated offtakes will command pricing power as global blend floors rise.
Renewable Aviation Fuel Industry Leaders
TotalEnergies SE
Neste Oyj
World Energy LLC
Shell plc
BP plc
- *Disclaimer: Major Players sorted in no particular order
Need More Details on Market Players and Competitors?
Download PDF
Recent Industry Developments
- November 2025: LanzaJet secured a USD 200 million project finance to build a 100 million gallon ATJ facility in the United Kingdom, targeting a 2028 start-up.
- November 2025: Masdar and ADNOC formed a joint venture to develop a 200,000 tonne e-SAF plant in Abu Dhabi, with Emirates taking a 15-year offtake.
- October 2025: Gevo completed a USD 350 million debt package to resume construction of its Net-Zero 1 ATJ plant in South Dakota, targeting late 2027 operations.
- October 2025: United Airlines expanded its Neste contract by 500 million gallons, extending supply through 2040.
Global Renewable Aviation Fuel Market Report Scope
Renewable aviation fuel (RAF), often considered sustainable aviation fuel (SAF), is a clean substitute for fossil jet fuels. SAF is produced from sustainable resources, such as waste oils from a biological origin, agriculture residues, or non-fossil CO2. The Renewable Aviation Fuel market report includes:
By Feedstock
| Used Cooking Oil and Waste Fats |
| Animal Fat |
| Vegetable Oils |
| Lignocellulosic Biomass |
| Industrial CO₂ and Green H₂ |
By Technology
| Hydroprocessed Esters and Fatty Acids (HEFA) |
| Fischer-Tropsch SPK (FT-SPK) |
| Alcohol-to-Jet (ATJ) |
| Synthesised Iso-Paraffinic (SIP) |
| Catalytic Hydro-thermolysis Jet (CHJ) |
| Power-to-Liquid/e-SAF |
By Blending Level
| Up to 10% Blend |
| 10 to 50% Blend |
| 50 to 100% Blend |
By Application
| Commercial Airlines |
| Defense/Military Aviation |
| General and Business Aviation |
By Geography
| North America | United States |
| Canada | |
| Mexico | |
| Europe | United Kingdom |
| Germany | |
| France | |
| Italy | |
| Spain | |
| NORDIC Countries | |
| Russia | |
| Rest of Europe | |
| Asia-Pacific | China |
| India | |
| Japan | |
| South Korea | |
| ASEAN Countries | |
| Australia and New Zealand | |
| Rest of Asia-Pacific | |
| South America | Brazil |
| Argentina | |
| Chile | |
| Rest of South America | |
| Middle East and Africa | Saudi Arabia |
| United Arab Emirates | |
| South Africa | |
| Kenya | |
| Rest of Middle East and Africa |
| By Feedstock | Used Cooking Oil and Waste Fats | |
| Animal Fat | ||
| Vegetable Oils | ||
| Lignocellulosic Biomass | ||
| Industrial CO₂ and Green H₂ | ||
| By Technology | Hydroprocessed Esters and Fatty Acids (HEFA) | |
| Fischer-Tropsch SPK (FT-SPK) | ||
| Alcohol-to-Jet (ATJ) | ||
| Synthesised Iso-Paraffinic (SIP) | ||
| Catalytic Hydro-thermolysis Jet (CHJ) | ||
| Power-to-Liquid/e-SAF | ||
| By Blending Level | Up to 10% Blend | |
| 10 to 50% Blend | ||
| 50 to 100% Blend | ||
| By Application | Commercial Airlines | |
| Defense/Military Aviation | ||
| General and Business Aviation | ||
| By Geography | North America | United States |
| Canada | ||
| Mexico | ||
| Europe | United Kingdom | |
| Germany | ||
| France | ||
| Italy | ||
| Spain | ||
| NORDIC Countries | ||
| Russia | ||
| Rest of Europe | ||
| Asia-Pacific | China | |
| India | ||
| Japan | ||
| South Korea | ||
| ASEAN Countries | ||
| Australia and New Zealand | ||
| Rest of Asia-Pacific | ||
| South America | Brazil | |
| Argentina | ||
| Chile | ||
| Rest of South America | ||
| Middle East and Africa | Saudi Arabia | |
| United Arab Emirates | ||
| South Africa | ||
| Kenya | ||
| Rest of Middle East and Africa | ||
Need A Different Region or Segment?
Customize Now
Key Questions Answered in the Report
How large is the renewable aviation fuel market in 2026?
The renewable aviation fuel market size is estimated at about USD 3.17 billion in 2026, on a growth path toward USD 15.27 billion by 2031.
Which region will grow fastest through 2031?
Europe is projected to post the highest CAGR at 43.0% thanks to the ReFuelEU Aviation mandate and extensive airport infrastructure investments.
What feedstock will see the highest growth?
Industrial CO2 combined with green hydrogen, the basis for power-to-liquid fuels, is forecast to expand at nearly 60% CAGR during 2026-2031.
Why are airlines signing long-term offtake contracts?
Multi-decade offtake agreements provide revenue certainty for producers and help airlines meet net-zero commitments without spot-market price risk.
What is the main cost barrier for SAF?
Production costs remain 2-5 times higher than conventional Jet A-1, although credits such as the U.S. Section 45Z can narrow the gap significantly.
When could 100% SAF become commonplace in commercial flights?
Engine and aircraft certifications completed since 2025 suggest widespread 100% SAF operations could emerge before 2030 as supply scales.


