Market Overview
| Study Period | 2020 - 2031 |
|---|---|
| Forecast Data Period | 2026 - 2031 |
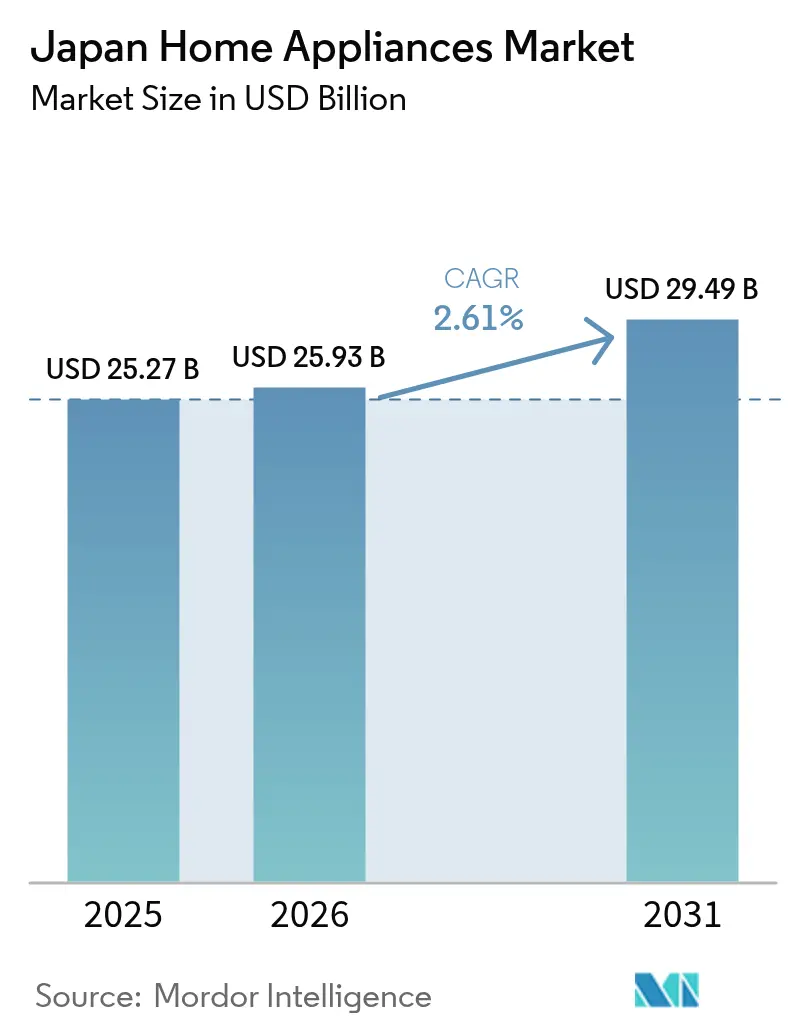
| Base Year Market Size (2025) | USD 25.27 Billion |
| Market Size (2026) | USD 25.93 Billion |
| Market Size (2031) | USD 29.49 Billion |
| Growth Rate (2026 - 2031) | 2.61% CAGR |
| Market Concentration | Medium |
Major Players *Disclaimer: Major Players sorted in no particular order Image © Mordor Intelligence. Reuse requires attribution under CC BY 4.0. | |
Japan Home Appliances Market Analysis by Mordor Intelligence
The Japan home appliances market size is expected to grow from USD 25.27 billion in 2025 to USD 25.93 billion in 2026 and is forecast to reach USD 29.49 billion by 2031 at a 2.61% CAGR over 2026-2031. Efficiency mandates under the Top Runner framework and the 2025 build-to-code shift for new residences continue to compress replacement windows in refrigerators, washing machines, and room air conditioners. Adoption of smart-home platforms that unify control and maintenance data increases premium uptake and supports cross-device orchestration in urban apartments. Record heat in 2025 elevated cooling demand and highlighted the need for inverter and demand-response capabilities to manage grid peaks. Yen swings continue to move component import costs and complicate pricing decisions for appliance OEMs with higher offshore exposure[1]Bank of Japan Policy Board, “Outlook for Economic Activity and Prices, January 2026,” Bank of Japan, boj.or.jp.
Key Report Takeaways
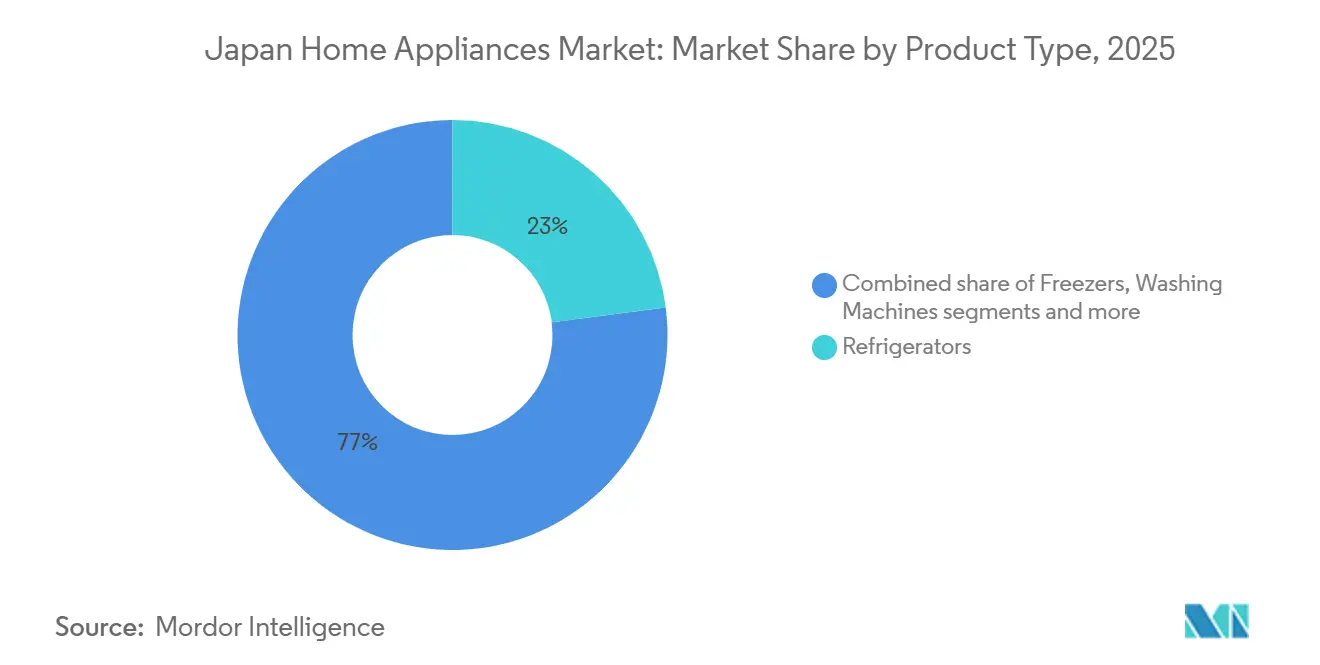
- By product category, refrigerators led with 22.96% of the Japan home appliances market share in 2025, while coffee makers are projected to expand at a 3.42% CAGR through 2031.
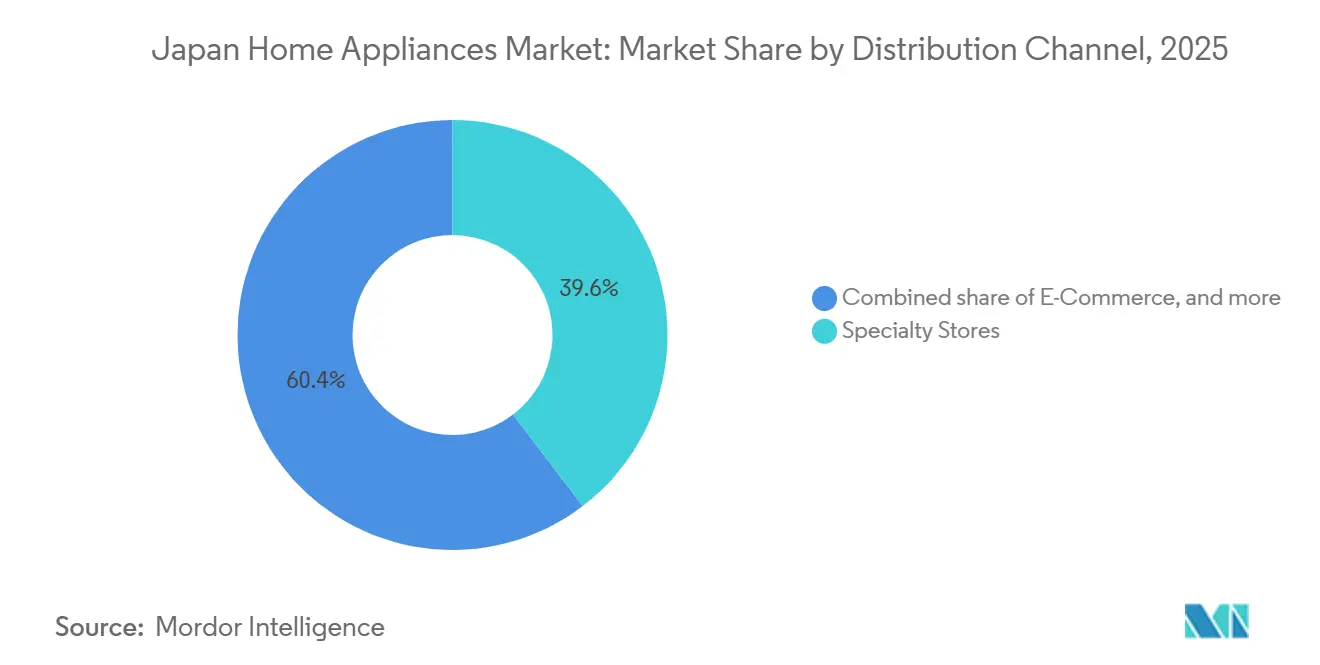
- By distribution channel, specialty stores held 39.64% of the Japan home appliances market share in 2025, while online retail is projected to grow at a 4.13% CAGR through 2031.
- By geography, Kanto led with 40.34% of the Japan home appliances market share in 2025, whereas Hokkaido is forecast to expand at a 3.68% CAGR through 2031
Note: Market size and forecast figures in this report are generated using Mordor Intelligence’s proprietary estimation framework, updated with the latest available data and insights as of 2026.
Japan Home Appliances Market Trends and Insights
Drivers Impact Analysis*
| Driver | (~) % Impact on CAGR Forecast | Geographic Relevance | Impact Timeline |
|---|---|---|---|
| Efficiency Standards And Building Codes Accelerate Replacement Cycles | +0.8% | National, strongest enforcement in Kanto, Kansai urban cores | Medium term (2-4 years) |
| Smart home integration and IoT-enabled appliances lifting premium adoption and ASPs | +0.7% | Urban centers Tokyo, Osaka, Yokohama, spilling into secondary cities | Long term (≥ 4 years) |
| Room Air Conditioners Surge as Climate Extremes Outpace Historical Norms | +0.6% | National, with acute demand spikes in western Japan, Kyushu, Chugoku, and Kanto during heat waves | Short term (≤ 2 years) |
| Regulatory Compliance Catalyzes Turnover Through Recycling and Energy Mandates | +0.5% | National regulatory mandate, accelerated adoption in newly constructed ZEH or ZEB buildings | Medium term (2-4 years) |
| Recycling law reinforces formal replacement flows | +0.3% | National program administered by municipalities, with higher compliance in urban prefectures | Long term (≥ 4 years) |
| Aging population driving demand for user-friendly, compact and assistive home appliances | +0.4% | Tohoku, Hokkaido, rural prefectures with elderly ratios above 35%, extending to suburban Kanto | Long term (≥ 4 years) |
| Source: Mordor Intelligence | |||
Efficiency Standards And Building Codes Accelerate Replacement Cycles
Japan's Top Runner energy-efficiency scheme compels manufacturers to meet weighted-average targets that tighten on a fixed cycle, raising the performance bar for refrigerators, air conditioners, and washing machines, and directing consumers toward newer inverter-driven models. From April 2025, compliance with energy conservation standards became mandatory for all new residential buildings, previously voluntary; this policy accelerates equipment turnover because renovators must install appliances that satisfy the raised Building Energy Index (BEI) benchmarks. Updated third-phase transformer standards, effective April 2026, improve efficiency by 15% versus second-phase criteria, nudging industrial and commercial users toward high-performance units that integrate with building-management systems[2]Borderless Business Law Office, “2026: A Historic Turning Point in Japan's Energy Policy – A Comprehensive Guide to Seven Major System Changes Affecting Businesses,” Borderless, borderless. law. This framework shortens practical lifecycles by rendering older stock less attractive based on the total cost of ownership, thereby sustaining unit demand despite flat household formation.
Smart Home Integration Lifts Premium Segment and Average Selling Prices
Connected ecosystems that link refrigerators, washers, and air conditioners enable predictive maintenance, over-the-air features, and energy scheduling that reduces monthly electricity expenses for urban households. Matter-certified interoperability reduces friction by enabling cross-brand control through a single interface, thereby supporting a higher willingness to pay for IoT-enabled variants in the Japan home appliances market. Smart-home penetration reached a sizable base by 2025, and developers in affluent Tokyo wards have begun preinstalling connected devices in new apartments to signal convenience and value. Subscription software augments hardware margins as OEMs monetize cooking guidance, energy dashboards, and remote diagnostics, as seen in Panasonic’s ecosystem approach to connected kitchen devices. As platforms standardize and cloud orchestration improves, average selling prices in premium tiers remain resilient, particularly in dense urban markets where automation and space optimization matter. In affluent Tokyo wards, 40% of new apartment sales feature pre-installed smart appliances as standard amenities, signaling developer confidence that connected ecosystems enhance property values[3]Mitsubishi UFJ Research and Consulting Co., Ltd, “The Japanese Economy in Fiscal 2024 and Fiscal 2025,” Mitsubishi UFJ Research and Consulting Co., Ltd, murc.jp.
Room Air Conditioners Surge as Climate Extremes Outpace Historical Norms
Summer 2025 was recorded as Japan’s hottest season, with average temperatures in June through August well above the multi-decade baseline, and this pattern brought longer heat waves that forced extended air-conditioner runtimes in large metros. Utilities observed higher afternoon peaks, reinforcing the need for demand-response integration in room ACs and heat pumps to stagger loads during critical hours. Revised energy-saving labels and tighter performance targets through fiscal 2027 and 2029 strengthen the shift toward inverter-driven systems with better seasonal efficiency in the Japan home appliances market. Manufacturers have added connectivity features so that utilities and homeowners can automate temperature set points, pre-cool during off-peak tariffs, and coordinate with home energy systems, helping manage the grid while users maintain comfort[4]Daikin Investor Relations Team, “Integrated Report 2025,” Daikin, daikin.com . These climate and policy dynamics sustain replacement-led growth in room AC shipments even as household penetration is mature.
Regulatory Compliance Catalyzes Turnover Through Recycling and Energy Mandates
The Home Appliance Recycling Act requires formal collection and recycling for key appliance categories, which channels discarded units into compliant networks and supports responsible end-of-life handling for refrigerants and materials. OEMs are adding circularity to product design and operations, as shown by Daikin’s investments in refrigerant recovery and service models that reduce leakage and reuse recovered gases. National and municipal programs also boost efficient equipment in new and renovated buildings, which aligns appliance upgrades with broader decarbonization objectives and accelerates replacement in old housing stock. Recycling quotas and material recovery advances, supported by emerging separation technologies from established OEMs, create feedstock for higher-quality reuse while reducing landfill dependence. The combined regulatory stack lifts unit turnover in the Japan home appliances market and narrows the performance gap between mid-range and premium tiers by making high-efficiency features more common.
Restraints Impact Analysis*
| Restraint | (~) % Impact on CAGR Forecast | Geographic Relevance | Impact Timeline |
|---|---|---|---|
| Housing Market Contraction Constrains New-Unit Demand | -0.5% | National, sharper in rural prefectures with population outflows, Tohoku, Shikoku | Long term (≥ 4 years) |
| Mature penetration and long lifecycles damp volumes | -0.3% | National, pronounced in categories exceeding 90% penetration, refrigerators, washing machines | Long term (≥ 4 years) |
| Margin pressure from retail price transparency | -0.4% | Urban e-commerce hubs, Tokyo, Osaka, specialty chain pricing wars | Medium term (2-4 years) |
| Yen Depreciation Amplifies Input-Cost Volatility | -0.6% | National, with acute impacts on brands sourcing components from China and Southeast Asia | Short term (≤ 2 years) |
| Source: Mordor Intelligence | |||
Housing Market Contraction Constrains New-Unit Demand
Housing starts fell in 2025 and reached a multi-decade low, which weakens first-installation demand for large appliances and shifts the market to a replacement-centric profile. Owner-occupied, rental, and condominium starts each declined, and builders paused projects to align with new energy provisions, which delayed purchases of HVAC and white goods for new builds. Household formation plateaued in 2026 and is expected to trend lower through 2030, so unit growth depends on shorter replacement cycles rather than net household additions in the Japan home appliances market. Regional divergence adds complexity because urban hubs retrench less than rural prefectures that face outmigration and aging-in-place patterns that defer relocation-triggered purchases. In this context, OEMs target compact, assistive, and voice-friendly devices for elderly households to defend volumes while new-unit demand remains soft.
Yen Depreciation Amplifies Input-Cost Volatility
The yen averaged weak levels against the USD in 2024 and is projected to stabilize by year-end 2026, but import price indexes remain higher, which raises costs for semiconductors, compressors, and displays that are essential across major and small appliances. Durable goods prices show pronounced sensitivity to exchange-rate shifts, and producers often face multi-quarter lags when passing costs through to consumers in a price-transparent retail environment. Larger OEMs sometimes accept margin compression to protect share, while smaller brands with less scale raise shelf prices and risk volume declines in entry categories. Hedging expenses and higher working-capital needs constrain cash available to fund automation and R&D, complicating the timing of technology migrations that underpin premiumization in the Japan home appliances market. These currency effects add near-term uncertainty to distributors' and retailers' planning cycles, which manage seasonal peaks and promotional calendars.
*Our forecasts treat driver/restraint impacts as directional, not additive. The impact forecasts reflect baseline growth, mix effects, and variable interactions.
Segment Analysis
By Product Category: Refrigerators Anchor Ecosystems; Coffee Makers Ride Specialty Boom
Refrigerators held the largest share at 22.96% in 2025, and the category anchors connected kitchen ecosystems with inverter-driven models that reduce energy use compared with older stock. The Japan home appliances market benefits from city rebates that reward top-rated energy labels and compress the replacement window for older units with high electricity consumption. Premium features like food management via internal cameras, air-purification modules, and rapid-cooling compartments support higher prices while meeting convenience and hygiene preferences in dense housing. As smart platforms expand, OEMs push over-the-air updates and app integrations that sustain use-value across ownership, which aids retention during long service lives in the Japan home appliances market.
Coffee makers are the fastest-growing subcategory with a 3.42% forecast CAGR (2026-2031), helped by a specialty coffee wave and compact designs that fit small kitchens in Tokyo and other large cities. Automation features like grind-to-brew and precise temperature control now fit in ultra-narrow footprints, expanding placement options in apartments where countertop space is limited. Small appliances tied to time-saving and health-centric cooking also gain from connected features and app-guided routines, which support cross-selling opportunities across vacuum cleaners, rice cookers, and air fryers. Air conditioners remain resilient at high penetration due to hotter summers and demand-response readiness that integrates with utility programs in Kanto and Kansai. Countertop dishwashers present white space because household penetration is lower than in major Western markets, which gives compact Japanese models a path to first-time adoption


By Distribution Channel: Specialty Chains Leverage Service; Online Races Ahead
Specialty chains still command 39.64% of the transaction value in 2025, yet their mission now extends beyond inventory holding to experiential theater, where consumers test products whose technical specs they have already compared online. Showrooms introduce augmented reality overlays that simulate appliance fit in actual kitchens, bridging the tactile gap that once protected brick-and-mortar. E-commerce boasts a 12.06% forecast CAGR (2026-2031), fueled by widespread same-day delivery and easier returns that lessen perceived risk for bulky goods. Multi-brand big-box stores claim 34.78% share of revenue in 2025 and pivot to hybrid store-warehouse formats that shorten last-mile costs and provide localized clicks-to-bricks conversion points. Direct-to-consumer websites remain a 5.06% niche but attract design-centric brands like Balmuda seeking deeper customer data and higher gross margins. Cross-border imports circumvent distribution markups, challenging tariff structures and compelling domestic players to emphasize after-sales service as a moat.
Regulation tightens under METI’s new e-commerce reporting standards, demanding verified seller identities and mandatory warranty disclosures, favoring platforms that can absorb compliance overhead. Cyber Monday and Singles’ Day promotions imported from overseas retail calendars generate seasonal spikes, forcing domestic logistics networks to scale flex capacity quickly. Retail finance evolves, with utility-linked installment plans lowering barriers for high-priced energy-efficient models. AI-driven recommendation engines increase attachment rates for extended warranties and smart-home accessories, lifting average order value. Clickstream analytics feed back into OEM product planning, aligning SKU offerings with emerging search trends within weeks rather than quarters. Rural penetration improves as 5G densifies, shrinking the service quality gap with urban areas and raising national e-commerce potential beyond existing projections.
Geography Analysis
Kanto holds the largest 40.34% share in 2025, supported by population density, a strong specialty-store footprint, and e-commerce fulfillment speeds that shorten delivery windows for major and small appliances. Smart-home penetration in Kanto is higher than the national average, and time-of-use tariffs from local utilities help shift the operation of connected appliances toward off-peak hours. Retail competition is intense, with megastores and last-mile logistics networks compressing decision cycles during seasonal peaks. As codes tighten, retrofits in older buildings create opportunities for efficient HVAC and appliance upgrades that are coordinated through smart-home platforms in the Japan home appliances market.
Kansai follows with a significant share and the fastest growth path among major regions due to compact urban planning and a base of manufacturers that pilot innovations locally before nationwide releases. Demand for space-saving appliances is strong in Osaka and Kyoto, where installation widths are tight, and this favors slim washer-dryers and counter-depth refrigerators that fit local kitchens in the Japan home appliances market. Growth in Kansai also benefits from energy-efficiency retrofits in heritage structures, where only internal modernization is allowed, which pushes upgrades to HVAC and white goods rather than structural changes.
Hokkaido is a notable growth pocket with a 3.68% forecast CAGR(2026-2031), supported by cold-climate heat pump adoption that replaces kerosene heaters and aligns with renewable integration. OEMs have advanced defrost and low-temperature performance in air-to-water and room AC systems to maintain comfort during long sub-zero spans, which sustains demand in northern prefectures. Chubu and Tohoku trail in growth as demographics skew older and net migration flows to Tokyo, yet assistive and voice-controlled models ship in a higher mix to rural addresses where elderly ratios are elevated. The rest of Japan, including Kyushu, Okinawa, Chugoku, and Shikoku, maintains stable demand patterns and is active in pilots for last-mile delivery and smart-city infrastructure that may influence future appliance integration in the Japan home appliances market.
Competitive Landscape
The market shows moderate concentration, with Panasonic, Sharp, Hitachi, Daikin, and Mitsubishi Electric together over half of revenue in 2025 across major categories and connected ecosystems. Strategy shifts toward software and services are evident as manufacturers embed connectivity and AI into a wide price range, then monetize energy scheduling, cooking guidance, and predictive maintenance over time. This model supports recurring revenue that offsets hardware-margin pressure in price-transparent channels, and it deepens user lock-in by linking devices into home energy and lifestyle routines in the Japan home appliances market.
Panasonic introduced the HomeCHEF Connect 4-in-1 multi-oven in 2025 with app-based guided cooking and over-the-air updates that build stickiness after purchase. Sharp emphasized smart connectivity and compact designs for small spaces, then showcased more than 20 new kitchen appliances at KBIS 2026 that target premium features with practical footprints. Mitsubishi Heavy Industries Thermal Systems announced 2026 S Series models that meet fiscal 2027 energy-efficiency targets and add user-friendly automation features, which expand compliant options as codes tighten. Daikin continued investments in next-generation HVAC platforms and connected services, and highlighted high-efficiency offerings at the 2026 AHR Expo that reflect broader decarbonization and refrigerant transitions in the Japan home appliances market.
Compliance and interoperability are competitive levers as ecosystems mature. Sharp secured multiple design and product awards in 2025 that validate compact and connected approaches to Japanese kitchens, and its product roadmap highlights smart features that align with local layout constraints. OEMs localize data handling to comply with Japan’s privacy requirements to build trust as device telemetry becomes more valuable for energy and service applications. Integration with utility programs and home energy systems positions connected HVAC to play a larger role in demand response, supporting both user savings and grid stability across the Japan home appliances market in Kanto and Kansai.
Japan Home Appliances Industry Leaders
Panasonic Holdings Corp.
Hitachi Global Life Solutions
Sharp Corp.
Mitsubishi Electric Corp.
Toshiba Corp.
- *Disclaimer: Major Players sorted in no particular order

Recent Industry Developments
- February 2026: Daikin plans to launch two commercial air-conditioning units in Japan. The multi-jet, expected in mid-April 2026, is designed for factories and large indoor spaces with an airflow reach of up to 20 meters. The five-star zeas, scheduled for April 2026, is an energy-saving model featuring optional condensation-suppression kits and maintaining 108% cooling capacity at 43 °C outdoor temperatures.
- February 2026: Sharp launched compact kitchen appliances, including refrigerators, ovens, and dishwashers, designed for small-space living. These appliances, set to launch in spring 2026, align with urban Japanese consumer demand for space-efficient and high-design solutions.
- November 2025: Mitsubishi Heavy Industries Thermal Systems introduced the 2026 S Series high-capacity residential air conditioners, which meet fiscal 2027 energy-efficiency standards. These models include an AI automatic comfort mode that uses motion and thermal sensors, along with an aqua ozone mode to suppress odor-causing bacteria and mold.
- April 2025: Sharp Corporation obtained JC-STAR security labels for 77 AIoT home appliance models across five categories. It highlights compliance with Japan's national IoT security frameworks, differentiating smart-connected product portfolios in the market.


Japan Home Appliances Market Report Scope
A home appliance is anything that makes it easier for you to do things like cook, clean, and store food. It could be called a home appliance, an electrical appliance, or just a home appliance. Major appliances, small appliances, and distribution channels segment the Japan home appliances market. By major appliances, the market is segmented into refrigerators, freezers, dishwashers, washing machines, microwaves and ovens, air conditioners, and other major appliances. By small appliances, the market is segmented into coffee or tea makers, food processors, grills & toasters, vacuum cleaners, and other small appliances, and by distribution channel, the market is segmented into multi-brand stores, exclusive stores, online, and other distribution channels. The report offers market size and forecasts for the Japan home appliances market in value (USD) for all the above segments.
By Product
| Major Home Appliances | Refrigerators |
| Freezers | |
| Washing Machines | |
| Dishwashers | |
| Ovens (Incl. Combi & Microwave) | |
| Air Conditioners | |
| Other Major Home Appliances | |
| Small Home Appliances | Coffee Makers |
| Food Processors | |
| Grills & Roasters | |
| Electric Kettles | |
| Juicers & Blenders | |
| Air Fryers | |
| Vacuum Cleaners | |
| Electric Rice Cookers | |
| Toasters | |
| Counter-top Ovens | |
| Other Small Home Appliances |
By Distribution Channel
| Multi-Brand Stores |
| Exclusive Brand Outlets |
| Online |
| Other Distribution Channels |
By Geography
| Hokkaido |
| Tohoku |
| Kanto |
| Chubu |
| Rest of Japan |
| By Product | Major Home Appliances | Refrigerators |
| Freezers | ||
| Washing Machines | ||
| Dishwashers | ||
| Ovens (Incl. Combi & Microwave) | ||
| Air Conditioners | ||
| Other Major Home Appliances | ||
| Small Home Appliances | Coffee Makers | |
| Food Processors | ||
| Grills & Roasters | ||
| Electric Kettles | ||
| Juicers & Blenders | ||
| Air Fryers | ||
| Vacuum Cleaners | ||
| Electric Rice Cookers | ||
| Toasters | ||
| Counter-top Ovens | ||
| Other Small Home Appliances | ||
| By Distribution Channel | Multi-Brand Stores | |
| Exclusive Brand Outlets | ||
| Online | ||
| Other Distribution Channels | ||
| By Geography | Hokkaido | |
| Tohoku | ||
| Kanto | ||
| Chubu | ||
| Rest of Japan | ||


Key Questions Answered in the Report
What is the current size and growth outlook for the Japan home appliances market?
The Japan home appliances market size is USD 25.93 billion in 2026 and is projected to reach USD 29.49 billion by 2031 at a 2.61% CAGR
Which product category leads sales in Japan’s home ecosystem?
Refrigerators lead with 22.96% of 2025 revenue because they anchor connected kitchen ecosystems and are central to energy-efficiency upgrades.
Which sales channels are growing fastest for appliances in Japan?
Online retail is the fastest-growing channel with a 4.13% projected CAGR(2026-2031) as same-day delivery and subscriptions scale in large metros.
Which region contributes the most to appliance demand in Japan?
Kanto holds the largest share at 40.34% in 2025, supported by population density, retail breadth, and rapid fulfillment capabilities.
How are policies influencing replacement cycles for appliances in Japan?
Top Runner standards and 2025 building energy codes are accelerating replacements by pushing higher efficiency targets across new installations and upgrades.
What are the major risks to appliance makers operating in Japan?
Housing starts softness and yen volatility are key risks that pressure unit demand and margins, especially for brands with higher import exposure and limited pricing power.
Page last updated on:


