Carbon Composites Market Size and Share
Market Overview
| Study Period | 2021 - 2031 |
|---|---|
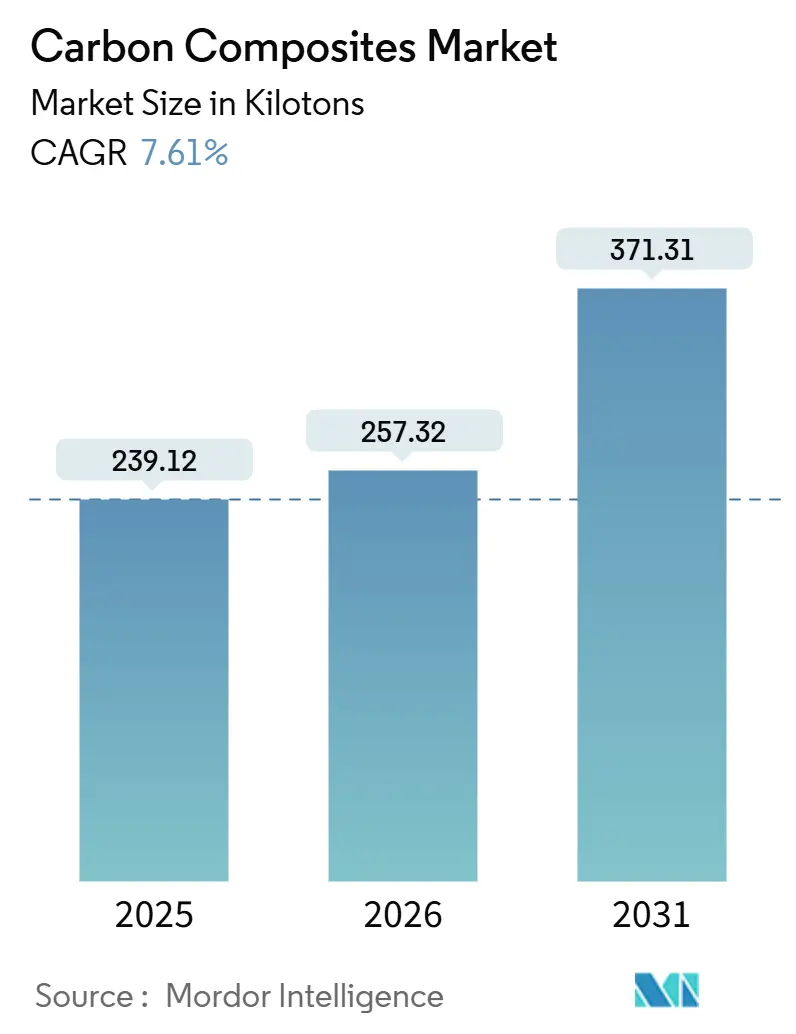
| Market Volume (2026) | 257.32 kilotons |
| Market Volume (2031) | 371.31 kilotons |
| Growth Rate (2026 - 2031) | 7.61% CAGR |
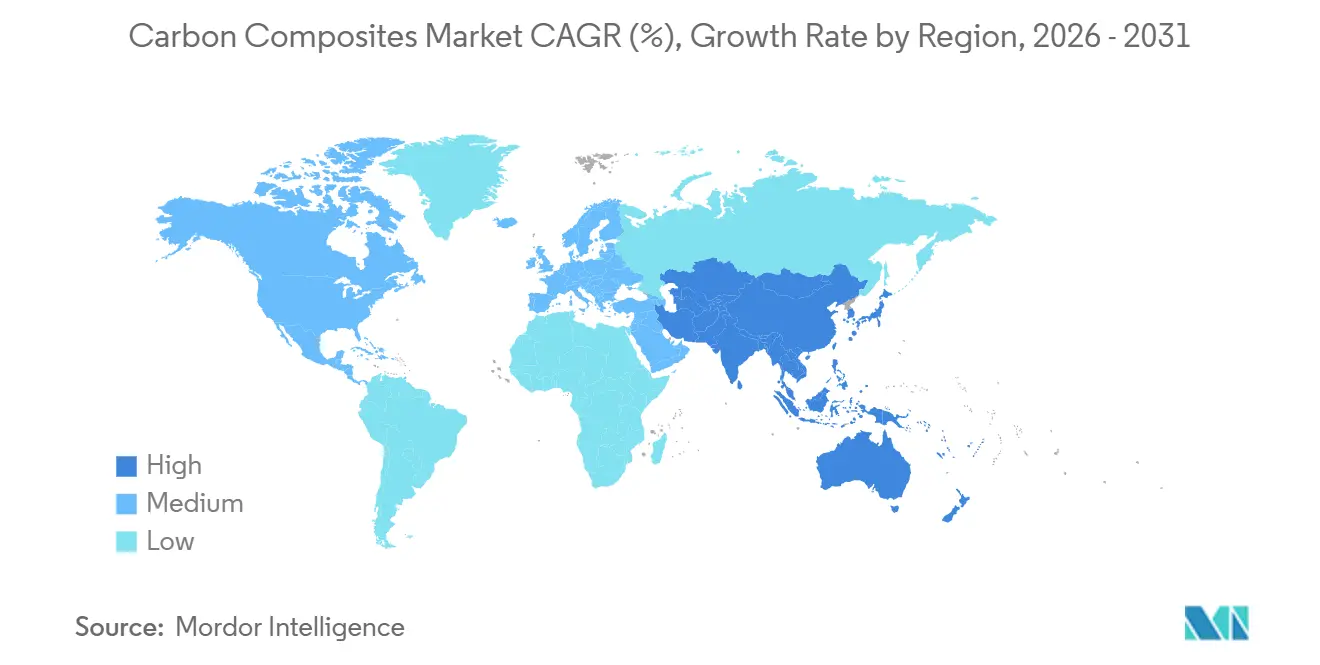
| Fastest Growing Market | Asia Pacific |
| Largest Market | Asia Pacific |
| Market Concentration | Medium |
Major Players *Disclaimer: Major Players sorted in no particular order Image © Mordor Intelligence. Reuse requires attribution under CC BY 4.0. | |
Carbon Composites Market Analysis by Mordor Intelligence
The Carbon Composites Market size is expected to increase from 239.12 kilotons in 2025 to 257.32 kilotons in 2026 and reach 371.31 kilotons by 2031, growing at a CAGR of 7.61% over 2026-2031. Falling fiber prices, rapid offshore-wind scale-up, and the electrification push in transportation are expanding the addressable volume base for the Carbon composites market. Large-tow overcapacity in China reset average T300-grade prices to about USD 12 per kilogram by late 2024, accelerating adoption in wind-turbine blades and hydrogen vessels while compressing margins for incumbents. Automakers are gravitating toward fast-cycle thermoplastic platforms that deliver sub-5-minute part takt times, enabling structural battery-tray programs without autoclave bottlenecks. Aerospace keeps its premium share on the back of certified prepreg pipelines, yet capacity constraints in 6-meter-plus autoclaves are steering wide-body programs toward Out-of-Autoclave (OoA) resin systems.
Key Report Takeaways
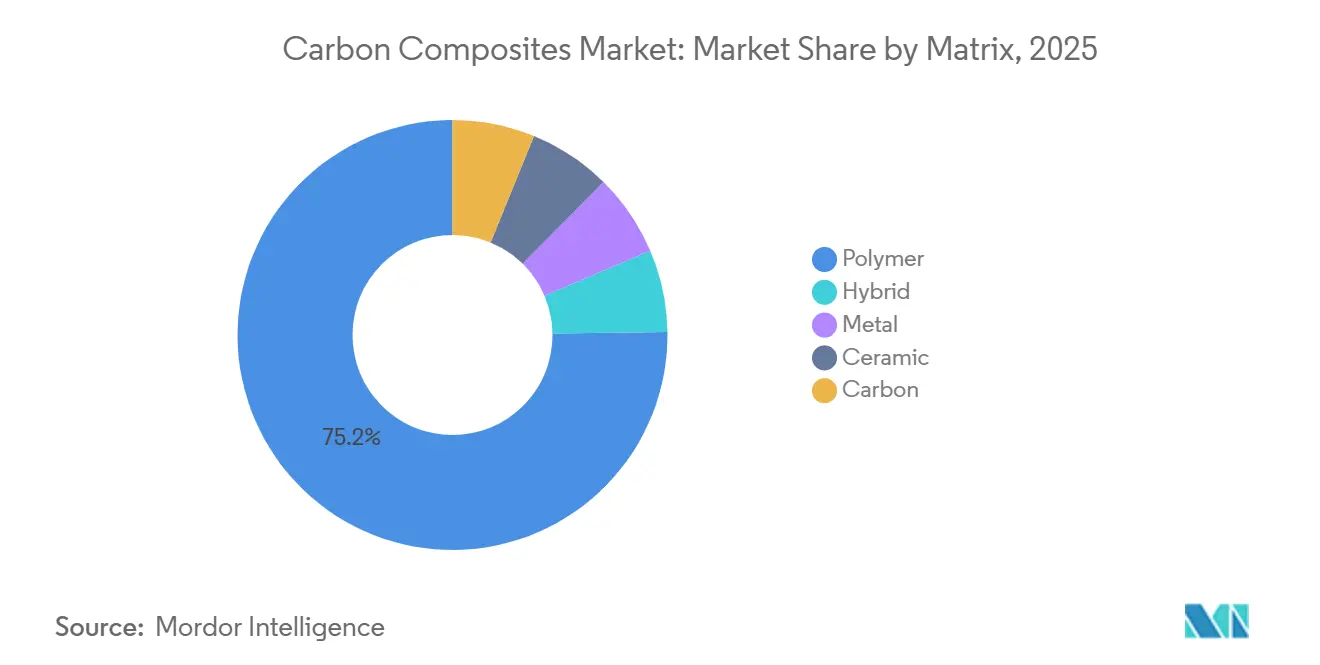
- By matrix, polymer had the largest market share of 75.22% in 2025. Polymer's market share is also expected to increase at a CAGR of 8.72% during the forecast period (2026-2031).
- By process, press and injection processes had the largest share of 33.26% in 2025, and this is expected to grow at a CAGR of 8.34% during the forecast period (2026-2031).
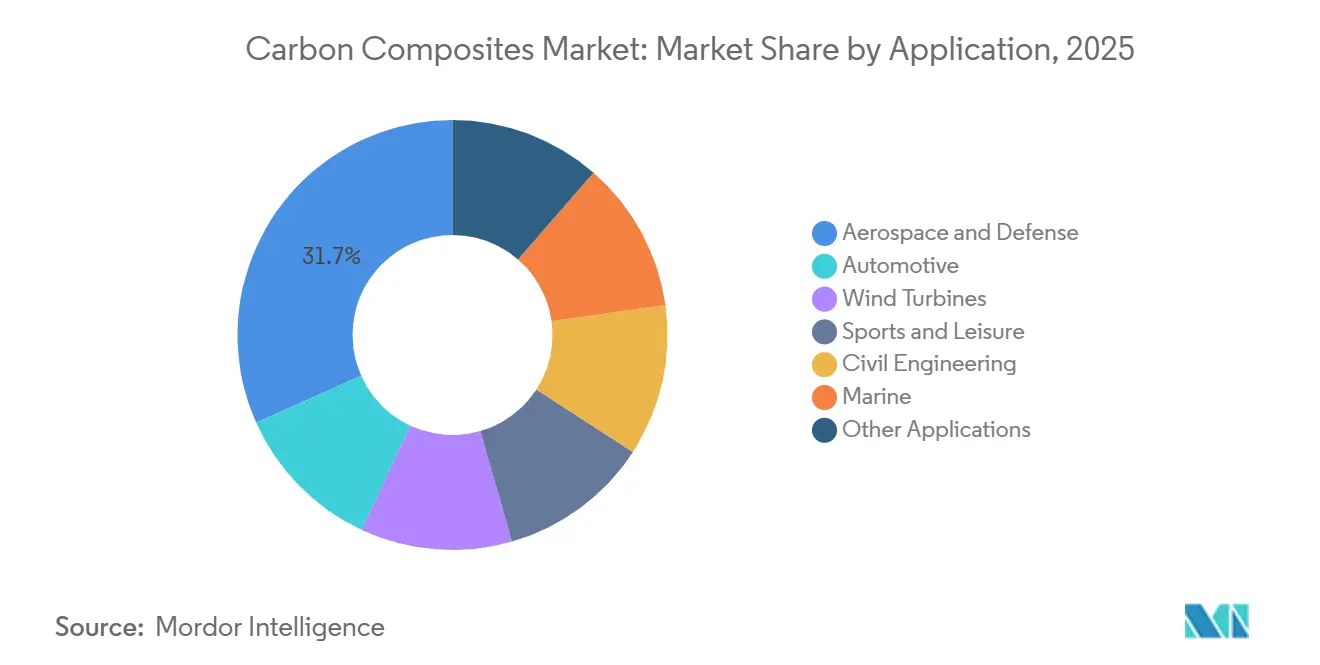
- By application, aerospace and defense had the largest share of 31.67% in 2025, while the share of wind turbines is expected to grow with a CAGR of 8.28% during the forecast period (2026-2031).
- By geography, the Asia Pacific had the largest market share of 39.12% in 2025, and this is expected to increase at a CAGR of 8.66% during the forecast period (2026-2031).
Note: Market size and forecast figures in this report are generated using Mordor Intelligence’s proprietary estimation framework, updated with the latest available data and insights as of January 2026.
Global Carbon Composites Market Trends and Insights
Drivers Impact Analysis
| Driver | (~) % Impact on CAGR Forecast | Geographic Relevance | Impact Timeline |
|---|---|---|---|
| EV range-extension imperative | +1.2% | China, European Union, North America | Medium term (2-4 years) |
| Upsized offshore wind blades (more than or equal to 100 m) | +1.8% | China, North Sea, U.S. Atlantic seaboard | Long term (≥4 years) |
| Chinese large-tow price impact | +1.5% | Originating in China, diffusing globally | Short term (≤2 years) |
| Hydrogen logistics Type-IV/Type-V CFRP vessels | +0.9% | North America, European Union, Japan, South Korea | Long term (≥4 years) |
| Space-launch demand for reusable CFRP cryo-tanks | +0.6% | United States, Europe, emerging Asia-Pacific | Medium term (2-4 years) |
| Source: Mordor Intelligence | |||
EV Range-Extension Imperative
Battery-electric models carry 400-600 kg battery packs. Carbon-fiber battery housings deliver 40-60% mass savings versus aluminum, yielding 15-25 km extra range for every 10 kg trimmed[1]Fraunhofer Institute, “Lightweight Battery Enclosure Research,” fraunhofer.de. SGL Carbon’s COOLBat demonstrator reduced enclosure weight by 35% while integrating active cooling paths. Yet BMW’s 2025 Neue Klasse program sidelined widespread carbon fiber use because lifecycle emissions still average 17.35 kg CO₂-eq per kg of fiber under coal-based grids. Cost-competitive short-fiber thermoplastic housings priced at USD 8-10 per kg, co-developed by SABIC and Kautex, are now aimed at premium 500 km-plus range cars. The bifurcation signals that the Carbon composites market will depend on luxury and performance EVs until renewable-powered fiber lines push delivered costs toward USD 10 per kg.
Upsized Offshore Wind Blades (more than or equal to 100 m)
Blade lengths above 100 m demand carbon spar caps to meet 25-year fatigue life. MingYang’s 143 m prototype uses Hengshen fiber to keep tip deflection under 8 m at rated wind speed[2]MingYang Smart Energy, “143 m Offshore Blade Announcement,” mingyang.com. Dongfang Electric’s 153 m blade trims 18% mass versus an all-glass layup, easing installation for floating foundations where crane-vessel rates exceed USD 500,000 per day. Vestas and Siemens Gamesa designs indicate carbon content rising from 8-12% of blade mass in 2025 to about 20% by 2030. TPI Composites reopened its Iowa plant in mid-2025 after a 10% blade price uplift driven by the longer-blade mix. As offshore additions accelerate, the Carbon composites market will benefit from 8-10 tonnes of fiber per new 12-15 MW turbine.
Chinese Large-Tow Price Impact (2026+)
Installed Chinese capacity climbed to roughly 135,500 t in 2024, overshooting domestic demand of 84,000 tons. Spot prices for T300-12K fiber fell from USD 33 per kg in 2022 to about USD 12 per kg by late 2024. Large tow lines (48K-50K) cut unit costs by 30% by boosting throughputs per oxidation furnace. Rising 2025 exports let European and United States fabricators substitute Chinese grades in non-aerospace applications. Toray and Jilin Chemical Fiber announced 10-20% hikes effective January 2026, but durability depends on demand recovery in cost-sensitive automotive and industrial segments.
Hydrogen Logistics Type-IV/Type-V CFRP Vessels
A 62.4-L Type-IV tank rated at 700 bar uses about 33 kg of fiber and costs USD 800-1,200. Type-V variants eliminate the liner, shaving 10-20% weight and surpassing 6 wt% storage density. The United States Department of Energy targets USD 15-20 per kg fiber pricing by 2030, spurring automated filament-winding programs with 15-minute takt cycles. Hexagon Purus’s Norway site targets 10,000 tanks per year in 2026, while Japanese NEDO (New Energy and Industrial Technology Development Organization) trials probe maritime 500-bar storage for 1,000-nautical-mile ferry range.
Restraints Impact Analysis
| Restraint | (~) % Impact on CAGR Forecast | Geographic Relevance | Impact Timeline |
|---|---|---|---|
| Al-Li and 3rd-gen AHSS substitution threat | -0.8% | Global aerospace and automotive | Medium term (2-4 years) |
| Global autoclave bottleneck (wide-body aero) | -0.5% | North America, Europe | Short term (≤2 years) |
| PFAS-linked sizing-agent bans | -0.3% | European Union, North America | Long term (≥4 years) |
| Source: Mordor Intelligence | |||
Al-Li and 3rd-Gen AHSS Substitution Threat
Aluminum-lithium alloys trim up to 10% weight in fuselage frames while cutting maintenance outlays by 15-20% because repairs use established metal techniques. Third-generation AHSS delivers 980-1,180 MPa strength at over 15% elongation, supporting 20-25% mass-down-gauging at markedly lower CO₂ footprints. BMW’s decision to skip broad carbon-fiber use on Neue Klasse EVs reflects these lifecycle and cost realities. The Carbon composites industry will remain exposed until renewable electricity systematically cuts precursor emissions.
Global Autoclave Bottleneck (Wide-Body Aero)
Boeing’s South Carolina site runs five 6-m-diameter autoclaves, capping 787 barrel throughput at roughly 60 units per month. OoA systems such as Hexcel M77 meet 1.2% void allowance without pressure, yet lay-up labor rises 10-15% and thick-section porosity challenges linger. Certification under FAA AC 20-107B stretches 3-5 years, so the restraint shaves near-term build-rate flexibility for next-generation wide-bodies.
Segment Analysis
By Matrix: Polymer Dominance Anchors Volume Growth
Polymer composites commanded 75.22% of the Carbon Composites market share in 2025 and are projected to advance at an 8.72% CAGR during the forecast period (2026-2031). Thermoplastic PEEK (Polyetheretherketone) and PPS (Polyphenylene Sulfide) parts for Airbus brackets now cure in under five minutes, while BMW i-series structures demonstrate recyclability and damage tolerance advantages. Metal-matrix and carbon-carbon formats stay at a low share because of high raw-material costs that exceed USD 500 per kg. Thermoplastic content inside the Polymer segment could rise to a nominal slice of the Carbon Composites market size by 2031 as polyamide 6 resin-transfer molding drops cycle times below 10 minutes.
Demand momentum rests on automotive battery trays, aerospace clips, and wind-blade trailing edges deploying hybrid epoxy-thermoplastic interlayers. Gurit’s 98-m prototype validated the design through 5-million fatigue cycles per IEC 61400-23, cutting delamination complaints in the root end. Re-meltable thermoplastic off-cuts reduce scrap cost for tier-1 molders, buttressing the long-term sustainability narrative of the Carbon composites market.
Note: Segment shares of all individual segments available upon report purchase
By Process: Press and Injection Lead Volume Manufacturing
Press and injection routes delivered 33.26% of the Carbon Composites market size in 2025 and will widen at an 8.34% CAGR during the forecast period (2026-2031). Compression-molded Sodium Metal Chloride (SMC) battery pans for 50,000-unit EV platforms operate on two-minute cyclicity and cut 9 kg from steel baselines. Pultrusion and continuous winding feed offshore-wind spar-cap tapes at 90-95% fiber volume, ensuring predictable quality for 100-m blades. Wet lamination and infusion stay relevant for marine hulls and civil-bridge retrofits where complex curvature offsets longer tack times.
Additive processes join the mainstream as Thermwood LSAM machines print 6-m hull plugs at 10 kg/hr deposition, shrinking tool-fabrication timelines by 40%. AFP deposition rates now touch 100 kg/hr on Electroimpact gantries for 777X wing skins, amplifying the Carbon composites industry’s drive to reduce unit labor.
By Application: Aerospace Anchors Share, Wind Turbines Drive Growth
Aerospace and defense held a 31.67% share in 2025, rooted in Boeing 787 and Airbus A350 output. Still, wind-turbine blades are poised to log the fastest 8.28% CAGR during the forecast period (2026-2031) as 12-16 MW offshore machines standardize 100-115 m blades needing 8-10 t of carbon per unit. Carbon composites market size for wind is therefore set to eclipse aerospace volume growth by 2030.
Automotive demand flattens after BMW’s Neue Klasse pivot, redirecting attention toward niche supercars and commercial-vehicle hydrogen tanks. Sports and leisure grow methodically at 4-5% on premium bicycles, while medical devices and consumer electronics together add single-digit growth under miniaturization trends.
Note: Segment shares of all individual segments available upon report purchase
Geography Analysis
Asia-Pacific retained 39.12% of the Carbon Composites market share in 2025, and is forecast to expand at an 8.66% CAGR during the forecast period (2026-2031). Chinese producers such as Zhongfu Shenying and Guangwei scaled large-tow lines to push domestic self-sufficiency beyond 80% in 2024, targeting 90% by 2026. Offshore-wind blade demand in Guangdong and Jiangsu alone consumed more than 10,000 tons of carbon fiber in 2025. Japan sustains leadership in T1000G and M60J high-modulus grades, with Toray’s Ehime plant occupying the premium aviation niche.
North America ranks second in terms of the market share, underpinned by Hexcel prepreg supply into Boeing, Lockheed Martin, and Northrop Grumman. TPI Composites’ Iowa re-opening in mid-2025 exemplifies supply-demand tightness for 100-m wind blades destined for Vineyard Wind and South Fork projects. Automotive composite uptake is moderate because the United States fuel-economy rules trail European CO₂ norms, leaving cost-advantaged steel and aluminum prevalent in pickups and SUVs.
Europe's share, driven by Airbus programs and offshore-wind installations at Dogger Bank and Baltic Eagle. Germany and France lead automotive composites though BMW’s strategy reset tempers volume forecasts. Gurit’s Swiss engineering center and SGL Carbon’s German plants secure critical mass in thermoplastic bracketry. Nordic marine applications, including electric ferries, absorb incremental composite tonnage but remain below 1,000 tons annually.
Competitive Landscape
The Carbon Composites market is moderately consolidated. Price competition dropped T300 spot quotes to USD 12 per kg, pushing Western incumbents toward aerospace-only margins. Toray’s T1100G, qualified on 787 wing skins, still secures USD 150-200 per kg price points, underscoring the moat around certified high-modulus grades. No M&A (mergers and acquisitions) deals above USD 500 million surfaced in 2025, reflecting valuation gaps amid cyclical price troughs.
Carbon Composites Industry Leaders
TORAY INDUSTRIES, INC.
Hexcel Corporation
Mitsubishi Chemical Group Corporation
SGL Carbon
Teijin Limited
- *Disclaimer: Major Players sorted in no particular order
Recent Industry Developments
- November 2025: Epsilon Composite, a French firm renowned for its expertise in carbon fibre-based composites, unveiled its new subsidiary, HindEpsilon Composite, in Chennai, India. Spearheading this initiative is Epsilon's Cable division, which focuses on the development and production of HVCRC (composite core electrical conductors) technology.
- November 2024: Toray Advanced Composites has acquired assets, technology, and intellectual property from Gordon Plastics. This strategic acquisition enhances TAC's capabilities in the development, testing, and production of continuous fiber-reinforced thermoplastic composite unidirectional (UD) tapes and higher-melting-temperature polymer systems.
- February 2024: Syensqo partnered with Trillium to deliver sustainable solutions that enable customers to achieve their environmental objectives. Through this collaboration, Syensqo emphasizes the creation of sustainable raw materials tailored for carbon fiber applications. Syensqo and Trillium expect to further advance towards fully bio-based carbon fiber composites.
Global Carbon Composites Market Report Scope
Carbon composites are composite materials with carbon fiber reinforcements. Carbon composites usually comprise 80%–90% carbon and graphite. The unique blend of natural and synthetic graphite particles, carbon fibers, and amorphous carbon particles is proprietary and tailored for specific desired properties.
The carbon composites market is segmented by matrix, process, application, and geography. By matrix, the market is segmented into hybrid, metal, ceramic, carbon, and polymer. By process, the market is segmented into prepreg layup process, pultrusion, wet lamination and infusion process, press and injection processes, and others (3D printing). By application, the market is segmented into aerospace and defense, automotive, wind turbines, sport and leisure, civil engineering, marine applications, and other applications (electronics, medical applications, protective clothing, and pressure vessels). The report also covers the market size and forecasts for carbon composites in 17 countries across major regions. For each segment, the market sizing and forecasts have been done on the basis of volume (kilotons).
| Hybrid | |
| Metal | |
| Ceramic | |
| Carbon | |
| Polymer | Thermosetting |
| Thermoplastic |
| Prepreg Lay-up |
| Pultrusion and Winding |
| Wet Lamination and Infusion |
| Press and Injection Processes |
| Other Processes |
| Aerospace and Defense |
| Automotive |
| Wind Turbines |
| Sports and Leisure |
| Civil Engineering |
| Marine |
| Other Applications |
| Asia-Pacific | China |
| India | |
| Japan | |
| South Korea | |
| ASEAN Countries | |
| Rest of Asia-Pacific | |
| North America | United States |
| Canada | |
| Mexico | |
| Europe | Germany |
| United Kingdom | |
| France | |
| Italy | |
| Spain | |
| NORDIC Countries | |
| Russia | |
| Rest of Europe | |
| South America | Brazil |
| Argentina | |
| Rest of South America | |
| Middle-East and Africa | Saudi Arabia |
| South Africa | |
| Rest of Middle East and Africa |
| By Matrix | Hybrid | |
| Metal | ||
| Ceramic | ||
| Carbon | ||
| Polymer | Thermosetting | |
| Thermoplastic | ||
| By Process | Prepreg Lay-up | |
| Pultrusion and Winding | ||
| Wet Lamination and Infusion | ||
| Press and Injection Processes | ||
| Other Processes | ||
| By Application | Aerospace and Defense | |
| Automotive | ||
| Wind Turbines | ||
| Sports and Leisure | ||
| Civil Engineering | ||
| Marine | ||
| Other Applications | ||
| By Geography | Asia-Pacific | China |
| India | ||
| Japan | ||
| South Korea | ||
| ASEAN Countries | ||
| Rest of Asia-Pacific | ||
| North America | United States | |
| Canada | ||
| Mexico | ||
| Europe | Germany | |
| United Kingdom | ||
| France | ||
| Italy | ||
| Spain | ||
| NORDIC Countries | ||
| Russia | ||
| Rest of Europe | ||
| South America | Brazil | |
| Argentina | ||
| Rest of South America | ||
| Middle-East and Africa | Saudi Arabia | |
| South Africa | ||
| Rest of Middle East and Africa | ||
Key Questions Answered in the Report
What was the Carbon composites market size in 2026 and how fast is it growing?
It stood at 257.32 kilotons in 2026 and is forecast to rise to 371.31 kilotons by 2031 at a 7.61% CAGR.
Which region leads demand for carbon composites?
Asia-Pacific leads with 39.12% share in 2025 and is set to log the fastest 8.66% CAGR through 2031.
What segment is expanding quickest inside the Carbon composites market?
Wind-turbine blades show the highest 8.28% CAGR as offshore projects adopt 100 m-plus blades that rely on carbon-fiber spar caps.
How are falling fiber prices affecting adoption?
Large-tow overcapacity cut T300 fiber prices to about USD 12 kg by 2024, spurring uptake in wind energy and hydrogen tanks but squeezing producer margins.
Which companies dominate high-modulus aerospace grades?
Toray, Mitsubishi Chemical, and Teijin remain leaders in T1000+, M60J and similar grades due to proprietary precursor chemistry and long-standing aerospace qualifications.


