Polyurethane Composites Market Size and Share
Market Overview
| Study Period | 2020 - 2031 |
|---|---|
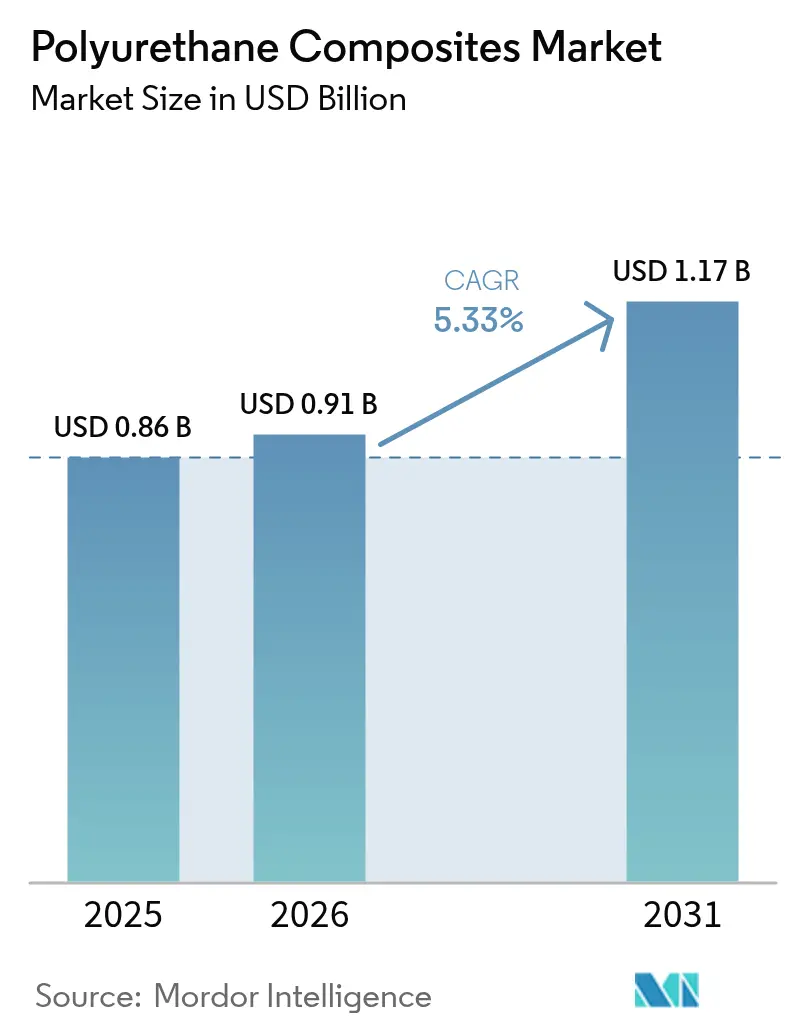
| Market Size (2026) | USD 0.91 Billion |
| Market Size (2031) | USD 1.17 Billion |
| Growth Rate (2026 - 2031) | 5.33% CAGR |
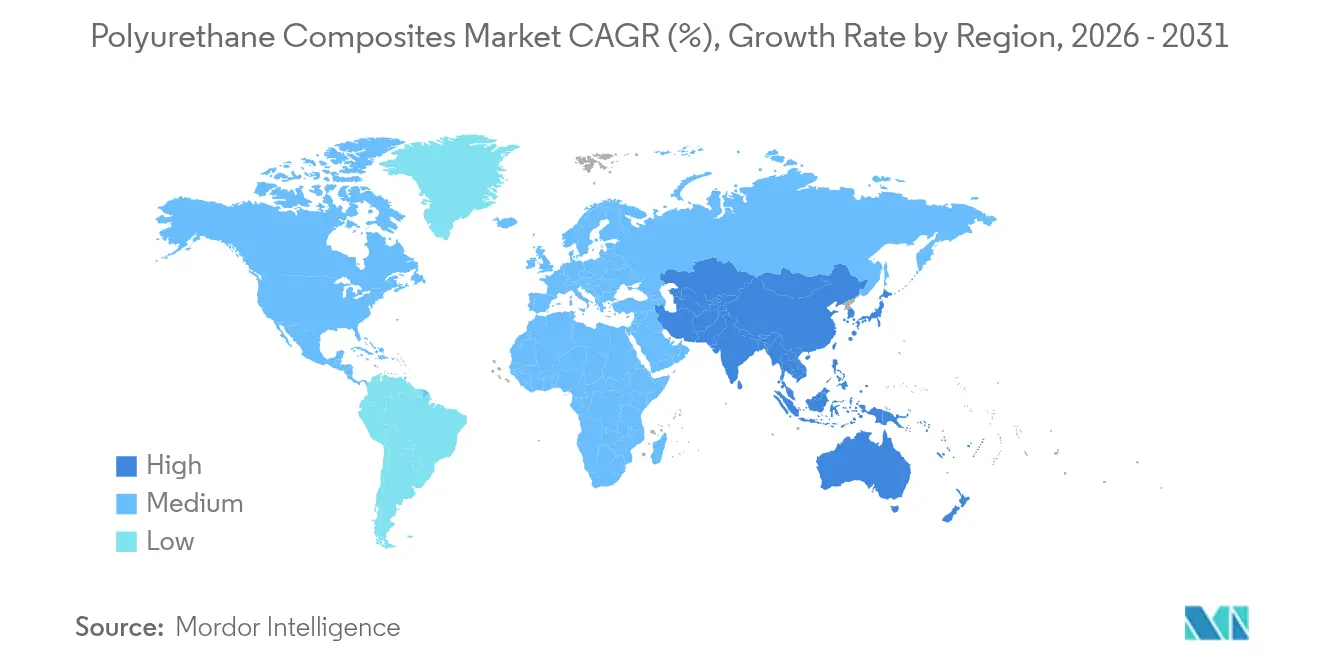
| Fastest Growing Market | Asia Pacific |
| Largest Market | Asia Pacific |
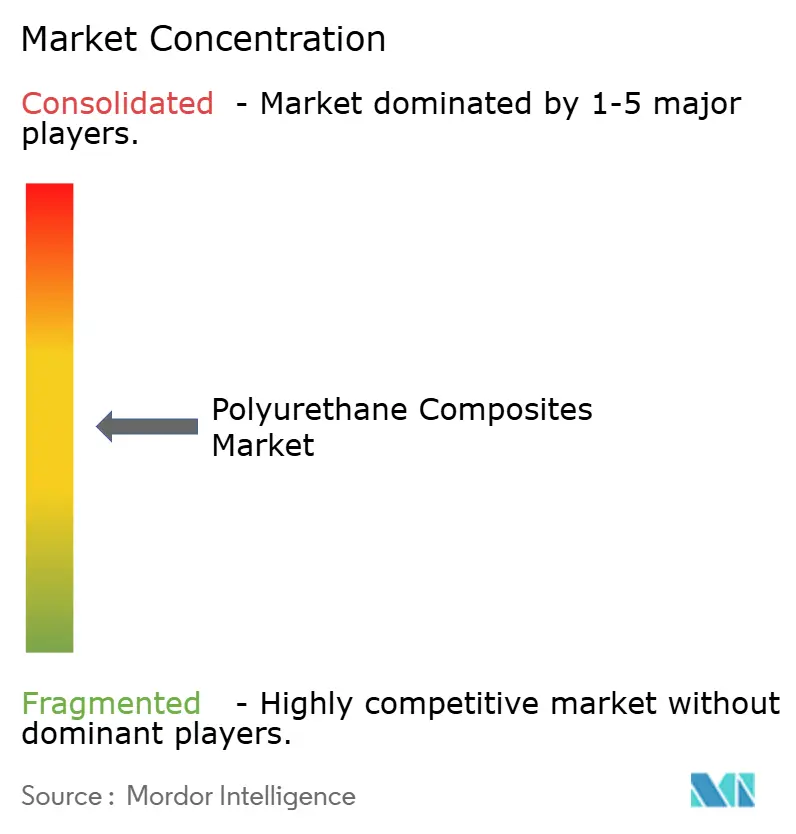
| Market Concentration | Medium |
Major Players *Disclaimer: Major Players sorted in no particular order Image © Mordor Intelligence. Reuse requires attribution under CC BY 4.0. | |
Polyurethane Composites Market Analysis by Mordor Intelligence
Polyurethane Composites Market size market size in 2026 is estimated at USD 0.91 billion, growing from 2025 value of USD 0.86 billion with 2031 projections showing USD 1.17 billion, growing at 5.33% CAGR over 2026-2031. Persistent demand for lightweight structures in automotive, aerospace, wind energy, and modern construction systems is the primary force anchoring this growth. Regulatory pressure to cut vehicle emissions, coupled with electrification targets, accelerates material substitution from metals toward composites that lower fuel consumption and extend electric-vehicle driving range. Rising investments in onshore and offshore wind farms stimulate blade length scaling, which favors polyurethane matrices thanks to their process speed and fatigue resistance. Builders also move to prefabricated structural insulated panels that combine fiberglass skins with polyurethane cores to meet tighter energy-efficiency codes. Bio-based and non-isocyanate resin chemistries are gaining commercial momentum as producers respond to EU toxicity caps and wider ESG reporting requirements.
Key Report Takeaways
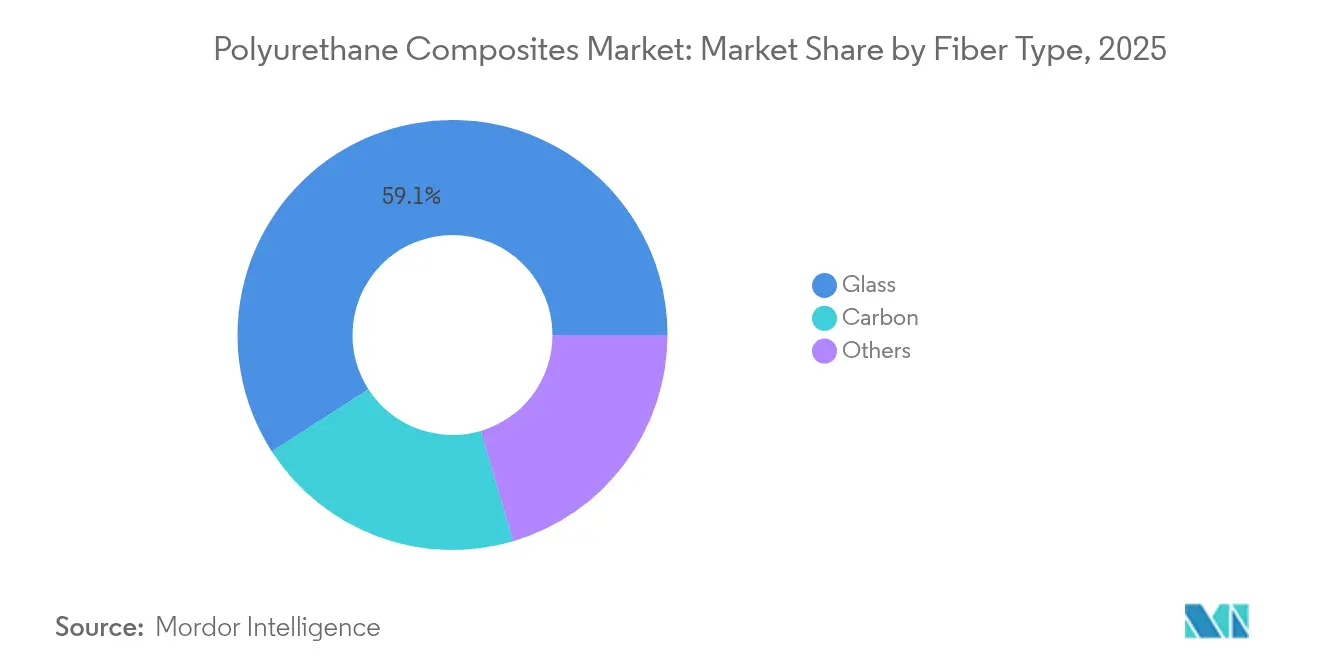
- By fiber type, glass fiber maintained a 59.12% revenue share in 2025; carbon fiber is projected to expand at a 6.21% CAGR through 2031.
- By resin type, thermoset polyurethane led with 60.00% of the polyurethane composites market share in 2025 and is advancing at a 6.55% CAGR to 2031.
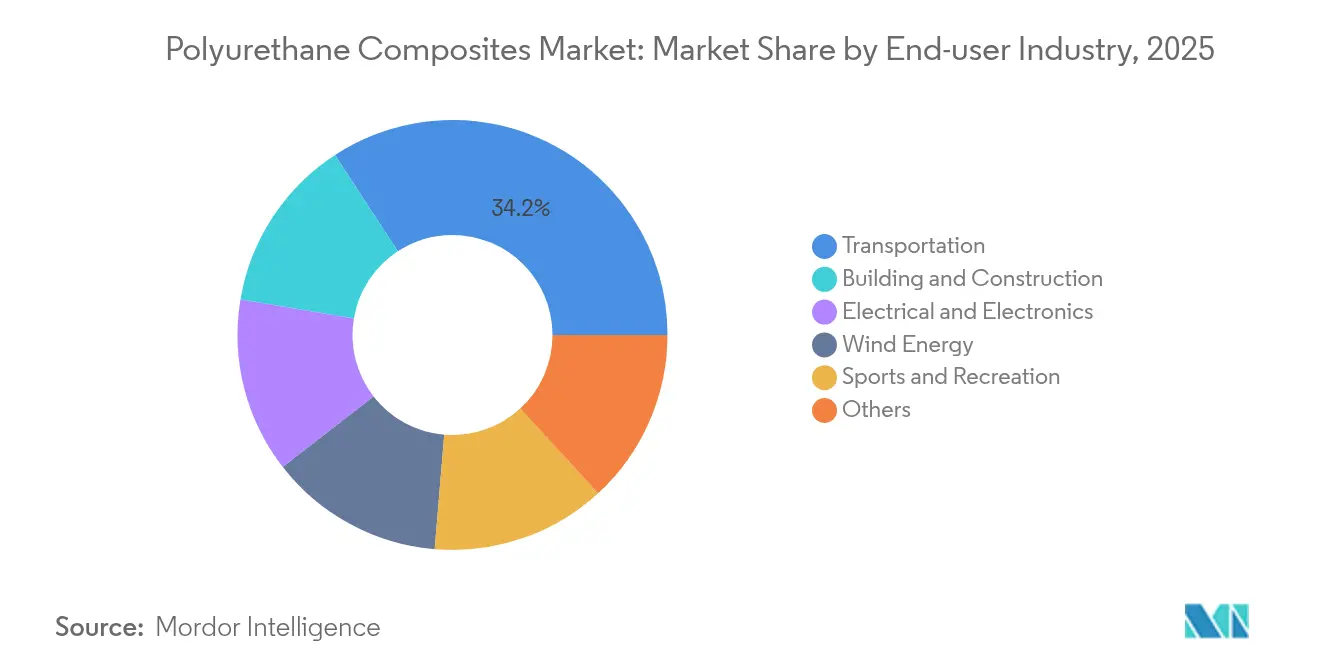
- By end-user industry, transportation captured 34.20% of 2025 demand, while wind energy applications are forecast to post a 7.05% CAGR during 2026-2031.
- By geography, Asia Pacific accounted for 52.30% of global revenue in 2025 and is expected to grow at a 7.25% CAGR through 2031.
Note: Market size and forecast figures in this report are generated using Mordor Intelligence’s proprietary estimation framework, updated with the latest available data and insights as of 2026.
Global Polyurethane Composites Market Trends and Insights
Driver Impact Analysis*
| Drivers | (~) % Impact on CAGR Forecast | Geographic Relevance | Impact Timeline |
|---|---|---|---|
| Lightweighting push in transportation | +1.8% | North America, EU, Global EV hubs | Medium term (2-4 years) |
| Rapid wind-turbine blade length scaling | +1.5% | Asia Pacific, spill-over to North America and EU | Long term (≥ 4 years) |
| Construction shift to modular PU-SIPs panels | +1.2% | North America, EU, emerging Asia Pacific | Medium term (2-4 years) |
| ESG-driven bio-based PU resin adoption | +0.9% | Global, led by EU policy | Long term (≥ 4 years) |
| Thermal-protective PU battery enclosures | +1.1% | Asia Pacific manufacturing, global EV demand | Short term (≤ 2 years) |
| Source: Mordor Intelligence | |||
Lightweighting Push in Transportation
Automotive, rail, and aerospace manufacturers are integrating polyurethane composites to comply with stringent efficiency rules and range expectations. Ford’s composite C-brace on the Bronco Raptor illustrates how weight reduction can be paired with noise and vibration dampening to improve ride comfort. Railcar builders also fit polyurethane glazing and sound-barrier components to meet stricter cabin-noise limits. Growing electric-vehicle production magnifies material substitution because battery packs impose a significant mass penalty that composite body structures can offset.
Rapid Wind-Turbine Blade Length Scaling
Longer blades raise megawatt output and cut the levelized cost of energy, driving demand for stiffer and lighter spar caps made with polyurethane and carbon fiber. Vestas validated Dow’s polyurethane-carbon spar technology, opening a pathway for blades that exceed 100 m without process slowdowns typical of epoxy curing. The US Department of Energy’s Big Adaptive Rotor program further highlights logistics bottlenecks that favor faster-curing polyurethane infusion routes.
Construction Shift to Modular PU-SIPs Panels
Builders are accelerating the uptake of fiberglass-skinned polyurethane structural insulated panels that arrive on site as ready-to-install modules. Composite Panel Building Systems reports that its C-SIS sheathings cut air leakage and deliver continuous insulation while eliminating delamination risk. Preflex studies show 45% lower whole-building energy use versus stick-frame walls. Modular approaches can reduce on-site labor by up to 70%, a critical benefit amid persistent skilled-worker shortages.
ESG-Driven Bio-Based PU Resin Adoption
Corporate emissions targets and the EU 0.1% diisocyanate threshold enacted in 2023 are accelerating bio-based resin development. BASF launched biomass-balanced thermoplastic polyurethane at its Lemförde site under ISCC PLUS certification, allowing customers to cut cradle-to-gate CO2 without altering performance. UC San Diego researchers synthesized aromatic diisocyanates entirely from D-galactose, removing reliance on toxic phosgene while preserving mechanical strength. John Deere’s soy- and corn-based formulations further underline the shift toward agriculture-sourced monomers in polyurethane composites industry product lines.
Restraint Impact Analysis*
| Restraints | (~) % Impact on CAGR Forecast | Geographic Relevance | Impact Timeline |
|---|---|---|---|
| Automotive production volatility | -1.2% | Global, traditional automotive hubs | Short term (≤ 2 years) |
| High carbon/PU composite fabrication costs | -0.8% | Global, premium segments | Medium term (2-4 years) |
| Chlorine feedstock regulatory risk (MDI/TDI) | -0.6% | EU first, expanding worldwide | Long term (≥ 4 years) |
| Source: Mordor Intelligence | |||
Automotive Production Volatility
Fluctuating vehicle output is disrupting supply-chain planning for resin suppliers and molders. Covestro’s 2023 sales slipped 20% to EUR 14.4 billion as lower automotive demand translated into weaker order volumes. SGL Carbon reported revenue pressure when long-running composite contracts expired ahead of replacement programs. The pivot to electric vehicles adds forecasting uncertainty because legacy internal-combustion platforms and next-generation EV architectures call for different material sets[1]OECD, “Transforming the Automotive Value Chain,” oecd.org.
High Carbon/PU Composite Fabrication Costs
Energy-intensive carbon fiber and multimaterial press lines elevate capital and operating costs, inhibiting large-scale replacement of glass fiber in cost-sensitive segments. Oak Ridge National Laboratory raised mechanical strength 50% through nanofiber reinforcement, but complex processing requirements threaten economies of scale. Direct Sandwich Composite Molding can streamline carbon sandwich structures, yet it demands new presses and automation that many tier suppliers cannot afford. Defect mitigation for highly filled compounds also lengthens production cycles and raises scrap rates, eroding price competitiveness.
*Our forecasts treat driver/restraint impacts as directional, not additive. The impact forecasts reflect baseline growth, mix effects, and variable interactions.
Segment Analysis
By Fiber Type: Carbon Acceleration Despite Glass Dominance
Glass fiber held 59.12% of revenue in 2025 on the strength of mature supply lines and cost efficiency across automotive, construction, and marine applications. Carbon fiber is set to grow at 6.21% CAGR, outpacing the overall polyurethane composites market as aerospace rebound and wind blade scaling raise demand for superior stiffness-to-weight ratios. The polyurethane composites market size for carbon fiber applications is projected to widen substantially as Vestas adopts Dow’s spar cap technology in next-generation turbines.
The scale advantages of glass fiber should keep it entrenched in cost-sensitive transportation and building parts even as carbon solutions penetrate premium segments. Manufacturers are exploring Surface-Modified roving to enhance adhesion with non-isocyanate resins, which could sustain glass volumes despite tightening VOC rules.


By Resin Type: Thermoset Polyurethane’s Dual Leadership
Thermoset formulations commanded 60.00% of global volume in 2025 and are tracking a 6.55% CAGR owing to their rapid infusion kinetics and high damage tolerance. Covestro reports that wind blade makers can shave 10-15% from total manufacturing cost by switching from epoxy to polyurethane resin because of faster line speeds and lower heat budgets. The polyurethane composites market size for thermoset systems in wind energy alone is forecast to expand materially through 2031 as megawatt turbines proliferate.
Advances in shape-memory polyurethane foils and self-healing chemistries suggest growing functional diversity within thermoset offerings. Segment leaders are also integrating flame-retardant additives to meet battery safety codes without halogens, bolstering adoption in electric-vehicle enclosures. Collectively, the dual dominance of thermoset polyurethane reflects its mechanical strength advantages while emerging thermoplastic and bio-based pathways support circular-economy commitments.
By End-User Industry: Transportation Leadership with Wind Energy Acceleration
Transportation held 34.20% of demand in 2025, cementing its role as the largest revenue generator within the polyurethane composites market. Automakers employ the material in structural reinforcements, underbody shields, and battery cases to offset the mass of electric drivetrains and comply with fleet emissions caps. Marine builders use polyurethane sandwich decks that resist water ingress and fatigue. Building and construction segments benefit from thermal-insulated panels that meet stricter energy codes, although growth is moderate relative to mobility-driven volumes.
Wind energy is the fastest growing end-user and is tracking a 7.05% CAGR to 2031 as nations expand renewable capacity commitments. The polyurethane composites market share of wind applications is widening as turbine OEMs adopt polyurethane systems for spar caps and nacelle covers to shorten production cycles. Electrical and electronics manufacturers leverage the resin’s dielectric strength to encapsulate sensitive boards, while sports equipment brands embed polyurethane cores for impact damping.
Geography Analysis
Asia Pacific dominated the polyurethane composites market with 52.30% of global revenue in 2025 and is expected to climb at a 7.25% CAGR through 2031. China and India drive volumes through automotive assembly expansion and wind farm construction, while Southeast Asia boosts propylene glycol and specialty amine capacities to feed resin plants.
North America retains a substantial footprint due to aerospace, defense, and high-value automotive programs. Policy incentives for clean energy projects spur additional wind blade and battery-component fabrication across the United States. Europe’s trajectory is shaped by rigorous chemical regulations and aggressive renewable-energy targets. REACH restrictions on diisocyanates are pushing formulators to low-monomer and bio-derived routes, streamlining a green transition that amplifies polyurethane composite usage in circular applications

Competitive Landscape
The polyurethane composites market remains moderately fragmented. Global chemical majors BASF, Covestro, Dow, and Huntsman combine backward integration in MDI/TDI, polyols, and additives with regional technical centers that aid processors in cycle-time optimization and emissions compliance. Specialist compounders focus on application niches such as high-temperature battery protection, isocyanate-free systems, and sports-equipment laminates.
Polyurethane Composites Industry Leaders
BASF
Covestro AG
Huntsman International LLC
TORAY INDUSTRIES, INC.
Dow
- *Disclaimer: Major Players sorted in no particular order

Recent Industry Developments
- December 2024: BASF raised US-produced polyurethane system prices containing alkyl phosphate esters, citing higher raw-material costs after anti-dumping duties on Chinese imports became effective on 27 November 2024.
- October 2024: Lubrizol introduced four ESTANE RNW biomass-balance TPU grades that cut cradle-to-gate carbon footprints by up to 59%, reflecting mounting brand-owner demand for quantified climate benefits.


Global Polyurethane Composites Market Report Scope
The Polyurethane Composites Market report includes:
| Glass |
| Carbon |
| Others |
| Thermoset PU |
| Thermoplastic PU |
| Bio-based PU |
| Transportation |
| Building and Construction |
| Electrical and Electronics |
| Wind Energy |
| Sports and Recreation |
| Others |
| Asia-Pacific | China |
| India | |
| Japan | |
| South Korea | |
| Rest of Asia-Pacifc | |
| North America | United States |
| Canada | |
| Mexico | |
| Europe | Germany |
| United Kingdom | |
| France | |
| Italy | |
| Rest of Europe | |
| South America | Brazil |
| Argentina | |
| Rest of South America | |
| Middle-East and Africa | Saudi Arabia |
| South Africa | |
| Rest of Middle-East and Africa |
| By Fiber Type | Glass | |
| Carbon | ||
| Others | ||
| By Resin Type | Thermoset PU | |
| Thermoplastic PU | ||
| Bio-based PU | ||
| By End-User Industry | Transportation | |
| Building and Construction | ||
| Electrical and Electronics | ||
| Wind Energy | ||
| Sports and Recreation | ||
| Others | ||
| By Geography | Asia-Pacific | China |
| India | ||
| Japan | ||
| South Korea | ||
| Rest of Asia-Pacifc | ||
| North America | United States | |
| Canada | ||
| Mexico | ||
| Europe | Germany | |
| United Kingdom | ||
| France | ||
| Italy | ||
| Rest of Europe | ||
| South America | Brazil | |
| Argentina | ||
| Rest of South America | ||
| Middle-East and Africa | Saudi Arabia | |
| South Africa | ||
| Rest of Middle-East and Africa | ||


Key Questions Answered in the Report
What is the current value of the polyurethane composites market?
The market stands at USD 0.91 billion in 2026 and is projected to reach USD 1.17 billion by 2031.
Which region leads global demand for polyurethane composite materials?
Asia Pacific holds 52.30% of global revenue in 2025 and is also projected to be the fastest growing region at 7.25% CAGR through 2031.
Why are polyurethane composites popular in wind-energy applications?
Rapid blade length scaling demands high stiffness and fast processing, both of which polyurethane resin systems provide more cost-effectively than traditional epoxy alternatives.
How do regulatory changes in the EU affect polyurethane composite producers?
The REACH cap on diisocyanate content above 0.1% pushes manufacturers toward bio-based or non-isocyanate chemistries and increases investment in worker training for safe handling.
Which resin type dominates the polyurethane composites market?
Thermoset polyurethane holds 60.00% of revenue and is growing at 6.55% CAGR due to mechanical strength and faster cycle times in automotive and wind-blade production.
Page last updated on:


