X-ray Machine Manufacturing Market Size and Share
Market Overview
| Study Period | 2020 - 2031 |
|---|---|
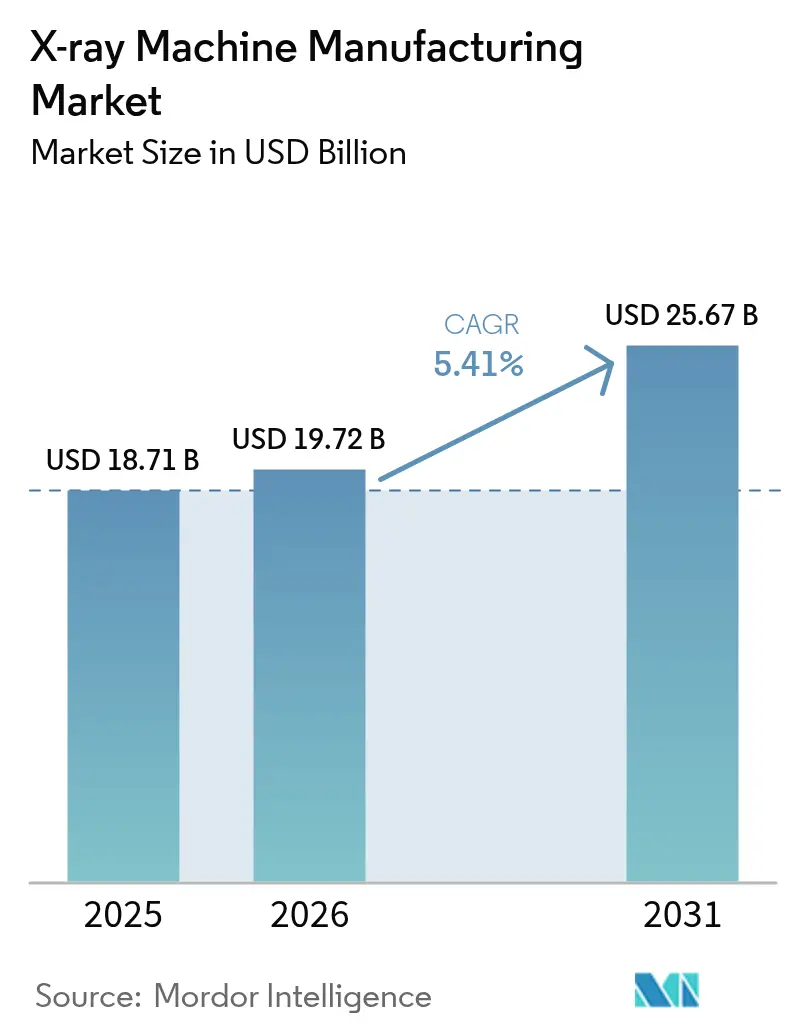
| Market Size (2026) | USD 19.72 Billion |
| Market Size (2031) | USD 25.67 Billion |
| Growth Rate (2026 - 2031) | 5.41% CAGR |
| Fastest Growing Market | Asia Pacific |
| Largest Market | North America |
| Market Concentration | Medium |
Major Players*Disclaimer: Major Players sorted in no particular order Image © Mordor Intelligence. Reuse requires attribution under CC BY 4.0. | |
X-ray Machine Manufacturing Market Analysis by Mordor Intelligence
The X-Ray Machine Manufacturing market size was valued at USD 18.71 billion in 2025 and estimated to grow from USD 19.72 billion in 2026 to reach USD 25.67 billion by 2031, at a CAGR of 5.41% during the forecast period (2026-2031). Steady expansion reflects sustained hospital demand, accelerating adoption of digital systems, and an AI-enabled shift toward predictive diagnostics. Digital platforms account for 78% of installed systems in 2024, and their network-ready architectures keep replacement cycles brisk while unlocking software-based revenue streams. Portable units gain favor among emergency and community providers because cordless designs shorten imaging turnaround times and contain infection-control risks. Chronic-disease screening programs, especially for diabetes and cardiovascular conditions, generate recurring imaging volumes that bolster equipment utilization. Simultaneously, aviation and border-security agencies broaden procurement budgets for high-energy scanners, giving manufacturers a second growth pillar outside clinical care.
Key Report Takeaways
- By technology, digital X-ray captured 77.20% of the X-Ray Machine Manufacturing market share in 2025; the same segment is advancing at a 6.05% CAGR through 2031.
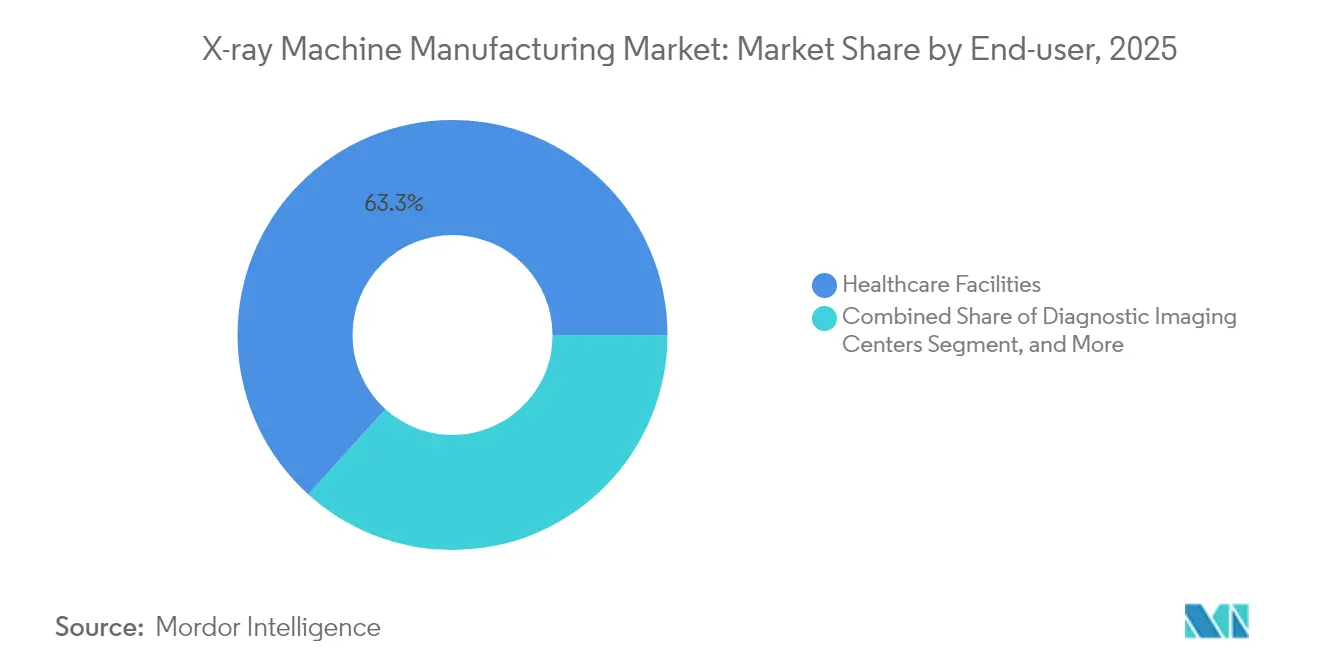
- By end user, hospitals held 63.30% of the X-Ray Machine Manufacturing market size in 2025, while diagnostic imaging centers are projected to expand at a 6.95% CAGR.
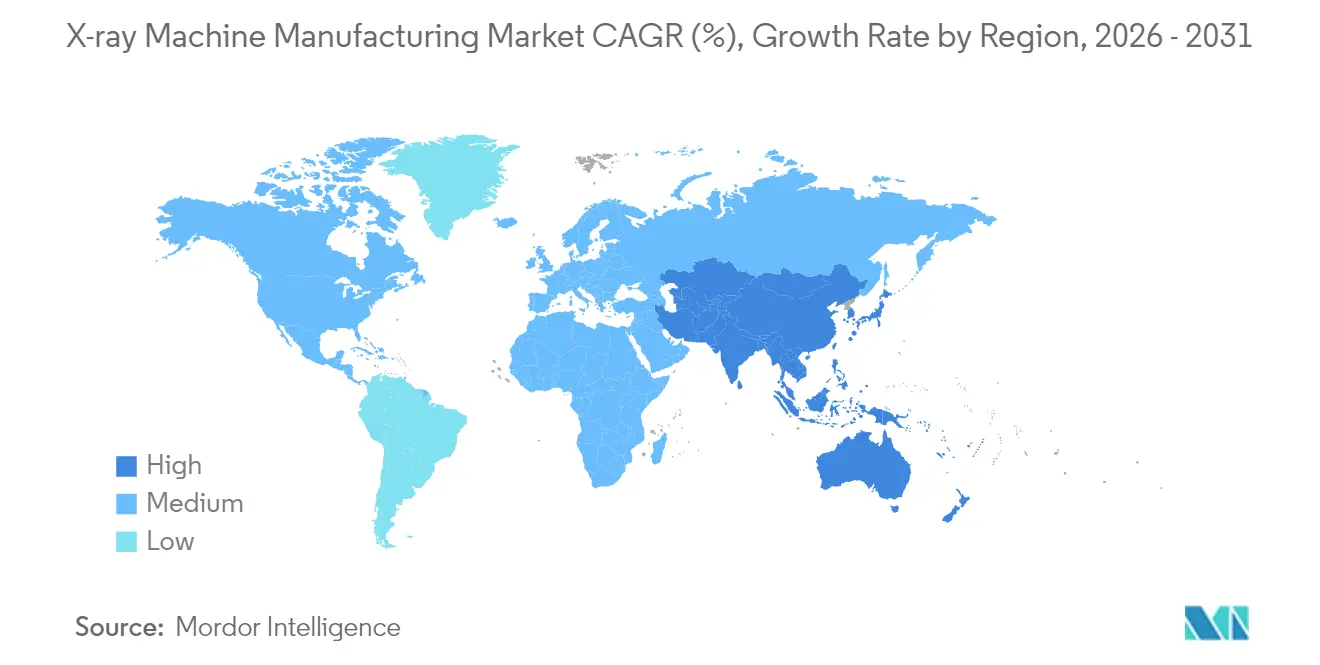
- By geography, North America controlled 51.40% revenue share of the X-Ray Machine Manufacturing market in 2025; Asia-Pacific is set to record a 6.03% CAGR to 2031.
- By application, medical imaging represented 70.30% of the X-Ray Machine Manufacturing market size in 2025, whereas security screening leads growth at a 5.98% CAGR.
- By geography, North America represented 51.40% of the market size in 2025, whereas Asia-Pacific leads growth with a 6.03% CAGR.
Note: Market size and forecast figures in this report are generated using Mordor Intelligence’s proprietary estimation framework, updated with the latest available data and insights as of 2026.
Global X-ray Machine Manufacturing Market Trends and Insights
Drivers Impact Analysis*
| Driver | (~) % Impact on CAGR Forecast | Geographic Relevance | Impact Timeline |
|---|---|---|---|
| Rise in adoption of digital X-ray systems | +1.2% | Global – accelerated uptake in Asia-Pacific and Middle East and Africa | Medium term (2-4 years) |
| Growing prevalence of chronic diseases requiring imaging | +1.0% | North America and Europe aging cohorts | Long term (≥ 4 years) |
| Government funding to upgrade radiology infrastructure | +0.8% | Asia-Pacific core, spill-over to Middle East and Africa and Latin America | Short term (≤ 2 years) |
| Rising demand for point-of-care and portable imaging | +0.9% | Global, earliest adoption in developed economies | Medium term (2-4 years) |
| Expansion of security-screening investments | +0.6% | Airports, ports, and border posts in North America, Europe, and Gulf Cooperation Council states | Short term (≤ 2 years) |
| Healthcare-modernization tied to medical-tourism growth | +0.5% | Emerging hubs in Southeast Asia and Middle East | Medium term (2-4 years) |
| Source: Mordor Intelligence | |||
Rise in Adoption of Digital X-ray Systems
Hospitals and ambulatory centers now value digital radiography less for image clarity and more for its interoperability with clinical AI platforms. GE HealthCare and NVIDIA launched a program in March 2025 that trains algorithms directly on detector-level data to flag abnormalities during acquisition, trimming radiologist reading queues, and elevating diagnostic consistency.[1]GE HealthCare, “GE HealthCare and NVIDIA Announce Strategic Collaboration for AI-Powered Medical Imaging,” gehealthcare.com Integrated analytics also automate radiation-dose tracking, a feature that meets emerging compliance mandates in Europe and North America. Because software can be upgraded remotely, facilities extend equipment life while layering new clinical functions, turning capital assets into evolving decision-support hubs. Those network effects accelerate digital replacement even in markets where analog systems have not yet reached end-of-life.
Growing Prevalence of Chronic Diseases Requiring Diagnostic Imaging
Incidence of diabetes, heart failure, and oncology cases in aging populations lifts routine radiography volumes, shifting imaging economics from episodic to subscription-like revenue. Preventive-care pathways require chest, extremity, and vascular follow-ups at predefined intervals, and payors increasingly reimburse for low-dose modalities that detect pathologies before symptom onset. Portable generators paired with flat-panel detectors let clinics move diagnostics closer to primary-care sites, cutting patient travel and supporting same-visit treatment planning. Early findings lower hospitalization rates, freeing system resources—outcomes that justify ongoing investment in point-of-care devices by public insurers across Canada, Japan, and several EU states.
Government Funding to Upgrade Radiology Infrastructure
Sovereign stimulus packages earmarked for smart-hospital construction have quickened procurement cycles, particularly across Southeast Asia. Victoria, Australia, allocated AUD 105 million (USD 71.3 million) in 2024 to refresh imaging suites, and tender specifications required dose-management dashboards and AI-ready architectures. Similar programs in Indonesia, Thailand, and the Philippines mandate local service partnerships, giving global OEMs incentives to set up regional training centers. Grants often bundle technician reskilling, which raises staffing capabilities and ensures sustainable throughput, reinforcing the business case for higher-end digital models.
Rising Demand for Point-of-Care and Portable Imaging
The January 2025 FDA clearance of OXOS Medical’s battery-powered handheld X-ray illustrates how miniaturization conquers longstanding mobility barriers. Cordless operation eliminates trip-hazard cables and simplifies infection-prevention protocols, making the units attractive in trauma bays and neonatal wards. Bedside exams shorten patient transfer times and increase ICU capacity, benefits that health-system administrators translate into measurable cost savings. For rural regions, backpack-sized scanners facilitate outreach programs where full radiology suites are impractical, broadening addressable populations for OEMs.
Restraints Impact Analysis*
| Restraint | (~) % Impact on CAGR Forecast | Geographic Relevance | Impact Timeline |
|---|---|---|---|
| High capital cost of X-ray machines | -0.7% | Emerging markets and independent outpatient sites | Long term (≥ 4 years) |
| Radiation-dose safety regulations | -0.4% | Developed regions with rigorous enforcement | Medium term (2-4 years) |
| Supply-chain vulnerability for flat-panel detectors | -0.3% | North America and Europe dependence on single-source semiconductor fabs | Short term (≤ 2 years) |
| Limited digital infrastructure in low-resource settings | -0.2% | Rural areas across Sub-Saharan Africa and parts of South Asia | Long term (≥ 4 years) |
| Source: Mordor Intelligence | |||
High Capital Cost of X-ray Machines
Comprehensive lifetime expenses—purchase price, site retrofits, shielding, staff training, and multiyear service contracts—can double the sticker cost that buyers initially budget. Smaller clinics in Latin America and Africa therefore negotiate leasing or revenue-share arrangements where payments align with scan volumes. Vendors answer with modular consoles whose detector arrays and software can be added over time, lowering day-one outlays without sacrificing future scalability. Cloud-based analytics further reduce on-site IT spend, yet reliance on subscription fees lengthens ROI horizons, tempering uptake in resource-constrained settings.
Radiation-Dose Safety Regulations
The FDA’s 2024 performance-standard update compels manufacturers to document dose-reduction algorithms and automatic exposure controls during pre-market review. EU MDR rules impose parallel obligations, adding conformity-assessment audits that extend launch timelines. Compliance drives R&D toward higher-sensitivity scintillators and noise-reduction software, but these innovations elevate bill-of-materials costs. Firms that certify early gain a marketing edge, whereas late adopters must discount legacy inventory that lacks built-in dose tracking, eroding margins.
*Our forecasts treat driver/restraint impacts as directional, not additive. The impact forecasts reflect baseline growth, mix effects, and variable interactions.
Segment Analysis
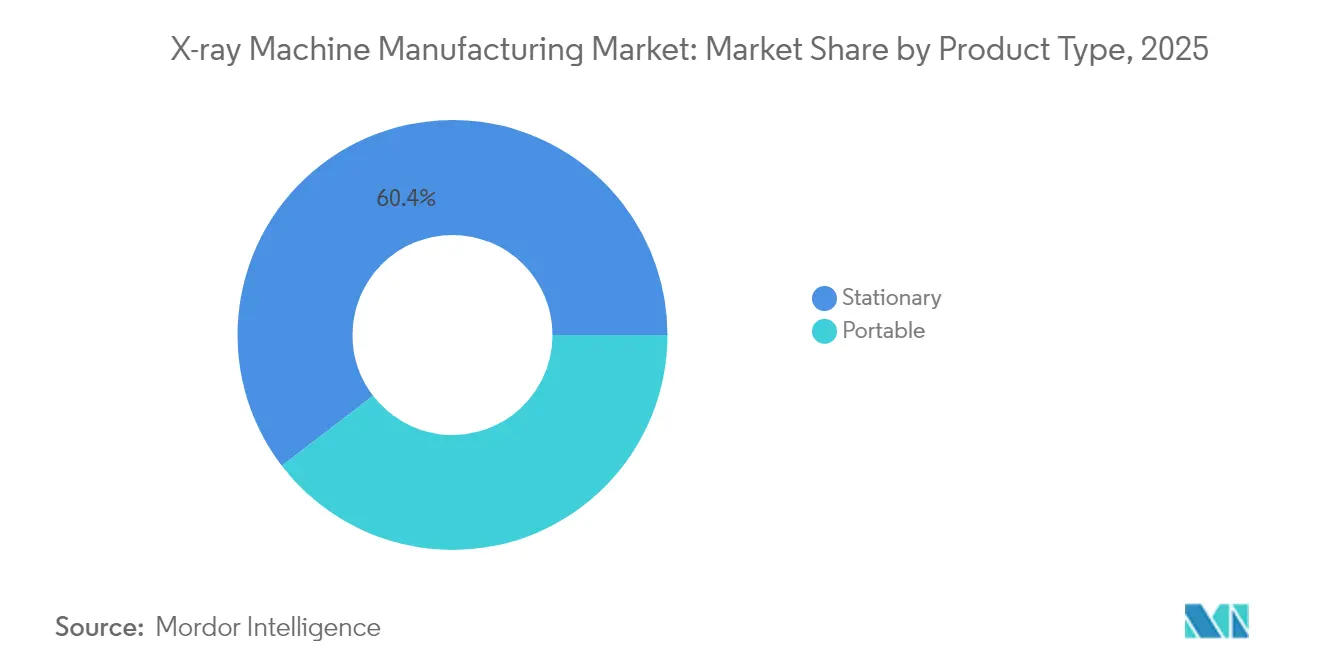
By Product Type: Portable Systems Reshape Diagnostic Workflows
Stationary rooms still commanded 60.40% of the X-Ray Machine Manufacturing market in 2025, reflecting entrenched investments in tertiary hospitals. Yet portable units are forecast to post a 5.62% CAGR as health networks pivot to decentralized models. Emergency departments cite 30-minute reductions in door-to-diagnosis times after deploying battery-powered carts that interface seamlessly with electronic health records. The segment’s uplift raises its portion of the X-Ray Machine Manufacturing market size by 2031, narrowing the gap with traditional installations.
Performance parity between high-end portables and mid-tier fixed systems continues to improve. Siemens Healthineers’ Luminos Q.namix delivers digital subtraction angiography on wheels, supporting vascular interventions outside cath labs. Service providers running mobile imaging fleets leverage telemaintenance dashboards to predict tube replacements, extending asset life. In rural India, public-private partnerships finance truck-mounted radiography vans that cover multiple villages daily, boosting rural screening rates and feeding referral pipelines for district hospitals.


By Technology: Digital Dominance Spurs Continuous Upgrades
Digital modalities already hold 77.20% share yet are still anticipated to climb thanks to iterative software enhancements that add clinical value without hardware swaps. AI modules that triage pneumothorax or COVID-19 pathology splice directly into picture-archiving systems, and pay-per-use licensing helps facilities control operating costs. Conversely, analog systems linger in budget-restricted community clinics, but shrinking spare-part availability accelerates their retirement trajectory.
Manufacturers bundle analytics that convert detector metadata into radiation-dose dashboards, satisfying stricter exposure reporting mandates in California and the EU. Cloud integration enables multi-site image pooling, facilitating subspecialty teleconsults that were difficult with film or computed radiography. Because datasets grow exponentially, vendors differentiate on cybersecurity and DICOM-compression algorithms, compelling hospitals to favor platform continuity during procurement cycles.
By End User: Diagnostic Imaging Centers Challenge Hospital Primacy
Hospitals own 63.30% of 2025 placements, underpinned by emergency coverage obligations and cross-specialty procedure volumes. However, independent diagnostic imaging chains are projected to outpace all other segments at 6.95% CAGR. These centers optimize throughput with extended hours and online scheduling, capturing commercially insured patients seeking rapid results. Investment groups funnel capital into green-field facilities adjacent to outpatient surgical hubs, where immediate post-op imaging is mandated for discharge clearance.
Cost discipline drives centers to favor mid-range digital units with AI decision support instead of premium interventional suites. That strategy delivers double-digit EBITDA margins, encouraging roll-ups that achieve purchasing clout on consumables and service contracts. Hospitals respond by re-engineering workflows around same-day imaging to deter referral leakage, spotlighting a competitive dynamic that sustains equipment refresh demand across both customer categories.
By Application: Security Screening Supplies a Second Growth Engine
Medical imaging remained dominant at 70.30% of 2025 revenue, but security screening outstripped every other niche with a 5.98% CAGR trajectory. Post-pandemic air-travel rebounds compelled airport authorities to upgrade legacy carry-on scanners for higher item-throughput speeds. Ports and border checkpoints adopt dual-energy systems that discern contraband in dense cargo pallets, broadening civil-security procurement.
Industrial inspection also climbs as EV battery makers use micro-focus tubes to detect dendrite formation in lithium-ion cells. Strict FDA quality rules for Class III medical devices drive similar uptake in U.S. clean-rooms. Dental imaging, though comparatively modest, maintains predictable replacement cycles due to infection-control and patient-comfort innovations, giving suppliers a stable baseline during macroeconomic swings.
Geography Analysis
North America retained 51.40% of global revenue in 2025, buoyed by high per-capita healthcare spend and early AI adoption mandates from integrated delivery networks. NYC Health and Hospitals committed USD 224 million to replace 230 radiography suites, underscoring the region’s sizable recurring-upgrade market. Cloud teleradiology hubs in the United States accelerate demand for detector formats compatible with remote reads, reinforcing vendor lock-in and extension contracts.
Asia-Pacific records the fastest 6.03% CAGR, propelled by China’s localization incentives that reduce import tariffs for domestically assembled detectors. India’s National Health Mission subsidizes mobile vans in tier-2 cities, widening access and seeding long-term equipment-service relationships. Japan confronts rising geriatric imaging loads, spurring community hospitals to invest in radiation-dose audit software embedded within new DR consoles.
Europe shows steady equipment turnover as the EU Recovery and Resilience Facility channels EUR 2.6 billion into Italy’s diagnostic modernizations. Dose-regulation rigor here inspires high adoption of automatic exposure control, benefiting premium detector suppliers. The Middle East and Africa begin hospital-cluster programs that bundle imaging with oncology centers, offering fresh territory to mid-price OEMs. Gulf states’ medical-tourism aspirations likewise favor AI-ready platforms that align with Western accreditation standards.

Competitive Landscape
Sector concentration is moderate, with five multinationals controlling just over two-thirds of revenue. GE HealthCare leverages its Edison platform to embed AI across detector ranges, while Siemens Healthineers capitalizes on service contracts piggybacking its Atellica diagnostics footprint. Canon Medical Systems’ April 2025 China initiative combines on-shore R&D with component localization to hedge geopolitical supply risks and secure provincial tenders. Varex Imaging, dominant in flat-panel detectors, cut unit costs via process tweaks unveiled in February 2025, enabling OEM partners to sharpen price-to-performance ratios.
Start-ups attack niche pain points: OXOS Medical eliminates power cords for true handheld mobility, and Polish firm SmartSoft delivers AI bone-age assessment modules that retrofit into existing PACS. Strategic M&A remains service-centric; Shimadzu’s acquisition of California X-ray Imaging Services in April 2024 expanded its aftermarket network, capturing higher-margin maintenance revenue. Technology alliances cross-pollinate domains—Philips chose Microsoft Azure for cloud image analytics in October 2024, reflecting convergence between med-tech and hyperscale IT stack providers.
Price competition intensifies in Latin America and Southeast Asia where public tenders weigh total-cost-of-ownership metrics. Vendors bundle training and uptime-guarantee SLAs to differentiate beyond acquisition cost. Regulatory mastery continues to gate entry; companies with FDA 510(k) tracking proficiency and EU MDR evidence libraries command premium valuations, cementing their foothold as AI regulation tightens.
X-ray Machine Manufacturing Industry Leaders
Canon Inc
Fujifilm Holdings Corporation
GE HealthCare Technologies Inc.
Hitachi Ltd. (Hitachi Healthcare)
Hologic, Inc.
- *Disclaimer: Major Players sorted in no particular order


Recent Industry Developments
- April 2025: Canon Medical Systems announced a China strategy focused on expanded R&D and localized production.
- March 2025: GE HealthCare and NVIDIA entered a strategic collaboration to develop autonomous X-ray systems that integrate AI for automated acquisition and preliminary analysis.
- February 2025: Varex Imaging Corporation improved flat-panel detector manufacturing processes, enhancing image quality and lowering costs.
- January 2025: OXOS Medical received FDA clearance for its cordless portable X-ray system, enabling true bedside imaging.


Global X-ray Machine Manufacturing Market Report Scope
X-rays are a form of electromagnetic radiation with higher energy that can pass through most of the objects. As an x-ray is the most effective and conventional diagnostic tool, digitization in the x-ray has observed a strong position in diagnostic laboratories worldwide. The demand for x-ray machines is increasing in various verticals, like healthcare, security, etc. Compliance with security measures and the increasing government regulations to develop better security infrastructure are the factors expected to have a positive impact on the industry. The awareness of early disease detection and treatment is expected to augment the medical x-ray industry's growth.
The x-ray machine manufacturing market is segmented by product type (stationary and portable), by technology (digital and analog), by end-user (healthcare, transportation and logistics, government, and other end-users), and by geography (North America, Europe, Asia Pacific, Rest of the World).
The market sizes and forecasts are provided in terms of value in USD for all the above segments.
| Stationary |
| Portable |
| Analog |
| Digital |
| Hospitals |
| Diagnostic Imaging Centers |
| Dental Clinics |
| Orthopedic and Trauma Care Facilities |
| Aircraft Maintenance Facilities |
| Military Field Hospitals |
| Security Screening Units |
| Industrial and Manufacturing |
| Government and Security |
| Veterinary and Animal Care |
| Other End-user Industries |
| Medical Imaging |
| Non-destructive Testing and Inspection |
| Security Screening |
| Dental Imaging |
| North America | United States |
| Canada | |
| Europe | Germany |
| United Kingdom | |
| France | |
| Russia | |
| Rest of Europe | |
| Asia Pacific | China |
| Japan | |
| India | |
| South Korea | |
| Rest of Asia Pacific | |
| South America | Brazil |
| Argentina | |
| Rest of South America | |
| Middle East and Africa | Gulf Cooperation Council (GCC) |
| South Africa | |
| Rest of Middle East and Africa |
| By Product Type | Stationary | |
| Portable | ||
| By Technology | Analog | |
| Digital | ||
| By End-user Industry | Hospitals | |
| Diagnostic Imaging Centers | ||
| Dental Clinics | ||
| Orthopedic and Trauma Care Facilities | ||
| Aircraft Maintenance Facilities | ||
| Military Field Hospitals | ||
| Security Screening Units | ||
| Industrial and Manufacturing | ||
| Government and Security | ||
| Veterinary and Animal Care | ||
| Other End-user Industries | ||
| By Application | Medical Imaging | |
| Non-destructive Testing and Inspection | ||
| Security Screening | ||
| Dental Imaging | ||
| Geography | North America | United States |
| Canada | ||
| Europe | Germany | |
| United Kingdom | ||
| France | ||
| Russia | ||
| Rest of Europe | ||
| Asia Pacific | China | |
| Japan | ||
| India | ||
| South Korea | ||
| Rest of Asia Pacific | ||
| South America | Brazil | |
| Argentina | ||
| Rest of South America | ||
| Middle East and Africa | Gulf Cooperation Council (GCC) | |
| South Africa | ||
| Rest of Middle East and Africa | ||


Key Questions Answered in the Report
What is the projected value of the X-Ray Machine Manufacturing market by 2031?
Forecasts put the market at USD 25.67 billion in 2031, up from USD 19.72 billion in 2026, reflecting a 5.41% CAGR during the forecast period (2026-2031).
Which technology segment is growing fastest within the X-Ray Machine Manufacturing market?
Digital radiography registers the highest 6.05% CAGR because software updates, AI integration, and dose-management features extend hardware life cycles.
Why are portable X-ray systems gaining popularity?
Battery-powered and cordless designs reduce infection risk, allow bedside imaging, and cut emergency department turnaround times, driving a 5.62% CAGR for the segment.
Which is the fastest growing region in X-ray Machine Manufacturing Market?
Asia Pacific is estimated to grow at the highest CAGR over the forecast period (2026-2031).
Which region is expected to deliver the strongest growth?
Asia-Pacific leads with a 6.03% CAGR, supported by healthcare modernization funding in China and expanding medical-tourism hubs throughout Southeast Asia.
How do AI collaborations influence competitive dynamics?
Partnerships such as GE HealthCare with NVIDIA embed machine-learning algorithms at the detector level, differentiate product lines, and create recurring software revenue streams.
Page last updated on:


