
Market Overview
| Study Period | 2021 - 2031 |
|---|---|
| Market Size (2026) | USD 5.06 Billion |
| Market Size (2031) | USD 7.74 Billion |
| Growth Rate (2026 - 2031) | 8.84 % |
| Fastest Growing Market | Middle East and Africa |
| Largest Market | North America |
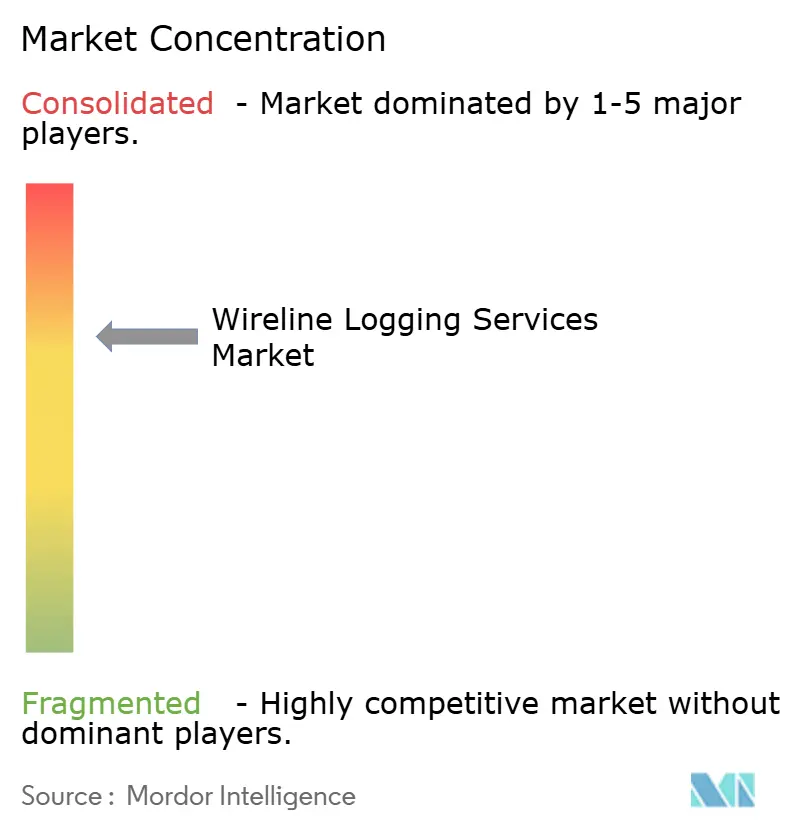
| Market Concentration | Medium |
Major Players *Disclaimer: Major Players sorted in no particular order Image © Mordor Intelligence. Reuse requires attribution under CC BY 4.0. | |
Wireline Logging Services Market Analysis by Mordor Intelligence
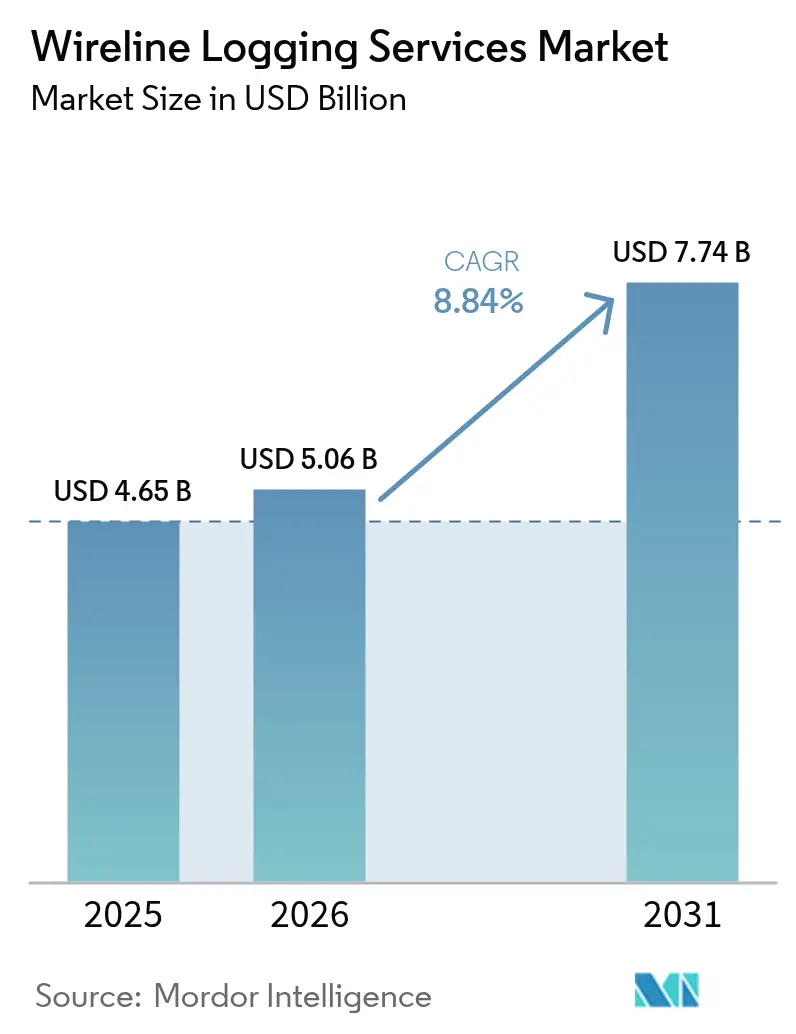
Wireline Logging Services Market size in 2026 is estimated at USD 5.06 billion, growing from 2025 value of USD 4.65 billion with 2031 projections showing USD 7.74 billion, growing at 8.84% CAGR over 2026-2031.
Opportunities expand as upstream capital spending rebounds in shale and deep-water plays, operators seek higher reservoir recovery, and digital telemetry trims non-productive time. Electric-line platforms equipped with advanced sensors speed up formation evaluation, while greaseless-coated wireline lowers health, safety, and environmental (HSE) compliance costs. North America leads due to prolific unconventional drilling, but the Middle East and Africa post the quickest gains as national oil companies modernize brownfield assets. Competitive intensity remains measured: established providers integrate artificial intelligence, fiber-optic sensing, and cloud-hosted analytics to defend their share against logging-while-drilling solutions.
Key Report Takeaways
- By wireline type, electric line captured 64.25% of the wireline logging services market share in 2025 and is on track for a 9.06% CAGR through 2031, reflecting customer preference for real-time digital data delivery.
- By hole type, cased-hole operations accounted for a 69.85% share of the wireline logging services market size in 2025 and are expected to expand at a 8.98% CAGR during the forecast period.
- By service phase, production and workover activities accounted for 47.10% of 2025 revenue and are projected to grow at a 9.34% CAGR to 2031.
- By application, well integrity diagnostics is the fastest-growing segment, with a 10.16% CAGR, driven by aging infrastructure and stricter environmental regulations.
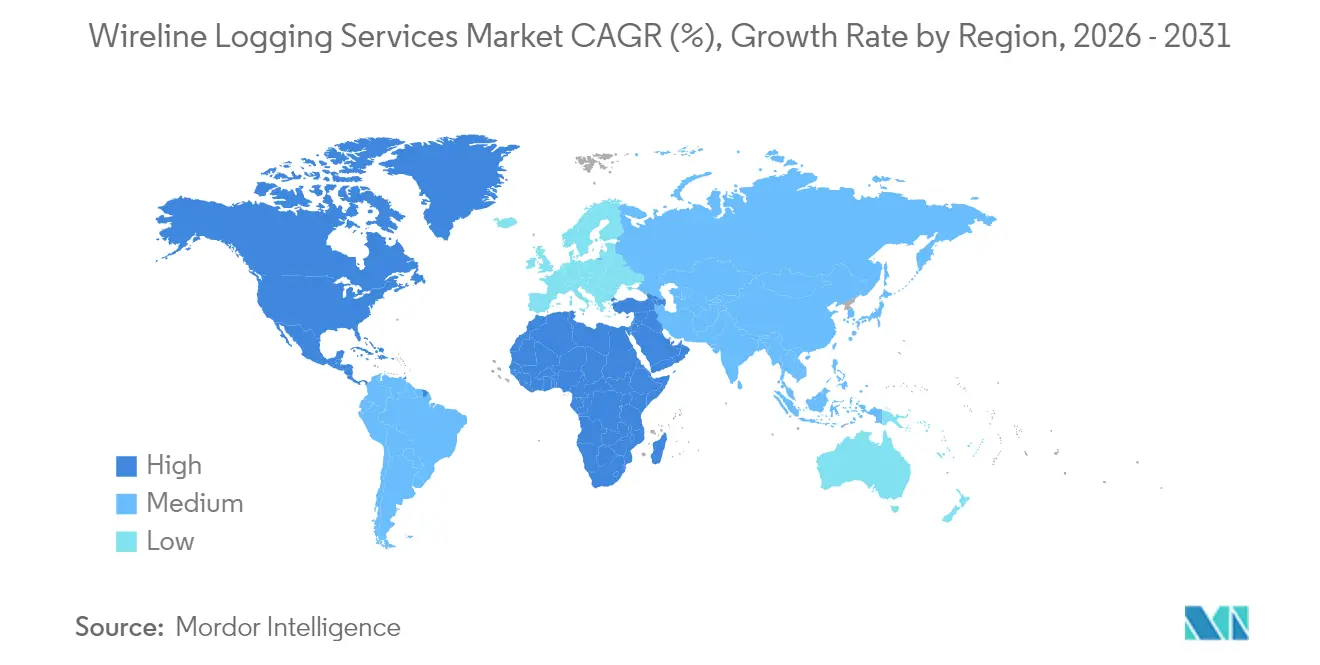
- By geography, North America led with 34.20% 2025 revenue, while the Middle East and Africa are set to grow the quickest at 9.44% CAGR through 2031.
Note: Market size and forecast figures in this report are generated using Mordor Intelligence’s proprietary estimation framework, updated with the latest available data and insights as of 2026.
Global Wireline Logging Services Market Trends and Insights
Drivers Impact Analysis*
| Driver | (~) % Impact on CAGR Forecast | Geographic Relevance | Impact Timeline |
|---|---|---|---|
| Upstream CAPEX rebound in shale and deep-water plays | +2.80% | North America and South America, spill-over to Middle East | Medium term (2-4 years) |
| Digital slickline and real-time cloud telemetry adoption | +1.90% | Global, early gains in North America and Europe | Short term (≤ 2 years) |
| Brown-field well-integrity programs in maturing basins | +1.60% | Global, concentrated in North America, Middle East, Europe | Long term (≥ 4 years) |
| Greaseless coated wireline cutting HSE compliance costs | +0.70% | Global, especially offshore and eco-sensitive areas | Medium term (2-4 years) |
| AI-enabled remote operations for multi-well logging | +1.20% | North America and Europe core, expanding to APAC and MEA | Short term (≤ 2 years) |
| Source: Mordor Intelligence | |||
Upstream CAPEX rebound in shale and deep-water plays
Stabilizing prices above USD 70 per barrel in 2024 revived drilling budgets, prompting US operators to allocate USD 60.1 billion in capital expenditures for unconventional and offshore projects in 2025. SLB secured a USD 800 million formation-evaluation contract for Brazil’s pre-salt, underscoring robust deep-water investment.(1)SLB, “Stream Real-Time Wireline Telemetry,” slb.com Shale producers increasingly order formation-pressure tests to fine-tune completion designs, linking wireline runs with hydraulic fracturing schedules for cost synergy. Argentina’s Vaca Muerta recorded 14,722 fracture stages in 2023, sustaining regional demand. These programs enhance spending on pressure, fluid sampling, and imaging services that enrich reservoir models and prolong well life.
Digital slickline and real-time cloud telemetry adoption
Service companies now stream continuous downhole data to cloud dashboards, cutting average logging time by 30% with systems such as SLB’s Stream and Halliburton’s LOGIX platform. Fiber-optic-enabled slickline delivers distributed temperature and acoustic sensing, merging mechanical intervention with diagnostics in a single run. Remote experts interpret logs from command centers, easing the restrictions posed by the scarcity of petrophysicists and travel limitations. Operators value near-instant answers that support on-the-fly decisions, so contracts increasingly specify telemetry-ready equipment. This shift differentiates suppliers and boosts uptake of premium service bundles despite price pressure.
Brown-field well-integrity programs in maturing basins
North Sea producers plan to drill 250 exploration wells and 600 development wells, which heavily rely on cased-hole cement evaluation and corrosion logs.(2)Fierce Network, “North Sea Well Plans 2025,” fiercenetwork.com Aging casings heighten leak risk, urging regulators to demand proof of barrier quality before plug-and-abandonment. Distributed fiber-optic sensing enables engineers to monitor temperature anomalies that precede tubular failure, allowing for proactive remediation. These diagnostics lengthen the productive life of late-stage assets and avert costly spills. Because many basins worldwide now host fields that are over 30 years old, integrity budgets remain resilient even in volatile price climates.
AI-enabled remote operations for multi-well logging
Machine-learning tools trained on historic log libraries predict lithology and fluid type, shrinking interpretation cycles from days to hours at ConocoPhillips’ Permian assets. Predictive maintenance models signal when tools require recertification, reducing downhole failures. Experienced analysts simultaneously supervise several rigs via real-time dashboards, addressing workforce aging where the average age tops 56 years. Integration of distributed acoustic sensing with AI enables pinpointing of fracture hit efficiency, guiding stage spacing, and proppant loading. These capabilities protect margins and let providers scale expertise across regions.
Restraints Impact Analysis*
| Restraint | (~) % Impact on CAGR Forecast | Geographic Relevance | Impact Timeline |
|---|---|---|---|
| Oil-price volatility curbing exploration budgets | -1.80% | Global, acute in North America shale | Short term (≤ 2 years) |
| Stricter discharge rules on logging fluids | -0.60% | Global offshore, notably North Sea and Gulf of Mexico | Medium term (2-4 years) |
| LWD displacing post-drill wireline runs | -2.10% | Global, deep-water and complex wells | Long term (≥ 4 years) |
| Shortage of petrophysicists for high-end interpretation | -0.90% | Global, severe in North America and Europe | Medium term (2-4 years) |
| Source: Mordor Intelligence | |||
Oil-price volatility curbing exploration budgets
WTI averaged USD 60.76 per barrel by May 2025, forcing US independents to trim 2025 capital by 4% to USD 60.1 billion. Saudi Aramco paused more than 20 jack-ups, signalling subdued near-term demand in the Gulf. When cashflow tightens, discretionary logs such as advanced imaging and fluid sampling are first deferred. Smaller firms bear the brunt since lenders favor minimal risk drilling. Consequently, service companies hedge by diversifying regionally and offering flexible pricing tied to commodity benchmarks.
LWD displacing post-drill wireline runs
Logging-while-drilling tools now deliver nuclear magnetic resonance, pressure testing, and even sampling in real time, avoiding separate wireline trips and saving rig hours.(3)OnePetro Library, “Comparative Assessment of LWD and Wireline Formation Testing,” onepetro.org In high-angle wells prone to sticking, operators prefer LWD to mitigate conveyance risk. Yet wireline retains an edge for cased-hole work, fine fluid analysis, and production profiling. Providers counter by packaging both services, selling logs as complementary rather than competing, and by enhancing cased-hole offerings that LWD cannot replicate.
*Our forecasts treat driver/restraint impacts as directional, not additive. The impact forecasts reflect baseline growth, mix effects, and variable interactions.
Segment Analysis
By Wireline Type: Electric line strengthens digital transformation
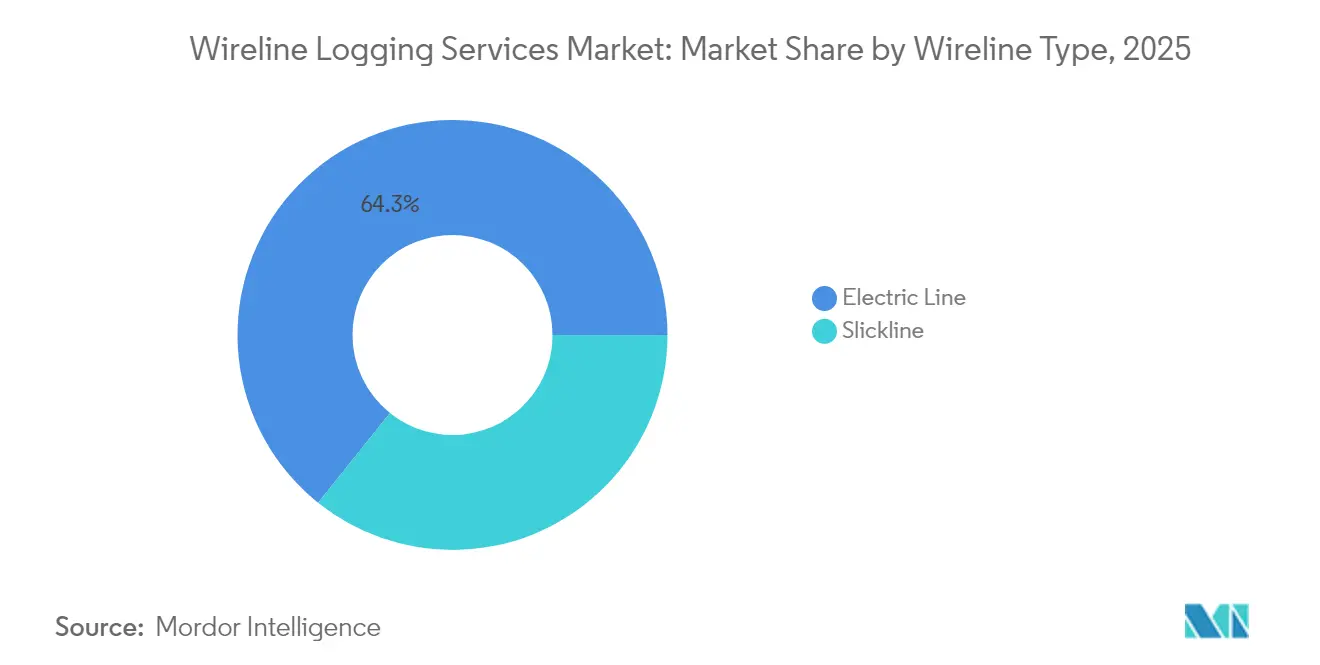
Electric-line services held 64.25% of the wireline logging services market in 2025 and are expected to expand at a 9.06% CAGR through 2031, as customers demand high-bandwidth telemetry and multi-sensor strings. The wireline logging services market size for electric-line platforms is projected to reach USD 4.97 billion by 2031, underscoring the richness of their data. Digital cables embed fiber for distributed sensing, enabling simultaneous formation evaluation and downhole monitoring, which trims rig time.
Slickline persists for mechanical tasks like setting plugs or fishing, but innovators such as Nine Energy’s EnviroLine greaseless wire lower environmental exposure and close the functionality gap. As technology converges, hybrid rigs quickly swap heads to deploy electric or slickline in a single run. This flexibility appeals to operators seeking operational efficiency without premium day rates, allowing both modalities to coexist.



By Hole Type: Cased hole reliability underpins demand
Cased-hole logs accounted for 69.85% of 2025 revenue and are projected to grow at a 8.98% CAGR to 2031, reflecting the continued dominance of production optimization and integrity mandates. The wireline logging services market size for cased-hole work is expected to exceed USD 5.41 billion by 2031, as mature wells proliferate. Applications span cement bond evaluation, corrosion mapping, and production profiling, all of which are vital to maintaining flow assurance.
Open-hole evaluation remains indispensable for new wells, yet occupies a lower share as global drilling rates lag workover programs. High-resolution micro-imagers and sonic tools enhance petrophysical models, while AI accelerates facies classification. Cross-hole data integration stitches together full-life-cycle reservoir views, boosting recovery strategies for both conventional and unconventional resources.
By Service Phase: Production and workover activities dominate workflows
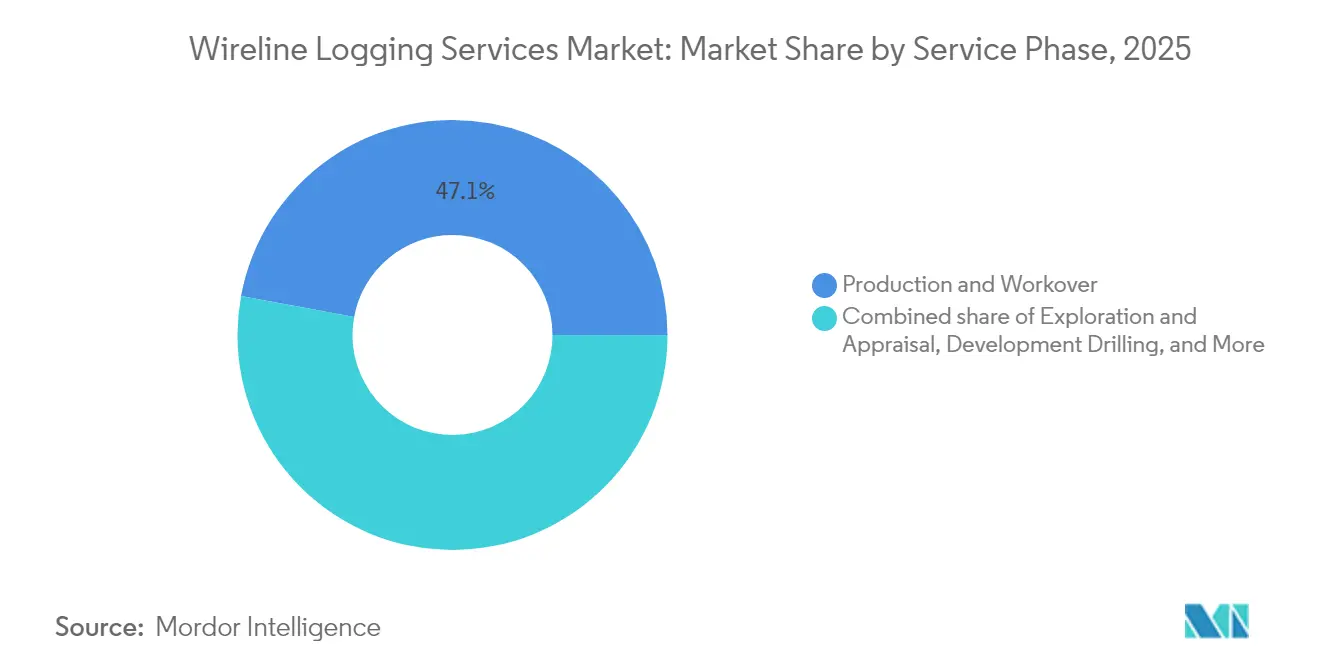
Production and workover captured 47.10% of 2025 revenue and is expected to rise at a 9.34% CAGR, driven by efforts to extract additional barrels from existing wells. They controlled the highest wireline logging services market share within service phases, reflecting immediate cash flow impact for operators. Advanced production logging combines multiphase flow and distributed acoustic sensing to identify water breakthrough early and guide artificial-lift tuning.
Development drilling remains the second-largest phase as horizontal wells require detailed geo-steering data. Exploration uses high-spec open-hole tools, but its proportion shrinks as companies favor low-risk infill drilling. Well abandonment forms a nascent niche: regulators now compel integrity logs before decommissioning, creating steady demand that offsets drilling cycles.
By Application: Well integrity diagnostics escalates
Formation evaluation dominated with a 34.70% 2025 share because every new well needs pore-pressure, porosity, and saturation insight. However, well integrity diagnostics is the quickest mover at 10.16% CAGR amid aging infrastructure. Its wireline logging services market share will approach 25.40% by 2031 as stakeholders intensify environmental oversight.
Production logging and remedial intervention continue to rise, buoyed by unconventional reservoirs that require continual surveillance. Mode-driven analytics merge logs, fiber, and surface data to deliver holistic well health dashboards. Vendors thus bundle multiple applications in subscription models, ensuring recurring revenue streams across the well lifecycle.
Geography Analysis
North America retained 34.20% of global revenue in 2025, driven by the proliferation of shale programs in the Permian and Eagle Ford. Producers earmarked USD 60.1 billion for 2025 capital expenditures, despite market swings, to sustain baseline demand for formation testing and production logs. Canada’s steam-assisted gravity drainage wells require high-temperature cables, while Mexico’s deep-water Gulf blocks adopt electric-line sampling to appraise complex carbonates. These drivers keep the wireline logging services market robust even when rig counts fluctuate.
The Middle East and Africa are projected to post the fastest 9.44% CAGR through 2031, as national oil companies modernize mature fields and advance deep-water prospects. Although Saudi Arabia has postponed some jack-ups, brownfield integrity checks, and Qatar’s North Field expansion still require advanced cased-hole logs. Nigeria and Angola pursue workovers on legacy subsea wells, demanding corrosion and cement evaluations that electric-line strings readily deliver. Regional uptake also grows for fiber-optic distributed sensing that supports gas-well integrity across sour reservoirs.
Europe shows mixed signals. Operators plan to drill 250 exploration and 600 development wells in the North Sea, but economic hurdles limit the frequency of drilling. Norway prioritizes premium integrity services to comply with stringent offshore regulations, and the UK is expected to record a 3% production uptick in 2025, which is likely to sustain service spending. Russia’s sector remains isolated; continental Europe channels funds into maximizing returns from mature onshore assets. Elsewhere, South America gains momentum from Brazil’s pre-salt awards and Argentina’s Vaca Muerta, while Asia-Pacific builds prospects across Indonesia and Australia, collectively widening the wireline logging services market footprint.

Regulatory Landscape
Wireline logging services operate under a tightening mix of offshore operational safety rules, production measurement standards, and radiation controls for nuclear logging tools. In the United States, the Bureau of Safety and Environmental Enforcement (BSEE) governs offshore oil and gas operations under 30 CFR Part 250, with inspection and execution detail reinforced through Subpart G B-PINCs (updated in January 2026) that set expectations around pressure testing and safety practices for well operations where wireline activities interface with barrier integrity.
Recent rulemaking and guidance increases the compliance load on service providers and operators by formalizing data and equipment expectations earlier in the well planning cycle. Canada-Nova Scotia and Canada-Newfoundland and Labrador offshore regulators updated their Data Acquisition Guideline in October 2024, including minimum resolution expectations for logging and formation evaluation programs, while BSEE issued rules that elevate requirements tied to deepwater and HPHT-related equipment submissions (effective October 2024) and later incorporated updated production measurement and safety standards into 30 CFR Part 250 (effective August 2026). Onshore, state-level radiation safety compliance remains critical for providers running radioactive sources in logging operations, exemplified by Texas updates to 25 TAC 289.253 taking effect in September 2025.
Competitive Landscape
The wireline logging services market features moderate concentration. Top players blend technology depth with global bases to defend contracts against niche upstarts. SLB’s USD 7.8 billion ChampionX purchase in July 2025 forged the largest integrated platform for digital wireline and production chemistry, deepening cross-sell opportunities. Halliburton’s ExpressFiber disposable fiber and Baker Hughes’ Ora intelligent tester lead differentiation in distributed sensing and real-time formation sampling. These innovations raise entry barriers as customers prefer one-stop solutions.
Mid-tier firms exploit regional links. Weatherford leverages Middle East relationships to secure workover contracts, while China Oilfield Services taps domestic demand as Beijing targets deep-water self-sufficiency. Superior Energy and Expro pioneer AI-driven remote operations to mitigate workforce shortages. Competitive focus shifts from pure tool horsepower to data insight and workflow integration, which reduces rig time.
Disruptive contenders specialize in machine-learning interpretation, automated conveyance robotics, and greaseless coated lines. Their offerings often integrate into larger players’ supply chains rather than displace them outright. Collaboration agreements proliferate, with majors licensing algorithms or sensor modules to enhance platform value. Consequently, the market balances scale economies against agile innovation, keeping pricing rational but service quality steadily rising.
Wireline Logging Services Industry Leaders
Schlumberger Limited
China Oilfield Services Limited
Weatherford International Plc.
Baker Hughes Co.
Halliburton Company
- *Disclaimer: Major Players sorted in no particular order

Market Opportunities and Future Outlook
A focus is emerging around higher-efficiency acquisition and interpretation workflows that reduce rig time while improving decision quality, especially in mature fields where integrity diagnostics and production and workover dominate activity. Real-time cloud telemetry and remote operations are already shortening logging cycle times, as reflected in the report context with SLB Stream and Halliburton LOGIX, and this is creating room for premium service bundles that combine high-bandwidth electric line, fiber-enabled sensing, and centralized interpretation to address the industry-wide scarcity of petrophysicists.
Autonomous and reduced-personnel logging is also becoming a clearer differentiation path in complex wells and high-cost offshore environments. SLB introduced its OnWave autonomous, cable-free logging platform (July 2025), which keeps circulation and drillpipe rotation during logging, aligning with operator priorities around non-productive time reduction and lower HSE exposure. On the demand side, national oil companies and large operators are using multi-year, multi-asset awards to scale advanced logging deployment: Baker Hughes signed multiple contracts with Indias ONGC in July 2026 covering advanced wireline logging and related services with a large equipment footprint (including 46 wireline units and 7 drill stem testing kits), and Halliburton launched the Xaminer Deep Testing Service in May 2026 for reservoir insight and boundary identification. Together, these actions point to opportunities for providers with high-spec toolstrings (including high-temperature and high-pressure capability), automation-ready surface systems, and integrated digital platforms that support remote supervision and standardized digital deliverables across geographies.
Recent Industry Developments
- July 2026: Baker Hughes signed multiple contract awards with Indias Oil and Natural Gas Corporation (ONGC) to deploy advanced wireline logging, perforating, and drill stem testing services across onshore, offshore, and deepwater assets. The scope included large-scale equipment deployment (46 wireline units and 7 drill stem testing kits), strengthening Bakers position in high-volume, NOC-led programs and increasing the installed base for premium digital workflows.
- July 2025: SLB introduced the OnWave autonomous logging platform, a cable-free system designed to maintain drillpipe rotation and mud circulation while acquiring logging data. The launch supports operators targeting lower non-productive time and reduced personnel exposure, and it raises the competitive bar for automation-enabled formation evaluation in complex well trajectories.
- November 2024: Halliburton advanced its high-speed telemetry offering with PulseStar, enabling continuous, real-time streaming of subsurface data during wireline runs. Faster data delivery supports remote interpretation models and strengthens differentiation for electric-line services where decision latency directly affects rig time and intervention planning.


Research Methodology Framework and Report Scope
Market Definition and Coverage
This market covers revenue earned from wireline logging services performed in a wellbore to measure and interpret subsurface and well conditions, using electric line or slickline conveyed tools. The sizing reflects paid service activity across onshore and offshore oil and gas wells.
Scope exclusions: It excludes sales of logging tools and surface units when sold as equipment only, plus non-wireline diagnostics done through LWD/MWD or standalone seismic surveys.
Segmentation Overview
- By Wireline Type
- Electric Line
- Slickline
- By Hole Type
- Open Hole
- Cased Hole
- By Service Phase
- Exploration and Appraisal
- Development Drilling
- Production and Workover
- Well Abandonment
- By Application
- Formation Evaluation
- Well Integrity Diagnostics
- Production Logging
- Intervention/Remedial Services
- By Geography
- North America
- United States
- Canada
- Mexico
- Europe
- Germany
- United Kingdom
- Norway
- NORDIC Countries
- Russia
- Rest of Europe
- Asia-Pacific
- China
- India
- South Korea
- ASEAN Countries
- Australia
- Rest of Asia-Pacific
- South America
- Brazil
- Argentina
- Colombia
- Rest of South America
- Middle East and Africa
- Saudi Arabia
- United Arab Emirates
- South Africa
- Nigeria
- Egypt
- Rest of Middle East and Africa
- North America
Data Sources, Market Sizing, and Validation
Desk Research
Desk research started with public indicators that explain how much well work is happening and where it is shifting. We relied on sources such as the US EIA for drilling and production trends, OPEC publications for supply outlook, and Baker Hughes for rig counts, which helped frame short-cycle activity.
To anchor service intensity, we also reviewed items like national petroleum regulator updates and licensing rounds, customs and trade statistics for oilfield equipment movements (as directional context), and peer reviewed petroleum engineering papers that describe logging practices by reservoir type. Company filings, investor decks, and reputable energy press were used to sanity check service mix changes and pricing direction. For paid inputs, we selectively referenced subscriptions covering company financials and intelligence, along with patent databases to track technology direction. The sources named above are illustrative only, and many other public and proprietary references were used to collect, validate, and clarify the dataset.
Primary Interviews and Surveys
Primary work focused on validating service scope, typical job counts per well phase, and how pricing moves with complexity and mobilization. We spoke with a mix of service-side and operator-side roles, then used follow-up checks across major producing basins so regional assumptions stayed aligned with real activity patterns.
Distribution of primary research fieldwork respondents
| Company type | Respondent position | Region |
|---|---|---|
| Top tier: 37% | CXOs: 16% | APAC: 51% |
| Mid tier: 44% | Functional/Unit leaders: 27% | EMEA: 30% |
| Smaller Players: 19% | Managers: 57% | Americas: 19% |
Market-Sizing & Forecasting
The market was first built using a top-down approach where drilling and completion activity, together with well phase level demand for formation evaluation and integrity checks, was translated into an addressable logging service pool by region. Once that structure was stable, selective bottom-up checks were used, such as sampled job counts by basin multiplied by typical pricing ranges, plus a light roll-up of service revenue where disclosure allowed it.
Key inputs that shaped the model (illustrative) included active rig counts, onshore versus offshore well share, proportion of open-hole versus cased-hole work, intervention frequency during production and workover, and the mix of electric line versus slickline service delivery. Pricing was treated carefully by separating day rates, mobilization charges, and tool string complexity, then applying realistic annual ASP progression rather than a flat inflation add-on. For forecasting, scenario analysis was used around upstream capex, sanctioning pace, and regional drilling outlook, and then the scenario weights were aligned to what experts described as most likely. Where bottom-up signals were thin in smaller basins, gaps were handled by using analog basins with similar well depth and completion style, then adjusted back using region-specific activity indicators.
Data Validation & Update Cycle
Validation was done by checking whether the modeled service demand moved in the same direction as independent signals like drilling counts, intervention trends, and regional production changes, and then investigating any break in the relationship. Outliers were reviewed in steps, starting with unit checks, followed by assumption reviews on pricing and service intensity, and then a second analyst review before sign-off.
Reports are refreshed on an annual cycle, while interim updates are made when material events occur, such as sharp oil price resets, major upstream capex changes, or step shifts in offshore activity. Before delivery, a final pass is completed so the outputs reflect the latest public data releases and recent interview feedback.
Mordor Intelligence's Wireline Logging Services Market Size Compared With Other Published Estimates
Published numbers for wireline logging services often do not match because the scope and counting logic can change across sources, and the differences are not always clearly stated. We see gaps most often when adjacent service lines are mixed in, or when pricing is treated as a single average across very different well types.
In practice, estimates spread when one publisher folds broader wireline services like intervention and completion into the total, or when industrial and non-oilfield uses are counted without being broken out. Another common driver is how the base year is picked and how currency conversion is timed, because a strong move in oil prices and activity can make one year look unusually high or low.
Benchmark comparison
| Source | Market Size | Gaps in Research Methodology |
|---|---|---|
| Mordor Intelligence | USD 5.06 B (2026) | |
| Industry Publisher A | USD 7.45 B (2025) | The estimate appears to use a different base year and may bundle a wider set of paid service activity beyond logging-only work, which can lift the total when intervention-linked jobs are included. |
| Global Research Group B | USD 11.14 B (2024) | This figure is materially higher, which is usually explained by broader scope that can extend into the wider wireline service stack and by using blended pricing across regions without clearly separating open-hole and cased-hole job mixes. |
The table shows that the spread is mainly driven by scope expansion and base-year timing, and then amplified by how pricing is averaged across well contexts. Keeping the model tied to drilling and well-phase demand signals, while counting revenue only for logging services performed via electric line and slickline, explains the lower but more traceable total used by Mordor Intelligence.


Key Questions Answered in the Report
What is the current size of the wireline logging services market?
The wireline logging services market size stood at USD 5.06 billion in 2026 and is projected to hit USD 7.74 billion by 2031.
Which region leads the wireline logging services market?
North America holds the lead with 34.20% 2025 revenue thanks to vigorous shale drilling and production optimization programs.
Which segment is growing the fastest within the market?
Well integrity diagnostics shows the highest pace at a 10.16% CAGR because operators must verify aging wells meet stricter environmental rules.
How will digital telemetry affect the wireline logging services industry?
Real-time cloud telemetry shortens logging cycles by up to 30%, enables remote supervision, and differentiates service providers offering high-bandwidth electric-line solutions.
What is the biggest restraint facing the market?
Growth is most constrained by logging-while-drilling’s ability to replace some post-drill wireline runs in complex wells, shaving 2.1% off forecast CAGR.
How concentrated is competition among service companies?
The market is moderately concentrated: the top five players account for about 60% of revenue, resulting in a concentration score of 6 yet still leaving room for regional specialists.
Page last updated on:





