
North America Wind Tower Market Size and Share
Market Overview
| Study Period | 2022 - 2032 |
|---|---|
| Forecast Data Period | 2027 - 2032 |
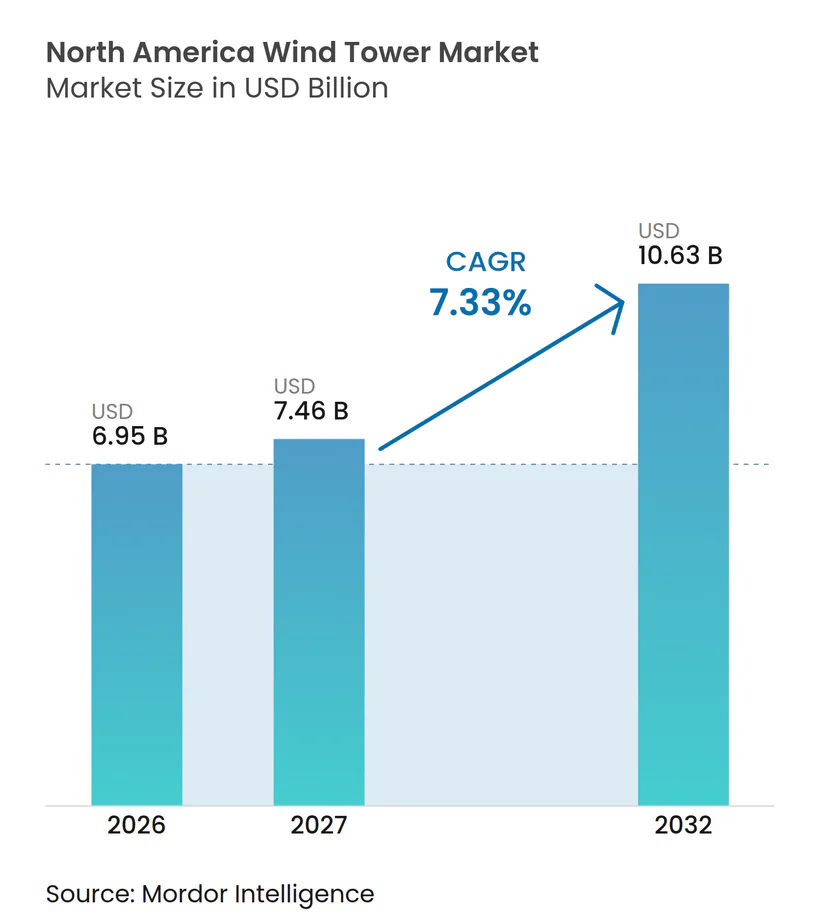
| Base Year Market Size (2026) | USD 6.95 Billion |
| Market Size (2027) | USD 7.46 Billion |
| Market Size (2032) | USD 10.63 Billion |
| Growth Rate (2027 - 2032) | 7.33 % |
| Market Concentration | Medium |
Major Players *Disclaimer: Major Players sorted in no particular order Image © Mordor Intelligence. Reuse requires attribution under CC BY 4.0. | |
North America Wind Tower Market Analysis by Mordor Intelligence
The North America Wind Tower Market size is projected to be USD 6.95 billion in 2026, USD 7.46 billion in 2027, and reach USD 10.63 billion by 2032, at a CAGR of 7.33% from 2027 to 2032. Domestic-content rules make locally fabricated towers important to projects seeking the applicable tax-credit bonus, while manufacturers must make capacity decisions within a limited policy window. Taller turbines are changing tower specifications because projects increasingly need designs that reach stronger wind resources above conventional hub heights. Offshore procurement and port investment can lift the value of individual tower packages, even while onshore projects remain the volume base. Permitting delays, grid constraints, steel costs, and transport limits can defer orders, although corporate power contracts linked to data-center demand support demand in several wind-rich areas. The North America Wind Tower Market, therefore, depends on whether suppliers can match more demanding tower designs with reliable local fabrication and delivery capacity.
Key Report Takeaways
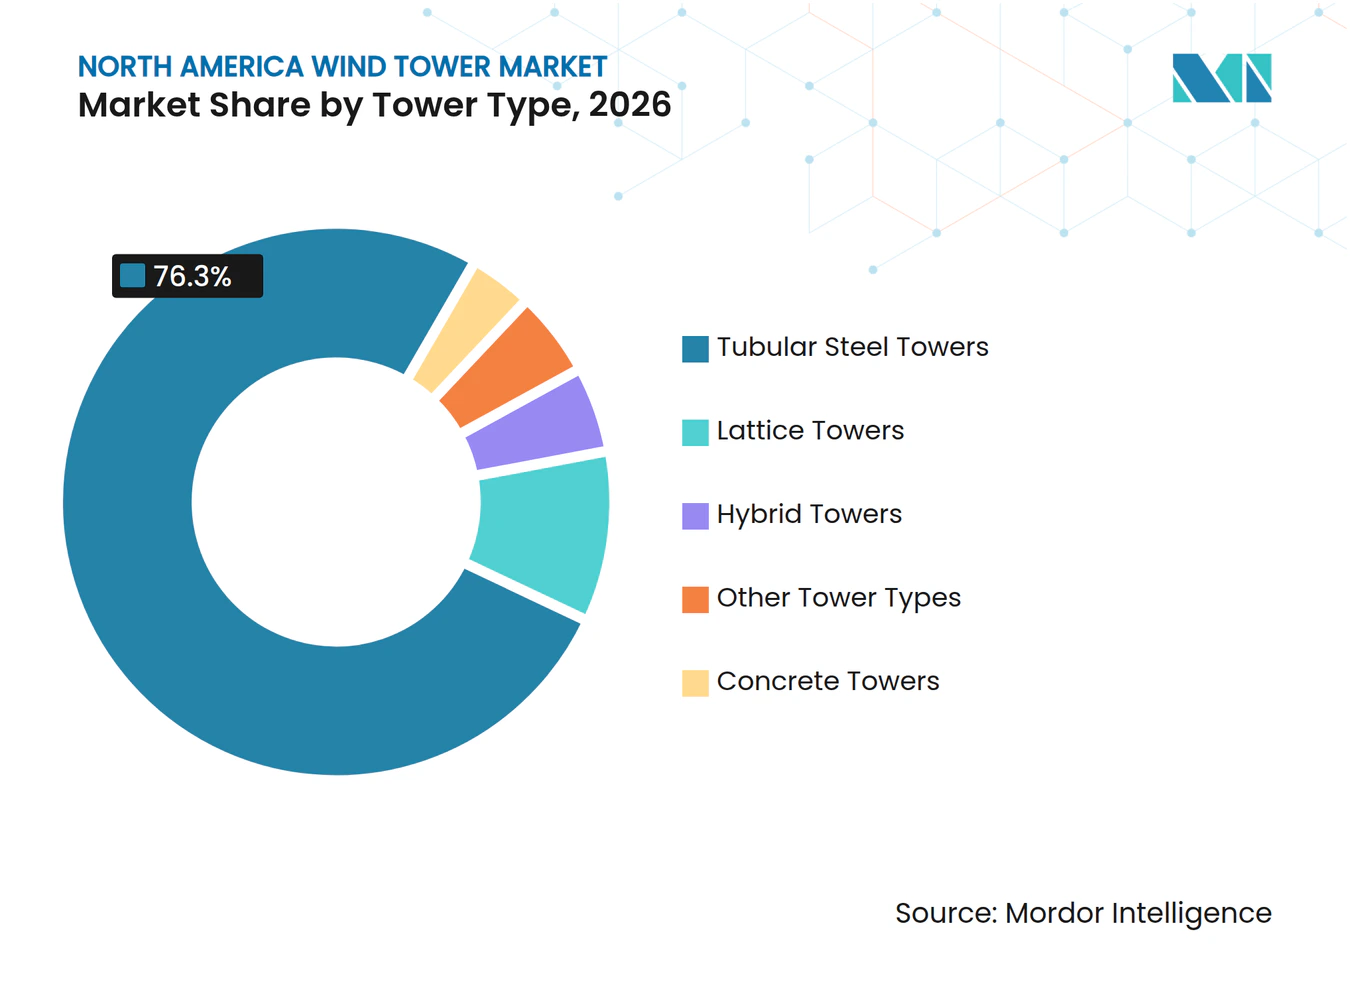
- By tower type, tubular steel held 76.3% of the North America Wind Tower Market share in 2026, while hybrid towers recorded the highest projected CAGR at a 9.8% through 2032.
- By material, steel accounted for 82.1% of the North America Wind Tower Market share in 2026, while composite materials are forecast to expand at a 10.2% CAGR through 2032.
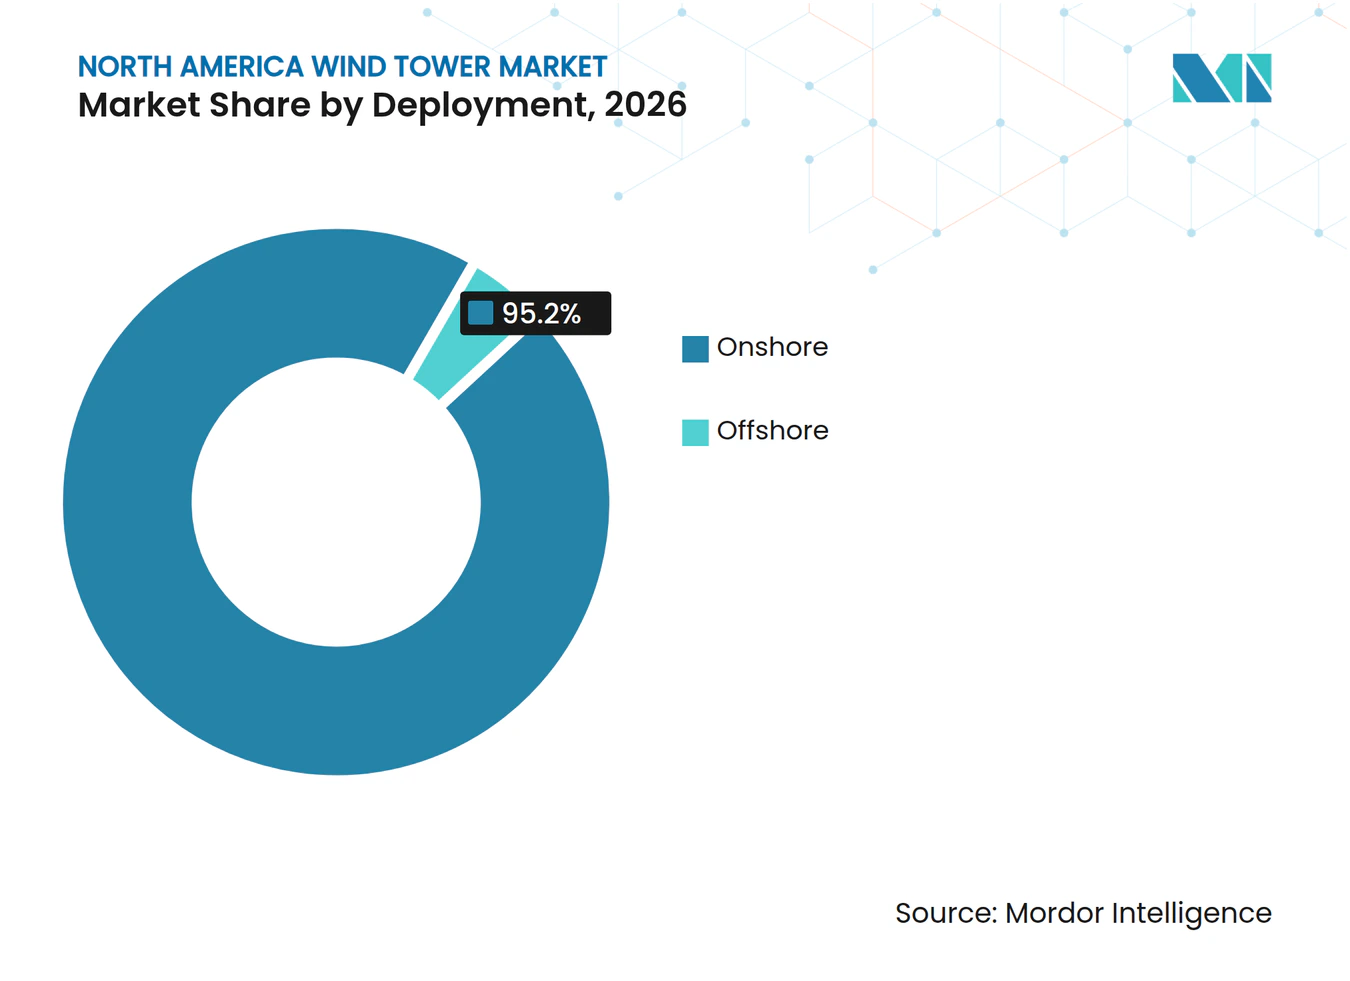
- By deployment, onshore represented 95.2% of the North America Wind Tower Market share in 2026, while offshore deployment is forecast to grow at a 15.4% CAGR through 2032.
- By height, the 81-120 m range held 45.3% of the North America Wind Tower Market size in 2026, while above-160 m structures are expected to record a 9.9% CAGR through 2032.
- By end user, utilities held 55.6% of the North America Wind Tower Market share in 2026, while commercial and industrial users are projected to grow at an 8.6% CAGR through 2032.
- By geography, the United States held 86.6% of the North America Wind Tower Market share in 2026, while Canada is forecast to expand at an 8.9% CAGR through 2032.
Note: Market numbers in this report are based on Mordor Intelligence's proprietary estimation framework, which combines nine months of actuals with Q4 projections for base year 2026.
Market Trends and Insights
Drivers Impact Analysis of North America Wind Tower Market*
| Driver | (~) % Impact on CAGR Forecast | Geographic Relevance | Impact Timeline |
|---|---|---|---|
| U.S. Domestic-Content Incentives and Local Tower Capacity Expansion | +1.7% | North America, primarily United States with spillover to Canada | Medium term (2-4 years) |
| Demand for Taller Towers in Higher-Quality Wind Corridors | +1.3% | United States (Great Plains, Southeast), Canada (Prairie and Atlantic provinces) | Medium term (2-4 years) |
| Repowering of Aging Onshore Fleets | +0.9% | United States, primarily Texas, Iowa, Oklahoma, Kansas | Short term (≤ 2 years) |
| Offshore Wind Procurement and Port Investment | +0.8% | US East Coast, Canada (Nova Scotia, Newfoundland) | Long term (≥ 4 years) |
| Corporate PPAs and Data-Center Electricity Demand | +1.0% | United States (Texas ERCOT, Midwest), Canada (Ontario, Nova Scotia) | Short term (≤ 2 years) |
| Regional Manufacturing Specialization and Supply-Chain Resilience | +0.6% | United States (Midwest, Southwest), Canada | Long term (≥ 4 years) |
| Source: Mordor Intelligence | |||
U.S. Domestic-Content Incentives and Local Tower Capacity Expansion
Projects beginning construction in 2026 must meet a 50% domestic-content threshold to qualify for the relevant bonus credit, and the threshold rises to 55% for 2027 projects.[1] Towers carry substantial structural value, so local fabrication can determine whether a developer can meet that threshold. The North America Wind Tower Market benefits when domestic suppliers can provide certified sections without disrupting project schedules. CS Wind’s Pueblo facility has targeted an annual output of 10,000 tower sections by 2028, compared with 3,000 sections before its expansion. Arcosa disclosed that it converted an idled tower plant to utility-pole production and planned another conversion in 2027, which shows that available tower capacity can change quickly. The scheduled end of advanced-manufacturing credits for towers sold after 2027 narrows the period in which producers can expand with policy support.
Demand for Taller Towers in Higher-Quality Wind Corridors
The North America Wind Tower Market is moving toward taller structures because greater hub heights allow projects to access stronger and more consistent wind conditions. The U.S. Department of Energy reported that the average hub height for utility-scale land-based turbines reached 103.4 m in 2023, which was 83% higher than the 1998-1999 baseline. Conventional tubular sections face road-transport limits when base diameters approach 4.3-4.6 m, making very tall designs harder to deliver to inland sites. Hybrid, modular, and composite configurations can address these logistics limits while supporting higher hub heights. DOE programs have specifically supported technology for hub heights above 120 m, which places that range at the center of current tower development. This engineering shift gives qualified manufacturers an opening to compete on design capability rather than only on conventional steel capacity.
Repowering of Aging Onshore Fleets
The North America Wind Tower Market has a growing replacement opportunity as older wind plants reach the point where larger turbines become practical. The U.S. onshore fleet reached 153 GW at the end of 2024, and many early installations in Texas, Iowa, Oklahoma, and Kansas are approaching or have passed 20 years of operation. A 2026 study estimated U.S. onshore repowering potential at 314 GW, indicating that existing sites could support much more capacity without new land.[2] GE Vernova booked 1.1 GW of U.S. onshore repower orders in 2025, with operations expected during 2026 and 2027. Repowering can require towers that carry larger rotors and operate at higher hub heights, rather than simply extending the life of existing equipment. It also places replacement projects in competition with new projects for domestic fabrication slots, which can affect the timing of orders.
Offshore Wind Procurement and Port Investment
Offshore procurement, corporate power contracts, and data-center electricity demand create separate paths for the North America Wind Tower Market to add higher-value work. New Jersey awarded 3.74 GW of offshore capacity in 2025, including commitments for tower manufacturing at the New Jersey Wind Port. New York’s South Brooklyn Marine Terminal is scheduled for completion in 2026 to support Empire Wind 1, and public funding for port upgrades across New York, New Jersey, and Connecticut reached nearly USD 1.6 billion. EPRI projects that data centers will account for 9-17% of U.S. electricity demand by 2030, up from 4-5% in 2025. Large power buyers can support wind projects through long-term contracts, particularly in Texas and the Midwest. These projects favor dependable capacity and can increase demand for taller configurations that offer stronger energy output.
Restraints Impact Analysis of North America Wind Tower Market*
| Restraint | (~) % Impact on CAGR Forecast | Geographic Relevance | Impact Timelin |
|---|---|---|---|
| Transmission Congestion and Curtailment Risk | -0.7% | United States (MISO, SPP, ERCOT wind corridors) | Medium term (2-4 years) |
| Heavy-Plate Steel Price Volatility | -1.3% | Global, acute in U.S. and Canada fabrication markets | Medium term (2-4 years) |
| Oversize Transport, Port, and Crane Constraints | -0.9% | North America, particularly U.S. East Coast ports and inland corridors | Short term (≤ 2 years) |
| Permitting, Radar, Wildlife, and Litigation Delays | -1.5% | United States (nationwide, particularly radar-sensitive onshore corridors) | Short term (≤ 2 years) |
| Source: Mordor Intelligence | |||
Permitting, Radar, Wildlife, and Litigation Delays
Permitting uncertainty has reduced near-term order visibility for the North America Wind Tower Market. The Department of Defense paused radar-mitigation reviews for onshore wind from August 2025, which delayed required clearance steps for projects across multiple states. A federal court in Oregon ordered the Department of Defense to lift the review freeze in August 2026. A Massachusetts court also issued a preliminary injunction in April 2026 against certain heightened federal permitting requirements. Eagle-take permitting resumed in January 2026 after a 12-month suspension, which may allow stalled siting work to proceed. The backlog may clear over several years because radar, wildlife, and other approvals are separate stages of project development.
Heavy-Plate Steel Price Volatility
Steel, transmission, and delivery constraints can weaken the predictability of tower orders even when project demand is present. Heavy plate is a key input for tower fabrication, and changes in its cost can complicate fixed-price engineering, procurement, and construction contracts. Offshore towers require specialty plate, qualified welding, corrosion protection, and strict structural certification, which reduces the number of available suppliers. Transmission congestion exceeded USD 12 billion in the United States during 2024, and wind curtailment in SPP and MISO corridors reached 5-10% annually. Oversize components also depend on road access, crane availability, and port capacity, especially for offshore projects and inland tall-tower installations. These constraints can shift demand between delivery periods and create a premium for suppliers that manage fabrication, logistics, and installation interfaces effectively.
*Our forecasts treat driver/restraint impacts as directional, not additive. The impact forecasts reflect baseline growth, mix effects, and variable interactions.
North America Wind Tower Market Segment Analysis
By Tower Type:
Tubular Steel Supports Current Demand While Hybrid Towers Gain GroundTubular steel towers held 76.3% of the North America Wind Tower Market share in 2026, confirming their place as the standard option for most active projects. Their lead reflects established fabrication plants, erection practices, inspection processes, and use across the Great Plains, Midwest, and Canadian Prairies. The design remains cost-effective for conventional hub heights and can fit existing project logistics. The North America Wind Tower Market continues to rely on tubular steel because many planned onshore projects do not require taller or more complex structures. Arcosa and CS Wind have prepared production capability for sections that support designs above 120 m, which shows that the format can still adapt. Lattice towers serve narrower uses at remote or lower-wind locations, while standalone concrete towers remain less common in the region.
Hybrid towers are forecast to post a 9.8% CAGR through 2032, the highest rate among tower types. They use prefabricated concrete lower sections and steel upper sections to reduce transport limits associated with large tubular bases. This approach can support hub heights above 120 m at inland locations where road dimensions constrain conventional steel sections. A 2026 comparison found that steel-concrete hybrid designs can reduce greenhouse-gas emissions per unit of structural performance at a 165 m case hub height. Hybrid solutions therefore address both project logistics and structural requirements for taller turbines. Their adoption depends on whether developers can manage on-site assembly, concrete work, and scheduling without losing the cost advantages of the design.



By Material:
Steel Holds the Largest Position While Composites Target Taller DesignsSteel represented 82.1% of material consumption in 2026 and remained the core input for the North America Wind Tower Market. Established welding capacity, domestic-content considerations, and well-developed supply chains support its continued use. Steel towers have a known certification and maintenance base, which reduces execution risk for utilities and developers. Qualified fabricators can use existing processes for a large share of onshore requirements. ISO welding qualifications and tower design standards still require careful production control, so steel’s established supply chain does not remove barriers for new producers. The material’s position also reflects the high volume of conventional onshore projects that use proven tubular structures.
Composite materials are forecast to grow at a 10.2% CAGR through 2032, the fastest pace within the material classification. Glass- and carbon-fiber sections can lower weight while maintaining the strength needed for very tall upper sections. They can also reduce the need for some marine coating cycles in offshore settings. Composite materials are most relevant when weight, fatigue performance, and transport limitations make conventional steel less attractive. Concrete keeps a stable role through hybrid structures, particularly where lower sections can be produced or assembled near the project site. The North America Wind Tower Market may therefore use more mixed-material designs rather than move away from steel on a broad basis.
By Deployment:
Onshore Maintains Volume While Offshore Raises Unit ValueOnshore deployment accounted for 95.2% of the North America Wind Tower Market share in 2026. Large project pipelines in the Great Plains and other central corridors supported this position. Onshore sites use established development, transport, and construction systems, which keep them central to regional tower demand. Utilities and independent power producers can also use familiar procurement structures for these projects. The large installed base creates further work through repowering, where replacement towers can support larger turbines. Near-term permitting disruption and construction-start requirements can still shift the timing of onshore orders.
Offshore deployment is forecast to expand at a 15.4% CAGR through 2032, the fastest rate among deployment categories. Each offshore tower package can require more specialized engineering, materials, coatings, and port coordination than a comparable onshore installation. The North America Wind Tower Market size attributable to offshore projects can therefore rise faster than the installed volume alone would suggest. State procurement programs and port investments along the U.S. East Coast and Canadian Atlantic coast support this direction. The Bureau of Ocean Energy Management and Federal Energy Regulatory Commission requirements add project-planning complexity, while the specialized fabrication requirement limits the number of capable suppliers. European companies including GRI Renewable Industries, Haizea Wind, and Windar Renovables have early positions in monopiles and transition pieces where domestic capacity is still limited.

By Height:
The 81-120 m Range Leads While Above-160 m Designs ExpandThe 81-120 m range held 45.3% of the North America Wind Tower Market size in 2026. This band suits much of the active project base in the U.S. Midwest and Canadian Prairies. It offers a practical balance among energy yield, structural requirements, transport needs, and construction cost. The DOE’s reported 103.4 m average hub height for U.S. utility-scale land-based turbines shows why this range remains widely used. Towers up to 80 m are becoming less prominent as older installations approach repowering decisions. The 121-160 m category is also gaining use where additional output supports the higher structural and logistics costs.
Above-160 m structures are forecast to grow at a 9.9% CAGR through 2032. These structures can make lower-wind inland sites more viable and can support tall offshore transition pieces. The North America Wind Tower Market is therefore moving toward a broader range of tower heights rather than a single standard design. Hybrid and modular methods are important for this category because they reduce constraints on transporting large sections. DOE support for hub heights above 120 m indicates that public technology programs continue to focus on tall-tower innovation. Higher designs will still require site-specific assessment of roads, cranes, wind conditions, and local permitting.
By End User:
Utilities Lead Procurement While Commercial and Industrial Buyers GrowUtilities held 55.6% of the North America Wind Tower Market share in 2026. Regulated cost recovery, direct-pay mechanisms, and multi-year procurement arrangements support their leading role. Their project pipelines typically require reliable volume and clear delivery schedules from tower suppliers. Utilities also have the balance sheets needed to contract for equipment before final construction activity begins. This gives major manufacturers a stable base of work even when merchant projects face uncertainty. The North America Wind Tower Market remains closely tied to utility resource planning in the United States and Canada.
Commercial and industrial buyers are forecast to grow at an 8.6% CAGR through 2032. Their demand is tied to large corporate power contracts, data-center loads, and decarbonization requirements. In 2025, corporate clean-energy deal volume in the United States reached 29.5 GW, although demand was concentrated among 33 unique buyers. This concentration can produce large demand changes around specific sites or states. Independent power producers connect tower orders more directly to corporate offtake opportunities, while some deregulated markets allow large buyers to participate beside utilities. The resulting procurement mix can make tower demand more sensitive to the timing and location of corporate contracts.
Geography Analysis
The United States held 86.6% of the North America Wind Tower Market share in 2026. Texas, Iowa, Oklahoma, Kansas, and Illinois remain central to onshore development and tower demand. The East Coast is the main offshore growth area, supported by state procurement targets and port investment. New York’s South Brooklyn Marine Terminal is expected to be completed in 2026 for Empire Wind 1. New Jersey’s 3.74 GW offshore award included commitments to expand manufacturing at the Port of Paulsboro and establish tower production at the New Jersey Wind Port. The U.S. regulatory setting combines federal transmission oversight with state renewable requirements. This mix supports a large pipeline but leaves projects exposed to federal permitting and grid-connection timing.
Canada is forecast to grow at an 8.9% CAGR through 2032, making it the fastest-growing geography in the North America Wind Tower Market. The Canada Energy Regulator identified 6,206 MW of new wind projects planned by 2030, which represented 70% of planned renewable additions. Alberta’s recent policy uncertainty has shifted attention toward Ontario and Atlantic provinces. Nova Scotia led Canadian corporate power-purchase agreement volume in 2025 and is planning an initial call for up to 5 GW of offshore wind licenses. Marmen and Ventower provide Canadian fabrication capacity, reducing dependence on cross-border tower supply. Four federally designated offshore zones near Nova Scotia also indicate a long-term development opportunity. Federal and provincial rules will determine how quickly this pipeline becomes tower orders.
Mexico remained the smallest regional geography by value in 2026, although selected corridors offer project opportunities. Installed wind capacity reached 7.62 GW in 2025, concentrated in Oaxaca’s Isthmus of Tehuantepec and with expansion activity in Tamaulipas. Tamaulipas projected USD 1 billion of private investment in 2026 for new wind parks, including the 800 MW Huizache project. Mexico’s Plan México targets 22 GW of additional renewable generation capacity by 2030. Mexico operates outside the U.S. domestic-content framework, allowing developers to source tower equipment from European and Asian suppliers. That procurement structure creates a different price environment from the United States and Canada. It may also moderate the near-term scale of domestic Mexican tower fabrication.
Competitive Landscape
Market Concentration
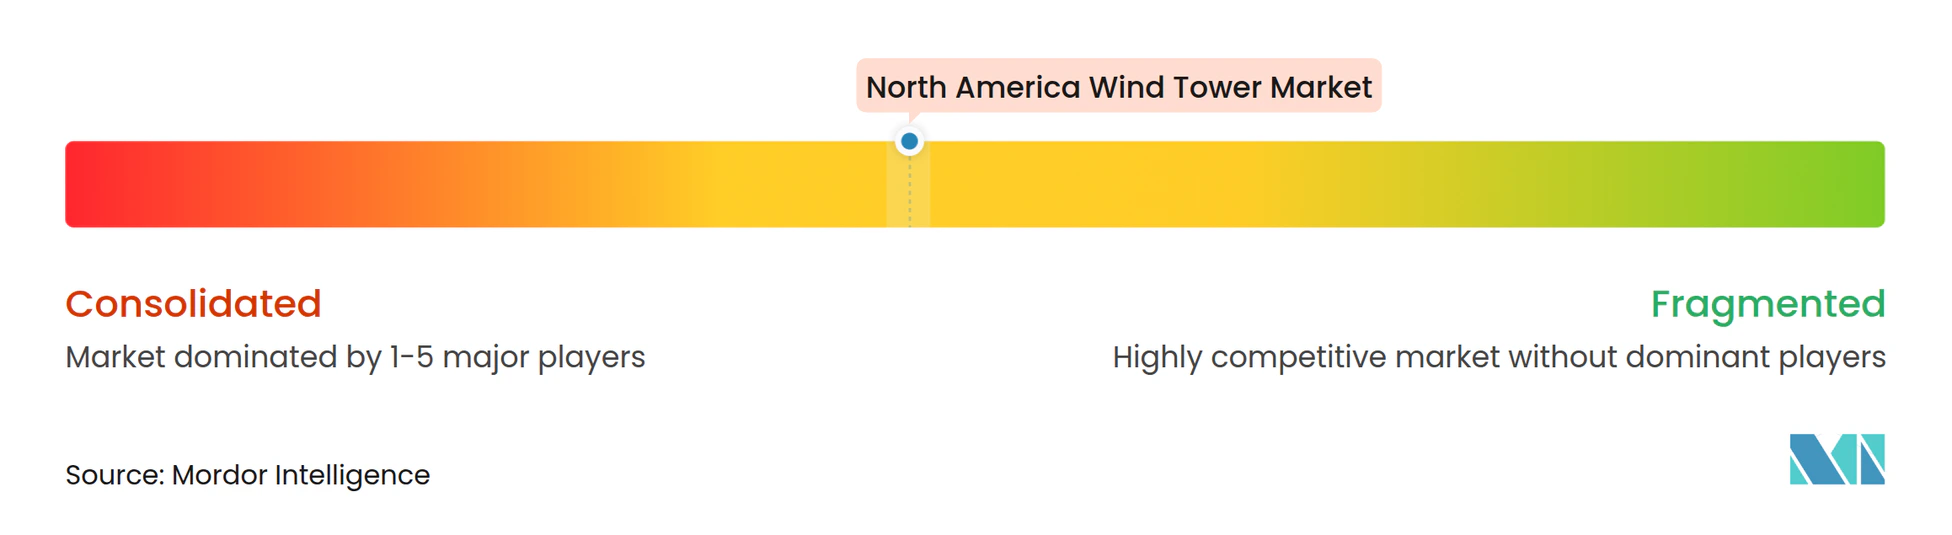
The North America Wind Tower Market is moderately concentrated, with Arcosa, CS Wind America, Marmen, and Ventower supplying a large portion of onshore towers in the United States and Canada. Arcosa has represented 20% of U.S. wind tower installations over the last 20 years. CS Wind’s Pueblo facility is targeting a capacity of 10,000 tower sections per year by 2028. These suppliers compete on localized production, qualified welding, delivery reliability, and the ability to serve taller designs. Domestic-content rules add value to U.S.-based production and can favor suppliers with established local plants. The North America Wind Tower Market also has room for specialized suppliers in hybrid structures and offshore components.
Broadwind sold its Abilene, Texas, facility in May 2026 as part of its exit from wind tower production. Arcosa began production at its Belen, New Mexico facility in the second quarter of 2024 and reported orders extending through 2028. These moves show that manufacturers are reviewing capacity according to order visibility and alternative industrial opportunities. Arcosa’s later conversions of idled tower facilities to utility-pole production also demonstrate that tower capacity is not fixed. The supply response can tighten when wind demand returns because restarting or qualifying a facility requires time. Manufacturers with active certified plants can therefore hold an advantage in meeting urgent project schedules.
Technical capability is becoming more important as tower designs become taller and offshore specifications become more demanding. IEC 61400-6 tower standards and ISO 3834 welding requirements create meaningful entry barriers for general metal fabricators. Keystone Tower Systems has used a patented spiral-welding process that reduces material use and can enable fabrication close to projects for taller designs. European suppliers have a head start in offshore monopiles and transition pieces, where U.S. state awards have outpaced domestic specialized capacity. Suppliers also compete through modular connection systems, post-tensioned concrete methods, and corrosion-resistant coatings. The resulting field is not fragmented, but it continues to allow new specialized entrants in technical niches. Manufacturers that combine certified fabrication with site-specific logistics planning are better placed to serve the next generation of projects. This advantage is especially relevant where customers require components for taller onshore towers or specialized offshore structures.
North America Wind Tower Industry Leaders
-
CS Wind Corporation
-
Arcosa Wind Towers Inc.
-
Broadwind, Inc.
-
Marmen Inc.
-
Valmont Industries, Inc.
- *Disclaimer: Major Players sorted in no particular order
North America Wind Tower Market Companies Covered in this Report
- Arcosa Wind Towers, Inc.
- Broadwind, Inc.
- CS Wind Corporation
- DONGKUK S&C Co., Ltd.
- GRI Renewable Industries, S.L.
- Haizea Wind, S.L.
- Keystone Tower Systems, Inc.
- KGW Schweriner Maschinen- und Anlagenbau GmbH
- Marmen Inc.
- Pemamek Ltd.
- Rohn Products, LLC
- SENLISWELD
- Shanghai Taisheng Wind Power Equipment Co., Ltd.
- Sinoma Wind Power Blade and Tower Co., Ltd.
- SPECO Technologies Co., Ltd.
- Titan Wind Energy (Suzhou) Co., Ltd.
- US Forged Rings Inc.
- Valmont Industries, Inc.
- Ventower Industries, LLC
- Windar Renovables, S.A.
Recent Industry Developments in North America Wind Tower Market
- September 2026: A federal judge in Oregon ordered the U.S. Department of Defense to lift its freeze on wind project radar-mitigation reviews, potentially clearing a backlog of at least 125 onshore projects stalled since August 2025. The ruling followed a coalition lawsuit by renewable energy groups alleging DoD violated its statutory review mandates.
- May 2026: Broadwind, Inc. sold its Abilene, Texas wind tower facility for USD 17.2 million, completing its strategic exit from wind tower production. The company had sold its Manitowoc, Wisconsin facility in 2025 and cited the termination of wind tower advanced-manufacturing credits after 2027 as a key driver.
- February 2026: GE Vernova announced 1.1 GW of U.S. onshore wind repower orders booked in 2025, with commercial operations expected between 2026 and 2027. All projects deploy nacelles manufactured at its Pensacola, Florida facility, which has received USD 70 million of investment since 2023.
North America Wind Tower Market Report Scope
A wind tower is either a tall structural support for an electricity-generating wind turbine or a traditional architectural structure that provides natural cooling.
The North America wind tower market is segmented by tower type, material, deployment, height, end user, and geography. By tower type, the market is segmented into tubular steel towers, concrete towers, lattice towers, hybrid towers, and other tower types. By material, the market is segmented into steel, concrete, composite materials, and hybrid materials. By deployment, the market is segmented into onshore and offshore. By height, the market is segmented into up to 80 m, 81 to 120 m, 121 to 160 m, and above 160 m. By end user, the market is segmented into utilities, independent power producers, government agencies, and commercial and industrial users. The report also covers the market size and forecasts for the North America wind tower market across 3 countries. For each segment, market sizing and forecasts are provided in terms of value (USD).
Segmentation Overview
| Tubular Steel Towers |
| Concrete Towers |
| Lattice Towers |
| Hybrid Towers |
| Other Tower Types |
| Steel |
| Concrete |
| Composite Materials |
| Hybrid Materials |
| Onshore |
| Offshore |
| Up to 80 m |
| 81 to 120 m |
| 121 to 160 m |
| Above 160 m |
| Utilities |
| Independent Power Producers |
| Government Agencies |
| Commercial and Industrial Users |
| United States |
| Canada |
| Mexico |
| By Tower Type | Tubular Steel Towers |
| Concrete Towers | |
| Lattice Towers | |
| Hybrid Towers | |
| Other Tower Types | |
| By Material | Steel |
| Concrete | |
| Composite Materials | |
| Hybrid Materials | |
| By Deployment | Onshore |
| Offshore | |
| By Height | Up to 80 m |
| 81 to 120 m | |
| 121 to 160 m | |
| Above 160 m | |
| By End User | Utilities |
| Independent Power Producers | |
| Government Agencies | |
| Commercial and Industrial Users | |
| By Geography | United States |
| Canada | |
| Mexico |
Key Questions Answered in the Report
What is the projected value of the North America wind tower sector by 2032?
The North America Wind Tower Market size is projected to be USD 6.95 billion in 2026, USD 7.46 billion in 2027, and reach USD 10.63 billion by 2032, growing at a CAGR of 7.33% from 2027 to 2032.
Which tower type is growing the fastest in North America?
Hybrid towers have the highest forecast CAGR at 9.8% through 2032 because they can support taller designs while easing road-transport constraints.
Why do domestic-content rules matter for wind tower suppliers?
Projects starting construction in 2026 need 50% domestic content for the relevant tax-credit bonus, increasing to 55% for 2027 projects.
Which deployment category is growing fastest through 2032?
Offshore deployment has the highest projected CAGR at 15.4%, supported by East Coast procurement programs and port investment.
What constraints can delay new tower orders?
Permitting backlogs, radar reviews, wildlife approvals, transmission congestion, steel costs, and oversize transport limits can change project schedules.
Which country has the strongest growth outlook after the United States?
Canada is forecast to grow at an 8.9% CAGR through 2032, supported by a 6,206 MW pipeline of wind projects planned by 2030.