Wild Pollock Market Size and Share
Wild Pollock Market Analysis by Mordor Intelligence
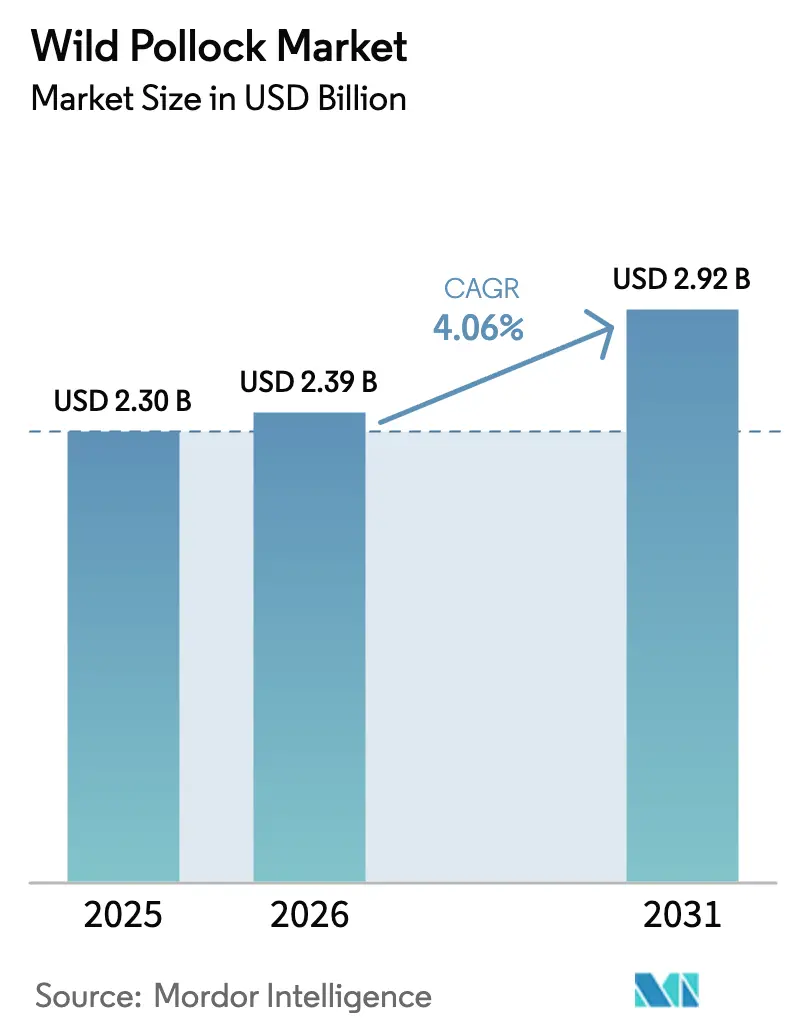
The Wild Pollock market size is expected to grow from USD 2.30 billion in 2025 to USD 2.39 billion in 2026 and is forecast to reach USD 2.92 billion by 2031 at 4.06% CAGR over 2026-2031. This trajectory is anchored in the species’ status as the backbone of the world’s largest single-species fishery and its deep penetration into global fast-food supply chains. Intensifying competition between Russian and United States (U.S.) fleets, combined with quick-service restaurant (QSR) expansion, is reshaping cost structures and trade flows. Climate-driven stock shifts, particularly the northward migration of Pollock in the Bering Sea, add further complexity to quota management and supply security. Simultaneously, the decline in other whitefish stocks and ongoing consumer focus on lean protein are boosting substitution demand for Pollock in retail and food service channels.
Key Report Takeaways
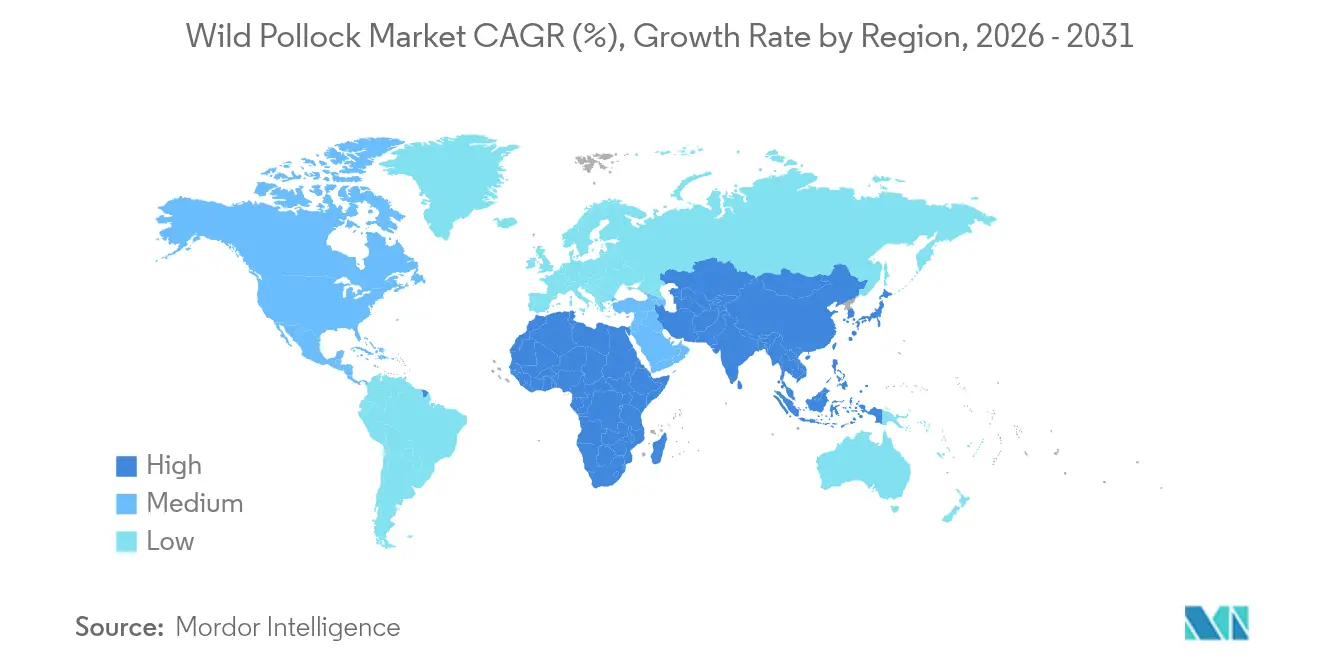
- By geography, North America led with a 38.61% wild pollock market share in 2025, while Asia-Pacific is forecast to post the fastest 4.18% CAGR through 2031.
Note: Market size and forecast figures in this report are generated using Mordor Intelligence’s proprietary estimation framework, updated with the latest available data and insights as of 2026.
Global Wild Pollock Market Trends and Insights
Drivers Impact Analysis*
| Driver | (~) % Impact on CAGR Forecast | Geographic Relevance | Impact Timeline |
|---|---|---|---|
| Expansion of global fast-food and QSR chains | +0.8% | Global, concentrated in Asia-Pacific and South America | Medium term (2-4 years) |
| Growing demand for affordable lean protein | +0.6% | North America and Europe | Short term (≤2 years) |
| Supportive quotas and MSC certifications | +0.4% | North America and Europe | Long term (≥4 years) |
| Rising Bering Sea and Russian Far-East catch volumes | +0.7% | Global supply impact | Short term (≤2 years) |
| Blockchain-based catch provenance premiums | +0.2% | North America and European Union | Long term (≥4 years) |
| Hybrid-electric trawlers lowering operating costs | +0.3% | Nordic countries | Medium term (2-4 years) |
| Source: Mordor Intelligence | |||
Expansion of global fast-food and QSR chains
The rapid expansion of global fast-food and quick-service restaurant (QSR) chains is significantly fueling demand in the wild pollock market as brands seek affordable, versatile, and sustainable whitefish options to meet rising consumer demand. McDonald’s, which sources 100% wild-caught Alaska pollock for its Filet-O-Fish, plans to operate 50,000 locations by 2027 after opening 2,100 outlets in 2024. The chain’s standardized seafood specification channels steady demand into the wild pollock market while incentivizing traceability and MSC labeling. Franchise roll-outs across Asia and South America amplify raw-material pull during a period when Russian supply is climbing and U.S. output is tightening. Although QSR menus are price sensitive, brand commitments to certified supply create resilience for incumbents that can verify provenance. Consequently, the global footprint of QSRs is a pivotal growth lever for the wild pollock market despite cyclic menu revisions.
Growing Demand for Affordable Lean Protein
Health-driven consumers are pivoting toward lower-mercury, high-protein seafood, pushing pollock consumption higher as cod and haddock supplies wane. The record U.S. household intake in 2024 coincided with heightened inflation, underscoring Pollock’s value positioning. USDA reinforced this value narrative with a USD 50 million purchase for food assistance programs in 2025. Versatility from fish sticks to surimi enables processors to serve mainstream retail, institutional buyers, and industrial users without incurring premium raw-material costs. These attributes collectively enlarge the wild pollock market’s accessible demand pool.
Supportive Quotas and MSC Certifications
Supportive fishing quotas and Marine Stewardship Council (MSC) certifications are reinforcing its reputation as one of the world’s most sustainable and responsibly managed fisheries. The Bering Sea quota rose 6% to 1.37 million metric tons for 2025[1]Genuine Alaska Pollock Producers, “Russian Surimi Growth Alters 2025 Supply,” alaskapollock.org, signaling confidence in biomass health and granting processors visibility on near-term volume. Yet Norwegian studies show MSC certification no longer assures a consistent price premium, with returns diverging by region. Certified volumes slid from 90% to roughly 40% of global catch after lapses and reassessments, but buyers such as McDonald’s still cite MSC criteria within sourcing standards. This duality nudges suppliers toward operational efficiency even as eco-labels remain a threshold for market entry.
Rising Bering Sea and Russian Far-East Catch Volumes
Rising catch volumes in the Bering Sea and Russian Far East are boosting global supply and stabilizing prices for processors and food service buyers. Russia raised its 2025 total allowable catch by 7% to 2.46 million metric tons and lifted surimi output by 37%, while U.S. production fell 12.6% in 2024. Lower Russian operating costs translated into a 20% price drop for surimi exports, placing Asian processors under margin pressure. Climate-related stock mixing between the U.S. and Russian EEZs compounds the competitive landscape by redistributing biomass. Geopolitical sanctions complicate purchase routes, generating grey-channel flows that blur provenance labeling and erode price discipline. Together, these factors reshape bargaining power inside the wild pollock market, since lower prices and increased supply can benefit buyers.
Restraints Impact Analysis*
| Restraint | (~) % Impact on CAGR Forecast | Geographic Relevance | Impact Timeline |
|---|---|---|---|
| Declining biomass in Atlantic stocks | -0.5% | North Atlantic, spillover to Pacific | Medium term (2-4 years) |
| Ocean warming altering migratory patterns | -0.7% | Bering Sea and North Pacific | Long term (≥4 years) |
| Plant-based seafood analogues gaining share | -0.3% | North America and Europe | Medium term (2-4 years) |
| Carbon taxation on distant-water fleets | -0.4% | EU and Nordic nations | Short term (≤2 years) |
| Source: Mordor Intelligence | |||
Declining Biomass in Atlantic Stocks
Accelerated depletion of cod and haddock has triggered quota tightening across the North Atlantic and ratcheted up scrutiny for all capture fisheries.[2]Marine Stewardship Council, “Status of Global Fisheries 2024,” msc.org Substitution of Pollock is temporarily positive for the wild pollock market, yet it reinforces conservation debates that could lead regulators to pre-emptively trim Pacific quotas if biomass signals weaken. Media coverage of overfishing elevates reputational risk for retailers stocking uncertified products, driving them toward aquaculture or plant-based analogs. Consequently, while Atlantic shortfalls lift demand in the near term, they also sharpen sustainability expectations that can constrain long-run catch allowances for Pollock.
Ocean Warming Altering Migratory Patterns
Shifts in temperature regimes have moved Pollock spawning grounds northward, complicating stock assessments and quota apportionment. Mixed-EEZ migrations test bilaterally agreed catch splits and heighten diplomatic tensions between the U.S. and Russia. More voyages into the Arctic escalate operating costs, raise safety concerns, and boost carbon intensity, countering efficiency gains from hybrid vessels. Uncertainty surrounding biomass distribution adds forecasting volatility, which dampens investment in processing capacity. Prolonged climate variability, therefore, poses the most significant biological restraint to the stability of the wild pollock market.
*Our forecasts treat driver/restraint impacts as directional, not additive. The impact forecasts reflect baseline growth, mix effects, and variable interactions.
Geography Analysis
North America’s 38.61% wild pollock market share in 2025 reflects the structural heft of Alaska’s 1.4 million metric tons annual harvest, integrated freezer-trawler fleets, and entrenched contracts with multinational QSR clients. Yet the region’s USD 1.8 billion revenue decline in 2023 and 39% export fall-off to China highlight sensitivity to foreign tariff swings and geopolitical headwinds. Government interventions, including a USD 50 million USDA purchase, have provided short-term relief while processors accelerate cost-cutting and fleet modernization. Canadian and Mexican participation, though smaller, introduces diversification by way of secondary processing and cross-border logistics into the continental wild pollock market.
Asia-Pacific’s forecast of 4.18% CAGR cements its role as the chief demand accelerator for the wild pollock market. China’s 4.6 million metric tons seafood import appetite and January 2025 tariff hike on U.S. pollock to 5% expose U.S. fleets to margin erosion while inflating Russian-origin competitiveness. Japan and South Korea import steady volumes for surimi and frozen block reprocessing, sustaining liquidity even when mainland Chinese demand softens. Meanwhile, Vietnam’s rise as a re-export hub underscores how intra-Asian trade arbitrage is reshaping flows and pricing tiers inside the wild pollock market.
Europe maintains strong import volumes supported by autonomous tariff quotas and high per-capita seafood consumption, yet Brexit logistics and Russia-related sanctions complicate transactional friction. The EU’s carbon-pricing trajectory weighs heavily on distant-water trawl economics, nudging fleets toward hybrid vessels for pollock runs. Punitive UK tariffs on Russian seafood reroute supply chains toward Norway and Alaska, cushioning price falls for certified North American products. Emerging lanes into North Africa and the Gulf Cooperation Council countries provide incremental growth potential as disposable income rises and protein diversification accelerates within the broader wild pollock market.


Recent Industry Developments
- May 2025: The U.S. Department of Agriculture has announced a program to purchase frozen Atlantic pollock fillets for food assistance. This initiative is designed to support domestic processors by mitigating the challenges posed by import competition. By procuring these fillets, the program aims to bolster the domestic seafood industry while contributing to food security efforts. The purchase program underscores the government's commitment to aiding local producers and ensuring a stable supply chain.
- March 2025: China has increased tariffs on frozen Alaska pollock from 2% to 5%, impacting seven fisheries products. This tariff adjustment is anticipated to influence trade dynamics between China and Alaska.
- October 2024: Russia increased its 2025 pollock total allowable catch by 7%, reaching 2.46 million metric tons. This adjustment reflects the country's efforts to manage its fishery resources while meeting growing demand. The increase is anticipated to intensify supply pressure in the global market, potentially impacting pricing and trade dynamics.
- March 2024: Thoma-Sea Marine Constructors delivered the Arctic Fjord hybrid trawler processor to Seattle-based Arctic Storm Management Group. The vessel is specifically designed for catching Alaskan pollock in the Bering Sea.


Research Methodology Framework and Report Scope
Market Definitions and Key Coverage
Our study defines the wild pollock market as all wild-caught Alaska and Atlantic pollock landed, processed, and sold for human consumption, whether fresh, frozen, canned, or turned into surimi, fish sticks, or meal. Values are taken at ex-factory level in constant 2024 US dollars across every producing and consuming region.
Scope Exclusion: Farm-raised whitefish substitutes and revenues from ready-to-eat seafood meals lie outside scope.
Segmentation Overview
- By Geography
- North America
- United States
- Canada
- Mexico
- South America
- Brazil
- Argentina
- Europe
- Germany
- United Kingdom
- France
- Russia
- Poland
- Denmark
- Netherlands
- Asia-Pacific
- China
- Japan
- South Korea
- Vietnam
- Middle East
- Saudi Arabia
- United Arab Emirates
- Africa
- South Africa
- Nigeria
- North America
Detailed Research Methodology and Data Validation
Primary Research
We spoke with quota holders, Asian surimi processors, North American food-service buyers, and European retail seafood managers. Their insights confirmed quota utilization, contract price bands, and emerging demand cues that desk work alone cannot surface.
Desk Research
Mordor analysts drew catch and trade volumes from NOAA Fisheries stock bulletins, FAO FishStat, UN Comtrade codes 030367/030475, and Marine Stewardship Council certificate logs. Industry briefs from the Association of Genuine Alaska Pollock Producers, Eurostat landings, peer-reviewed biomass studies, company 10-Ks, import price indices, D&B Hoovers, and Dow Jones Factiva set volume and price baselines. These examples illustrate breadth; many additional public records supported validation.
Market-Sizing & Forecasting
A top-down build multiplies verified catch tonnage by weighted dockside prices, then adjusts for yield loss, regional value-add, and taxes. Results are pressure-tested through selective bottom-up supplier roll-ups and channel checks. Key variables like Total Allowable Catch, surimi yield ratios, tariff shifts, retail seafood inflation, and per-capita seafood intake in China and the United States feed an ARIMA forecast enriched by expert scenarios for quota or climate shocks.
Data Validation & Update Cycle
Outputs clear three-tier variance checks and senior review; anomalies trigger re-contacts. The dataset refreshes each year, with interim updates whenever quota or trade events materially shift the baseline.
Why Mordor's Wild Pollock Baseline Remains the Trusted Benchmark
Published figures often diverge because some firms blend farmed species, value product at retail shelf, or smooth prices across several years. By locking species scope, valuation point, and annual refresh, Mordor Intelligence delivers a disciplined, transparent baseline that decision-makers can rely on.
These contrasts show how our clearer scope, variable choice, and timely refresh anchor the most balanced, repeatable view available.
Benchmark comparison
| Market Size | Anonymized source | Primary gap driver |
|---|---|---|
| USD 2.30 B (2025) | Mordor Intelligence | - |
| USD 2.20 B (2024) | Global Consultancy A | shipment year only |
| USD 2.38 B (2025) | Industry Journal B | counts aquafeed use |
| USD 8.40 B (2024) | Research House C | bundles wider whitefish |
These contrasts show how our clearer scope, variable choice, and timely refresh anchor the most balanced, repeatable view available.


Key Questions Answered in the Report
What is the current size of the wild pollock market?
The wild pollock market size stood at USD 2.39 billion in 2026 and is projected to reach USD 2.92 billion by 2031.
Which region holds the largest share of the wild pollock market?
North America led with 38.61% market share in 2025, anchored by Alaska’s high-volume fishery
Why is Asia-Pacific the fastest-growing region?
Rising seafood consumption, China’s import demand, and expanding QSR footprints are driving a 4.18% CAGR through 2031.
How are Russian catch increases affecting global prices?
A 37% surge in Russian surimi output and a 7% quota increase for 2025 have driven export prices down 20%, pressuring the U.S. and Asian processors.
Page last updated on:


