
UV Industrial Imaging Systems Market Size and Share
Market Overview
| Study Period | 2020 - 2031 |
|---|---|
| Market Size (2026) | USD 563.61 Million |
| Market Size (2031) | USD 800.69 Million |
| Growth Rate (2026 - 2031) | 7.27 % |
| Fastest Growing Market | Asia-Pacific |
| Largest Market | North America |
| Market Concentration | Medium |
Major Players *Disclaimer: Major Players sorted in no particular order Image © Mordor Intelligence. Reuse requires attribution under CC BY 4.0. | |
UV Industrial Imaging Systems Market Analysis by Mordor Intelligence
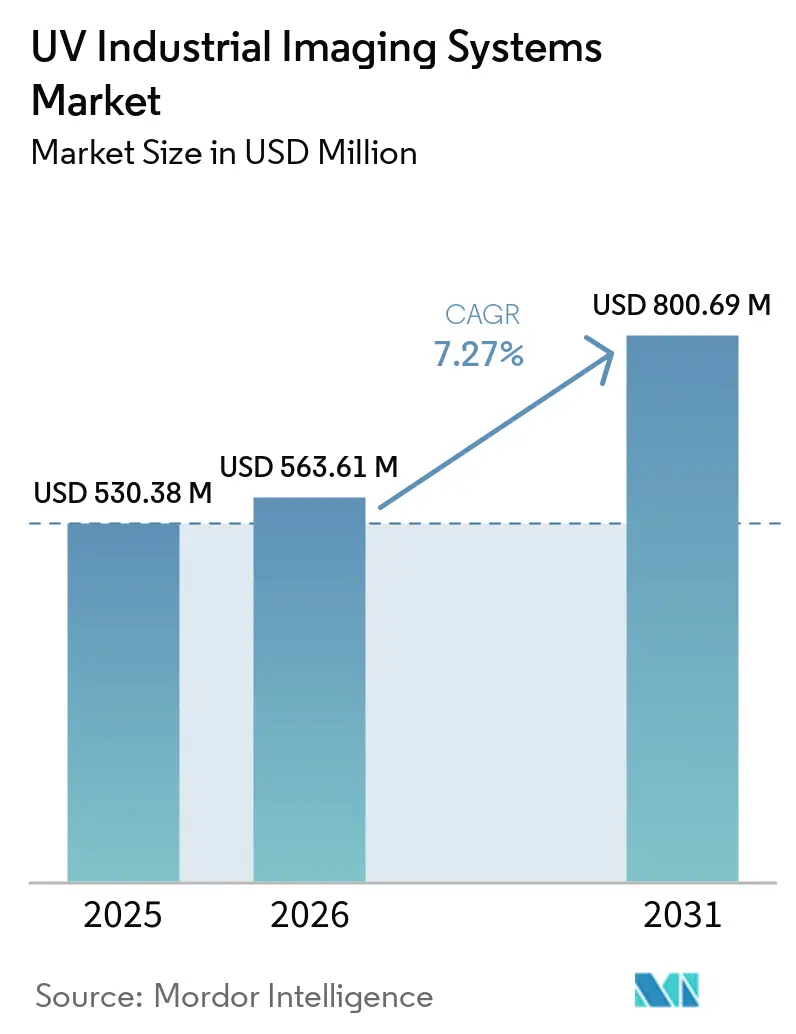
The UV industrial imaging systems market size was valued at USD 530.38 million in 2025 and estimated to expand from USD 563.61 million in 2026 to reach USD 800.69 million by 2031, at a CAGR of 7.27% during the forecast period (2026-2031). Demand is supported by smaller semiconductor nodes, wider zero-defect manufacturing requirements, and applications in solar quality control, power infrastructure, pharmaceutical inspection, and material sorting. Equipment selection is increasingly linked to the quality of the image data available for automated classification, which makes camera, optics, and software choices more interdependent. Suppliers are responding through integrated systems, analytics packages, and specialized imaging products for difficult operating conditions. High UV-grade optics costs and short sensor replacement cycles remain important barriers for buyers with limited capital budgets. The UV industrial imaging systems market also benefits from field inspection applications, where portable systems can support maintenance work in utilities, aerospace, and solar. These applications extend the UV industrial imaging systems market beyond factory-based inspection.
Key Report Takeaways
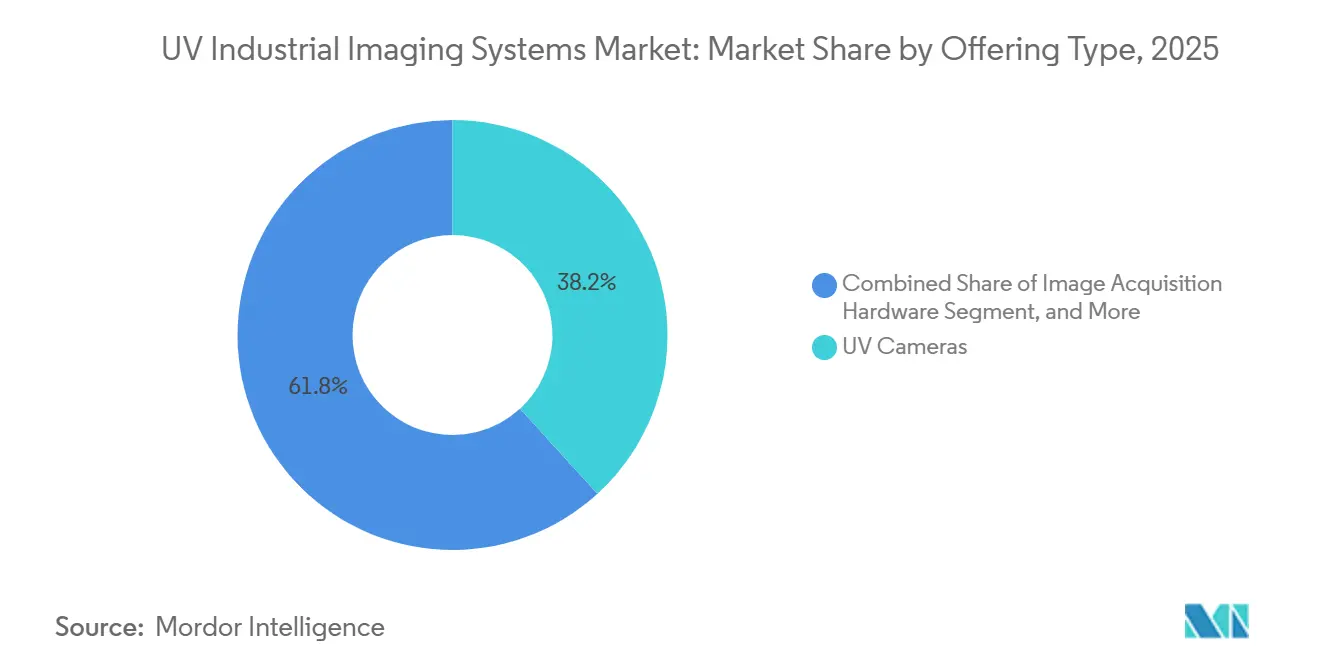
- By offering type, UV cameras held 38.21% share in 2025 of the UV industrial imaging systems market, while software and analytics are projected to expand at a 7.66% CAGR through 2031.
- By spectral range, UV-A imaging held 53.46% share in 2025, while UV-C imaging is projected to expand at a 7.78% CAGR through 2031.
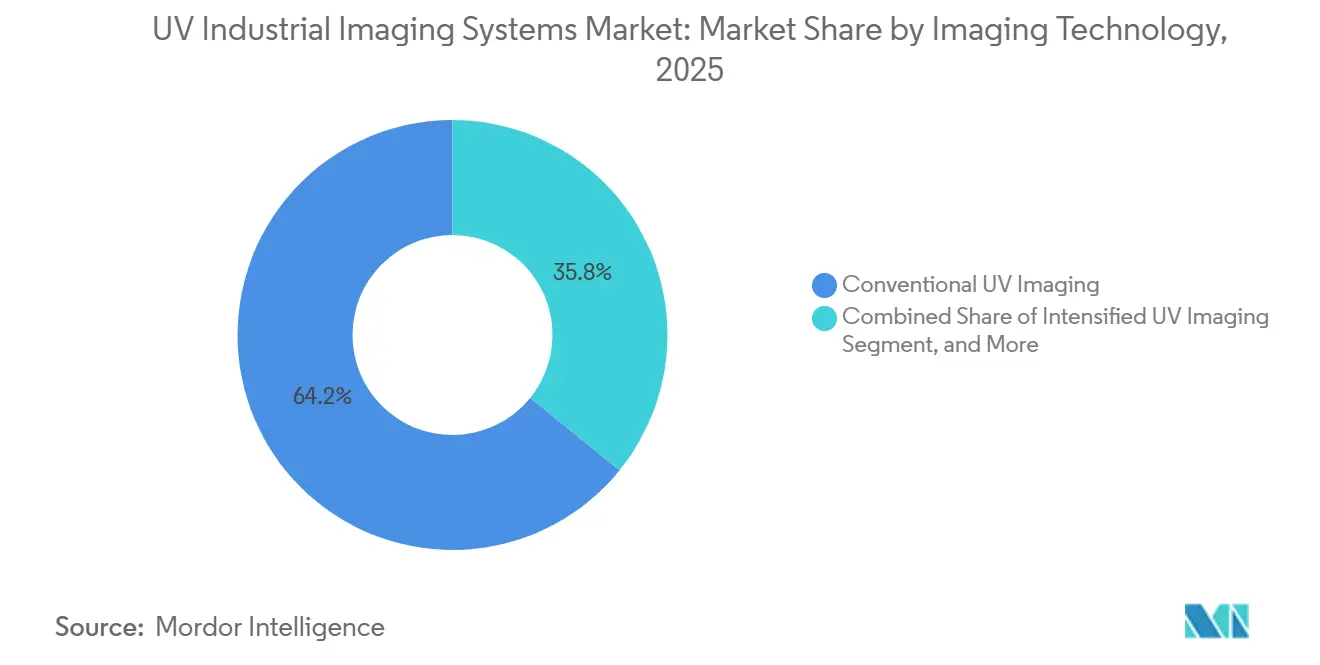
- By imaging technology, conventional UV imaging held 64.16% share of the UV industrial imaging systems market in 2025, while hyperspectral UV imaging is projected to expand at a 7.92% CAGR through 2031.
- By camera format, area-scan cameras held 48.52% share of the UV industrial imaging systems market in 2025, while high-speed cameras are projected to expand at a 7.83% CAGR through 2031.
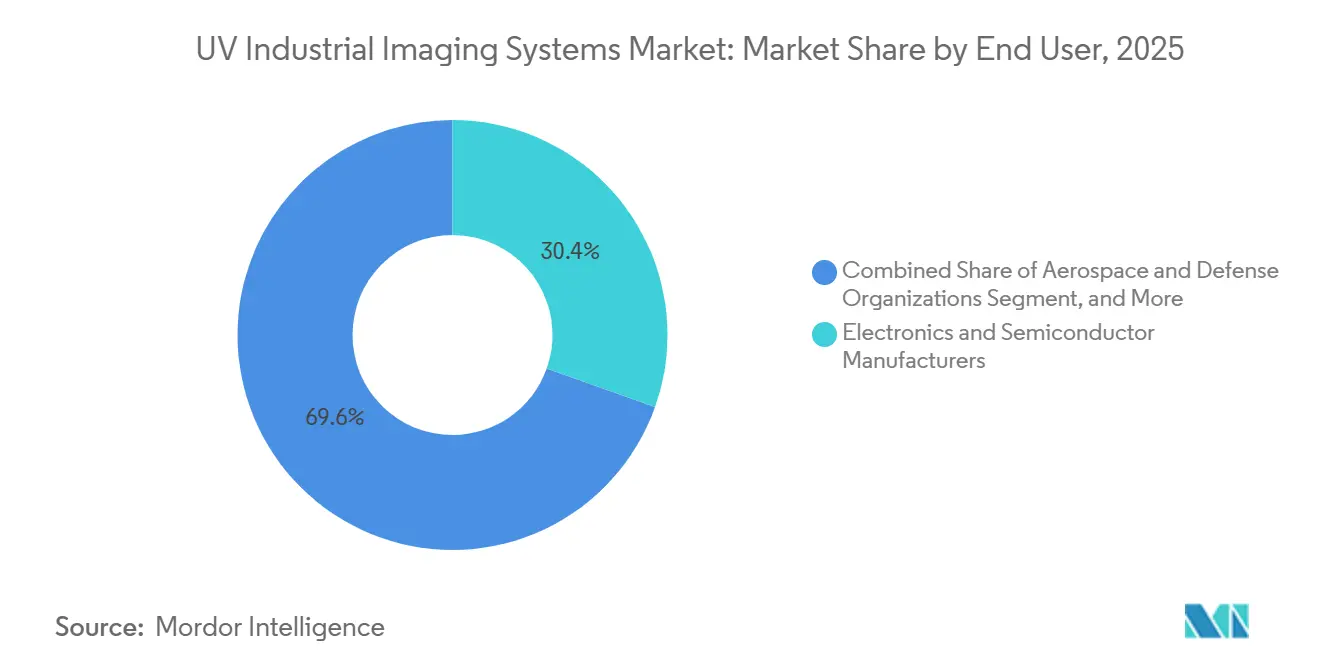
- By end user, electronics and semiconductor manufacturers held 30.44% share in 2025, while utilities and electrical network operators are projected to expand at a 7.44% CAGR through 2031.
- By system configuration, integrated machine vision systems held 36.39% share in 2025, while portable and handheld systems are projected to expand at a 7.58% CAGR through 2031.
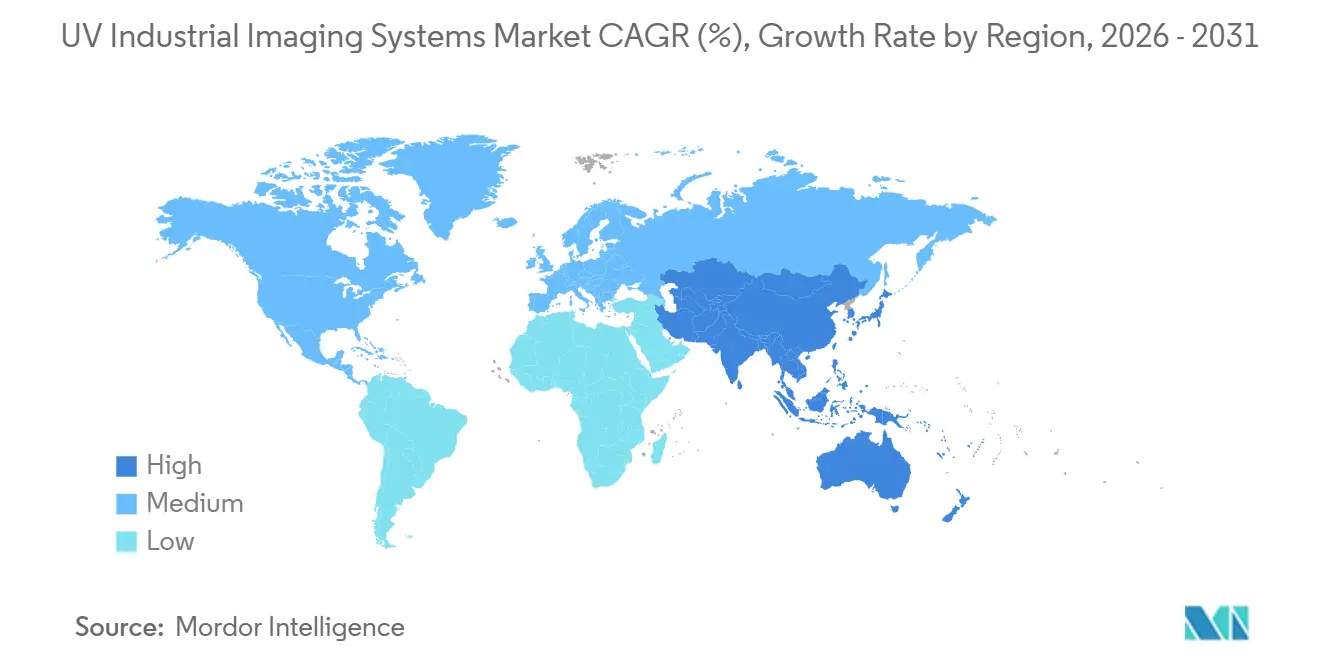
- By geography, Asia-Pacific held 38.92% of the UV industrial imaging systems market in 2025, while the Middle East and Africa is projected to expand at a 7.93% CAGR through 2031.
Note: Market size and forecast figures in this report are generated using Mordor Intelligence’s proprietary estimation framework, updated with the latest available data and insights as of January 2026.
Global UV Industrial Imaging Systems Market Trends and Insights
Drivers Impact Analysis*
| Driver | (~) % Impact on CAGR Forecast | Geographic Relevance | Impact Timeline |
|---|---|---|---|
| Semiconductor and Advanced Electronics Defect Detection | +2.1% | Global, strongest in Asia-Pacific, including China, South Korea, Taiwan, and Japan | Short term (≤ 2 years) |
| Zero-Defect Manufacturing and Inline Quality Control | +1.5% | Global, with the largest volumes in North America and Europe | Medium term (2-4 years) |
| AI-Assisted Classification of Subvisible Surface Defects | +1.0% | North America and Asia-Pacific, with spillover to Europe | Medium term (2-4 years) |
| UV-Selective Sorting and Material Identification | +0.7% | Europe and Asia-Pacific, where recycling infrastructure is advanced | Medium term (2-4 years) |
| Expansion of UV Inspection in Solar Cell Manufacturing | +0.5% | Asia-Pacific and the Middle East and Africa, with growing relevance in Europe | Long term (≥ 4 years) |
| Portable Detection of Electrical Discharge and Corona | +0.4% | Global, with strong relevance in Middle East and Africa and Asia-Pacific grid expansion zones | Short term (≤ 2 years) |
| Source: Mordor Intelligence | |||
Semiconductor and Advanced Electronics Defect Detection
UV imaging supports yield protection at advanced semiconductor nodes, where particles and edge irregularities can affect device performance before electrical testing finds them. Wavelengths from 190 nm to 400 nm can provide contrast for nanoscale features that visible-light imaging cannot reproduce. Exosens i2Nocturn and iNocturn intensified cameras use a double microchannel plate configuration across 190 nm to 300 nm for faint-signal wafer inspection and process development. Sony’s IMX487 supports 200 nm to 400 nm capture and enables a common sensor platform across UV camera suppliers.[1]Sony Semiconductor Solutions Group, “UV Image Sensor Technology,” Sony Semiconductor Solutions Group, sony-semicon.com. This standardization links the camera choice to the defect images used in downstream classification models. It also makes equipment uptime, calibration history, and software compatibility more central to purchasing decisions in the UV industrial imaging systems market. For leading fabrication facilities, lost wafer throughput during inspection downtime can be as consequential as the initial equipment cost. Suppliers are therefore under pressure to provide reliable calibration records and long-term software support. The hardware decision becomes a platform decision because its image quality can set the limit for future analytics performance.
Zero-Defect Manufacturing and Inline Quality Control
Full-coverage inline UV inspection is replacing periodic sampling in selected semiconductor, automotive, aerospace, and electronics operations. Onto Innovation described an AI-driven platform that achieved 95% fewer nuisance defects and 100% wafer-level coverage through inline filtering and whole-wafer classification.[2]Tang et al., “Vision-Based Automated Optical Inspection for Real-Time Quality Control,” The International Journal of Advanced Manufacturing Technology, link.springer.com. A 2026 study of mixed-product bottling lines reported 100% color and SKU accuracy with a hybrid deep-learning inspection system.[3]Various Authors, “Scalable AI-Driven Inspection for Inline Nuisance Filtering and Whole Wafer Pattern Classification,” SPIE Proceedings, spiedigitallibrary.org. These results support the use of automated inspection, where missed defects can create contractual, safety, or warranty exposure. Inline deployments also create defect-image libraries that become more useful as production data accumulates. This can increase switching costs because replacing equipment may also require rebuilding validated inspection data and workflows. In automotive and aerospace contracts, the financial impact of escaped defects is increasingly measurable. That moves inspection from an engineering expense toward a risk-management requirement. Faster approval of these systems can follow when the avoidance value is clear. It also gives manufacturers a reason to apply the same discipline across multiple production stages. In automotive and aerospace contracts, the financial impact of escaped defects is increasingly measurable. That moves inspection from an engineering expense toward a risk-management requirement. Faster approval of these systems can follow when the avoidance value is clear.
AI-Assisted Classification of Subvisible Surface Defects
AI helps address the difficulty of separating real submicron defects from artifacts in low-contrast UV images. A 2026 VCSEL inspection study reported 98.7% overall accuracy and reduced inspection time from 17.7 seconds to 1.5 seconds per unit. Aalborg University research also reported UV-C-guided mineral sorting with 76% classification accuracy and an 83.5% robotic actuation success rate on mixed magnesite waste. Suppliers that provide models for particular materials or defect types can reduce the time needed to deploy an inspection application. Their offerings are less dependent on a customer’s internal machine-vision resources. Rare defect classes remain difficult to capture in normal production. Synthetic defect generation is being considered as a way to create additional training examples. This could reduce the time needed to validate applications for new product shapes and materials. Research on synthetic defect generation also addresses the limited availability of rare-defect images. This makes software libraries an important differentiator within the UV industrial imaging systems market. A supplier with tested models can shorten the deployment period from months to weeks. This reduces the need for customers to build internal image-labeling and model-development capabilities. It also raises the importance of the depth and range of the supplier’s defect library.
UV-Selective Sorting and Material Identification
UV imaging can expose material differences that are not apparent under visible illumination. A 2025 Journal of Fluorescence study used laser-induced fluorescence and hyperspectral reflectance to distinguish white polyamide from visually similar wood and oxidized metal. A Microchemical Journal study reported full tablet-face composition mapping in under 4 milliseconds and stated that the method was 285,000 times faster than Raman chemical imaging for the same field of view. Sony designed the IMX487 for high-speed sorting, with global-shutter capture at up to 193 fps. These capabilities are relevant to recycling, pharmaceutical verification, authentication, and agricultural quality grading. Reference installations in recycling can give suppliers application data that later entrants will not have. That data can shape customer confidence and system specifications over time. This supports a longer-term opportunity in the UV industrial imaging systems market. Recycling facilities must accurately identify materials when visual sorting cannot distinguish their composition. Pharmaceutical users can also apply the method to content verification without invasive sampling. These uses broaden demand beyond the semiconductor applications that historically anchored UV imaging.
Restraints Impact Analysis*
| Restraint | (~) % Impact on CAGR Forecast | Geographic Relevance | Impact Timeline |
|---|---|---|---|
| High Cost of UV-Optimized Optics and Sensors | -1.2% | Global, strongest in price-sensitive South and Southeast Asian and African markets | Short term (≤ 2 years) |
| Accelerated Obsolescence of UV Sensor Platforms | -0.8% | Global, with early effects in North America and Europe | Medium term (2-4 years) |
| UV Calibration, Safety, and Operator-Qualification Burden | -0.5% | Global, most severe where specialist technical workforce capacity is limited | Short term (≤ 2 years) |
| Limited Benchmark Datasets for UV Defect Classification | -0.4% | Global, most acute in AI-dependent system deployments | Long term (≥ 4 years) |
| Source: Mordor Intelligence | |||
High Cost of UV-Optimized Optics and Sensors
Optics that transmit wavelengths below 350 nm require materials and manufacturing processes that raise system costs. Fused silica and calcium fluoride components require precise polishing and controlled production environments. JENOPTIK opened a EUR 100 million micro-optics facility in Dresden in May 2025, reported as USD 109 million, illustrating the investment required for UV-grade capacity. UV-enhanced CMOS sensors also require specialized coatings, windows, and fabrication steps. These requirements limit yields and keep their cost above that of comparable visible-light arrays. The result is a two-tier pattern in the UV industrial imaging systems market, where large fabs and utilities can justify purchases more readily than cost-sensitive buyers. Suppliers are concentrated across Germany, Japan, and the United States for qualified deep-UV optical components. Capacity constraints can therefore create procurement risk in addition to higher equipment prices. Broader adoption depends on sensor designs with simpler optical requirements and better manufacturing yields.
Accelerated Obsolescence of UV Sensor Platforms
UV-sensitive CMOS architectures are changing quickly, which can shorten the useful economic life of installed equipment. The IMX487 has become a common current-generation platform among UV industrial camera vendors. This improves adoption but can widen the capability gap with earlier UV-enhanced CCD and CMOS systems. Buyers who installed systems between 2021 and 2023 may face a meaningful difference in sensor capability. The difference can affect the data formats and classifier performance available in their automated factories. This makes capital planning more difficult for mid-sized end users. Buyers with earlier equipment can face compatibility issues involving analytics, software updates, image formats, and factory automation systems. Mid-sized users may therefore prefer integration contracts that place replacement risk with the supplier. Vendors with modular upgrades and multigeneration software support are better positioned to reduce this concern. Earlier equipment can have limited resale value when it cannot meet current imaging and software requirements. This places more pressure on vendors to offer defined upgrade paths. It can also shift revenue toward ongoing service arrangements rather than one-time hardware sales.
*Our forecasts treat driver/restraint impacts as directional, not additive. The impact forecasts reflect baseline growth, mix effects, and variable interactions.
Segment Analysis
By Offering Type: Software Platforms Reshape Hardware-Led Revenue Models
UV cameras held 38.21% of the offering type segment in 2025. The imaging device remains central to system procurement because it determines sensitivity, resolution, speed, and data quality. UV lenses, filters, and windows form a capital-intensive accessory category. High-purity fused silica components for sub-350 nm uses can involve premium pricing and longer lead times. That creates a second cost exposure when buyers focus only on the camera price. LED illumination has replaced many mercury arc lamp applications. LED sources lower power use, extend operating life, and allow wavelength selection for UV-A, UV-B, or UV-C inspection tasks. Image-acquisition hardware also determines whether high-resolution cameras can transfer data at production-line speeds. The UV industrial imaging systems industry increasingly requires 5GigE and 10GigE interfaces for those higher-throughput applications. Services and integration are becoming more important, where buyers select a complete validated system instead of individual components.
Software and analytics is projected to expand at a 7.66% CAGR through 2031. The shift reflects movement from fixed threshold processing toward learning-based classification that can be retrained as products, materials, and defect categories change. A 2025 review found that AI visual inspection has viable applications in industrial classification, detection, and segmentation MDPI. This supports the use of UV-specific analytics rather than generic machine-vision tools alone. The UV industrial imaging systems market is therefore becoming more dependent on the ability to translate images into repeatable decisions. Hardware sensitivity remains necessary, but it does not replace application-specific analysis. Subscription-based analytics can help suppliers reduce reliance on irregular equipment purchase cycles. The approach can also strengthen customer retention through continuing software support and model improvement. Services and integration revenue can benefit when automotive, aerospace, and pharmaceutical buyers select turnkey systems. Such contracts can make technology adoption more manageable for firms without specialized imaging teams. They can also transfer some technology-update responsibility from the end user to the system provider. This model can increase recurring participation in the UV industrial imaging systems market.



By Spectral Range: UV-A’s Installed Base Masks UV-C’s Structural Momentum
UV-A imaging held 53.46% of the spectral range segment in 2025. Commercially available fused silica optics and industrial LED sources support its broad use across manufacturing, forensic work, and food inspection. UV-A fluorescence applications can operate with established industrial camera platforms. UV-B serves narrower tasks, including photovoltaic backsheet chemistry analysis and certain pharmaceutical fluorescence assessments. Its wavelengths can reveal signatures that UV-A or UV-C systems do not show with equal contrast. These application-specific differences keep UV-B relevant despite its smaller role. Solar manufacturers use wavelength selection to identify degradation and material characteristics that are difficult to examine with visible light. UV-A remains the practical choice where broad availability and established component compatibility matter most. Its installed base reflects the ability to configure illumination, optics, and camera platforms for many fluorescence tasks. Buyers can use it for automotive, food, and pharmaceutical inspection without the component requirements associated with deep-UV equipment. That flexibility supports its continued leading position in the UV industrial imaging systems market.
UV-C imaging is projected to expand at a 7.78% CAGR through 2031. Semiconductor inspection at 193 nm and 266 nm needs short wavelengths for sensitivity to defects below 150 nm. Utility inspection also benefits from the 220 nm to 280 nm sun-blind band, which reduces interference from sunlight. A 2026 study of UAV-based ultraviolet imaging for 220 kV equipment reported more than 90% identification of early-stage discharge defects. Exosens offers the i2Nocturn intensified camera across 190 nm to 300 nm with 1936×1216 resolution and single-photon sensitivity. These specifications suit wafer inspection and corona detection where light levels are low. UV-C solutions remain more demanding in optics and cost. Their performance advantage is strongest where short wavelengths or daytime outdoor use are essential. This makes their value proposition more specialized than that of UV-A equipment. The UV industrial imaging systems market can therefore support distinct spectral product strategies.
By Imaging Technology: Conventional Platforms Stabilize While Hyperspectral Disrupts Adjacencies
Conventional UV imaging held 64.16% of the imaging technology segment in 2025. Its installed base is supported by wafer surface inspection, material identification, and quality control uses with defined defect targets. Single-band area-scan capture is adequate when the relevant spectral signature is known. This keeps conventional platforms suitable for many repeatable production tasks. Intensified UV imaging addresses tasks with very low photon flux. These include single-photon corona detection, dark-field wafer inspection, and time-resolved scientific imaging. Exosens, Lambert Instruments, and similar specialists serve these demanding applications. Multispectral systems select a limited group of wavelength bands for tablet fingerprinting, document verification, and fluorescent-ink detection. This can preserve relevant chemical information while avoiding the processing requirements of continuous spectral capture. It is useful where a small group of molecular absorption or emission peaks carries the needed identification signal. Full hyperspectral bandwidth can be unnecessary in those cases. The choice between conventional, multispectral, intensified, and hyperspectral approaches is therefore tied to the inspection problem, not only to camera capability.
Hyperspectral UV imaging is projected to expand at a 7.92% CAGR through 2031. Detector arrays can capture continuous spectral bands across the UV range during production-speed acquisition. Headwall Photonics states that UV hyperspectral imaging detects material signatures tied to UV molecular interactions that can be invisible in visible or NIR imaging. This supports coating analysis, semiconductor inspection, food ingredient verification, and forensic identification. Vieworks demonstrated UV, NIR, and SWIR cameras at SPIE Photonics West 2025. Its demonstrations included detection of food contaminants and material defects not visible with standard cameras. The UV industrial imaging systems industry can use hyperspectral systems where a broad spectral record has more value than a single fluorescence response. The tradeoff is higher processing complexity and application-specific integration needs. These requirements can favor suppliers with established spectral-analysis capabilities. They also broaden the addressable work of the UV industrial imaging systems market.
By Camera Format: Area-Scan Dominance Reflects Production-Line Architecture
Area-scan cameras held 48.52% of the camera format segment in 2025. They are widely used at stationary inspection points with a bounded field of view. Fixed inspection stations can also control UV illumination more precisely than moving field environments. Line-scan cameras support continuous-web and high-speed conveyor applications. Flexible electronics, packaging, and solar-material inspection can reconstruct two-dimensional images from successive line captures. Scientific and cooled cameras serve lower-volume tasks that need longer exposures and low dark-current noise. Research institutes, forensic laboratories, and pharmaceutical instruments are typical users. These formats support trace UV fluorescence detection, where speed is secondary to signal quality.
High-speed cameras are projected to expand at a 7.83% CAGR through 2031. Semiconductor UV cure monitoring, laser ablation control, and chip sorting require time-resolved capture at kilohertz-level frame rates. Basler’s ace 2 X UV family uses Sony’s IMX487 sensor and provides 8.1 megapixels across 200 nm to 400 nm. The cameras provide 5GigE and USB3.0 options for industrial automation integration. Portable and handheld system demand also increases the need for compact and low-power camera modules. Those requirements differ from fixed, rack-integrated production-line systems. The opportunity for suppliers is to adapt optical, power, and handling design for field technicians. This creates a product-development path not fully addressed by mainstream area-scan products. Field systems need handling characteristics that differ from fixed-mount cameras. They also need practical power management and rugged construction for maintenance environments. These design choices can determine whether UV imaging fits a technician’s routine workflow. They can expand the practical reach of the UV industrial imaging systems market.
By End User: Electronics Anchors Demand While Utilities Expand the Perimeter
Electronics and semiconductor manufacturers held 30.44% of the end-user segment in 2025. UV inspection is used across advanced wafer production, from surface cleanliness checks to post-etch pattern review. Pharmaceutical and life sciences users are another important group of users. A 2025 Microchemical Journal study reported tablet-surface coverage in under 4 milliseconds. It also reported a 4.59% relative prediction error in determining active pharmaceutical ingredients using principal component analysis. Good Manufacturing Practice requirements affect when pharmaceutical users can replace established tests with inline UV methods. Automotive users use UV imaging for coating uniformity, fluorescent leak detection, and adhesive bead inspection. Aerospace and defense users employ fluorescent penetrant testing and composite delamination inspection under safety-critical procedures.
Utilities and electrical network operators are projected to expand at a 7.44% CAGR through 2031. Early detection of corona can help grid operators reduce the risk of unplanned transmission outages. UAV-mounted UV-C cameras also enable inspection of energized high-voltage assets without placing personnel nearby. Food, beverage, and consumer-goods producers use UV-A imaging for hygiene checks, aflatoxin screening, and packaging-authentication marks. Their system choices often depend on how easily UV equipment connects with existing visible-light conveyor lines. Environmental and forensic laboratories use cooled scientific cameras for trace-substance and document analysis. These specialist uses can command higher selling prices for suppliers. The UV industrial imaging systems market therefore combines high-volume factory applications with smaller, technically demanding niches. Each group has different criteria for imaging sensitivity, integration, and workflow design. Factory users prioritize repeatability and throughput. Laboratory users may place greater weight on low noise and precise fluorescence detection.
By System Configuration: Integrated Platforms Hold Share, Portable Systems Capture New Use Cases
Integrated machine vision systems held 36.39% of the system configuration segment in 2025. OEM machine builders favor assemblies that combine camera, illumination, optics, and analytics in one validated package. A unified system can be warranted and serviced as a single unit. Modular OEM platforms serve equipment makers that need custom form factors for individual semiconductor process steps. They may connect inspection data to fab execution or manufacturing execution systems through application programming interfaces. Fixed inline systems suit film, foil, glass, and printed circuit board production. They operate continuously for UV cure verification and contamination detection. Continuous processes cannot readily depend on offline sampling when defects must be found at line speed. Integrated designs can combine the imaging components with analytics that have already been validated for the equipment. That helps machine builders manage warranty, service, and installation requirements through a single package. Standalone cameras remain suitable for incoming material qualification and failure analysis. These options give the UV industrial imaging systems market a mix of factory-integrated and point-of-use demand.
Portable and handheld systems are projected to expand at a 7.58% CAGR through 2031. Utilities, aerospace maintenance depots, and solar farms require inspection where equipment cannot be moved to a fixed station. Research on quadruped robots with UV cameras reported more than 90% early-stage defect identification on 220 kV substation equipment. Lightweight systems can bring partial-discharge detection closer to field-maintenance workflows. Their value proposition centers on operational risk reduction, rather than factory yield improvement. They also introduce UV imaging to facilities teams and technicians who have not traditionally bought machine-vision equipment. Portable tools can place inspection decisions closer to the point of maintenance. This changes the buyer group from centralized production engineering to field operations. The system must therefore deliver results that can be interpreted without extensive photonics training. Clear workflows can support broader operational adoption. Suppliers must therefore consider portability, battery use, ruggedization, and straightforward severity scoring. These needs can favor systems that simplify photonics interpretation for non-specialist users.
Geography Analysis
Asia-Pacific held 38.92% of the UV industrial imaging systems market share in 2025. The region combines major semiconductor fabs, solar-cell factories, and consumer-electronics assembly operations in China, South Korea, Taiwan, and Japan. The concentration of production lines provides repeated inspection applications across several industries. This creates a sizable base for component suppliers and system integrators. It also links regional demand to the investment cycles of semiconductor and solar manufacturing. India is emerging as a secondary center through government-backed electronics manufacturing incentives. Japan and South Korea serve as both end markets and important sources of UV components. South America remains earlier stage, with demand in agricultural fluorescence inspection, oil and gas monitoring, and packaging authentication.
North America held a significant share in 2025, supported by aerospace, defense, pharmaceutical, semiconductor, and utility applications. Advanced-node fabs are important buyers of intensified and deep-UV inspection systems. The region also has a concentration of software developers that can support integrated UV-AI deployments. Europe combines demand for industrial inspection with precision-optics supply, including JENOPTIK’s expanded Dresden micro-optics capacity.
The Middle East and Africa is projected to expand at a 7.93% CAGR through 2031. Solar energy investment and grid modernization across the region support demand. Africa’s current demand is concentrated in South African mining and power operations. Wider adoption will depend on regional industrial policies and export-manufacturing quality requirements. Field conditions also make dust protection and durable systems important for solar and utility deployments. Suppliers that combine imaging hardware with simple analysis tools can reduce implementation barriers. This is particularly relevant where specialist inspection skills are limited. These conditions can shape the pace at which the UV industrial imaging systems market develops across the region. The same conditions may favor suppliers that offer complete field-ready systems and direct technical support.

Competitive Landscape
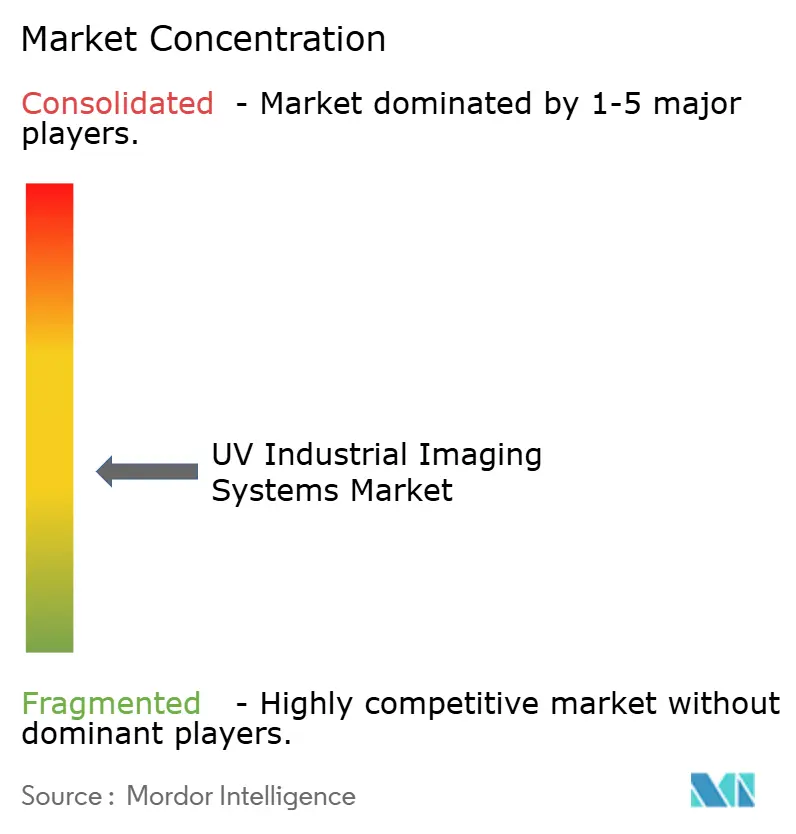
The UV industrial imaging systems market is moderately fragmented. Basler, Allied Vision, IDS Imaging Development Systems, JAI, Baumer, and Omron Sentech compete across broad UV camera applications. Exosens, Raptor Photonics, Lambert Instruments, and PCO focus on high-sensitivity applications with low photon flux and deep-UV needs. Platform suppliers compete through application range and analytics integration. Specialists compete through sensitivity, calibration traceability, and performance below 250 nm. The two groups serve different priorities, from repeatable production inspection to challenging low-light measurements. This creates room for both generalist platforms and specialized photonics suppliers. No single company is presented as dominant across the full set of applications. This leaves the UV industrial imaging systems market open to both broad platforms and specialists.
Teledyne announced a pending acquisition of Varex Imaging in August 2026 for USD 1.1 billion. The planned deal broadens Teledyne’s imaging portfolio across X-ray tubes, digital flat-panel detectors, photon-counting technologies, and software. Exosens has advanced its wafer-inspection positioning through technical material on UV dark-field imaging at advanced semiconductor nodes. Basler’s UV camera portfolio uses the IMX487 platform for high-resolution industrial imaging. These moves show that supplier competition extends from specialized optics and sensors to application support and system integration. Vendors are combining camera performance with software compatibility and application knowledge. This can help them address the full workflow, rather than only the image-capture stage. The approach is relevant where customers want accountable, validated inspection systems. It is a central competitive requirement in the UV industrial imaging systems market.
AI-focused inspection software providers can enter the field by partnering with hardware vendors instead of manufacturing sensors. Emergent Vision and SVS-Vistek compete around high-speed interfaces for semiconductor and flat-panel display inspection. OFIL Systems and UViRCO focus on portable UV corona detection for utilities. Additive manufacturing remains an open application area for layer-level UV surface verification. Polymer and metal powder-bed processes have limited established UV inspection coverage. Their quality requirements could create a future application for layer-by-layer analysis. The opportunity remains open because no established supplier has been identified as serving it at commercial scale.
UV Industrial Imaging Systems Industry Leaders
Basler AG
Teledyne Technologies Incorporated
Hamamatsu Photonics K.K.
Allied Vision Technologies GmbH
JAI A/S
- *Disclaimer: Major Players sorted in no particular order

Recent Industry Developments
- August 2026: Teledyne Technologies Incorporated and Varex Imaging Corporation announced a definitive all-cash merger agreement valued at USD 1.1 billion. The transaction is expected to close in early 2027, subject to regulatory approvals and a Varex stockholder vote.
- January 2026: Exosens SE showcased its intensified i2Nocturn UV-C camera series and launched the Cricket Pro image intensifier adapter at SPIE Photonics West 2026 in San Francisco. The Cricket Pro supports 18 mm or 25 mm active-area image intensifiers across 130 nm to 900 nm.
- May 2025: JENOPTIK inaugurated a EUR 100 million (USD 109 million) micro-optics production facility in Dresden, Germany. The facility expanded capacity for high-precision UV-compatible optics used in semiconductor lithography inspection, medical laser applications, and UV industrial imaging systems.
- January 2025: Vieworks Co., Ltd. highlighted its UV, NIR, and SWIR industrial camera lineup at SPIE Photonics West 2025 in San Francisco. The company demonstrated UV cameras for hidden food contaminants and material defects that were not visible with visible-light systems.


Global UV Industrial Imaging Systems Market Report Scope
UV Industrial Imaging Systems Market refers to specialized cameras and imaging solutions that capture and analyze ultraviolet (UV) light, typically in the 10 to 400 nm range, for non-contact inspection, defect detection, and process monitoring in industrial environments. These systems include UV-sensitive area and line-scan cameras, lenses, filters, illumination, and integrated inspection platforms optimized for near-UV, mid-UV, and deep/far-UV bands.
The UV Industrial Imaging Systems Market Report is Segmented by Offering Type (UV Cameras, UV Lenses, Filters, and Optical Windows, UV Illumination and Excitation Sources, Image Acquisition Hardware, Software and Analytics, and Services and Integration), Spectral Range (UV-A Imaging, 315-400 nm, UV-B Imaging, 280-315 nm, and UV-C Imaging, 100-280 nm), Imaging Technology (Intensified UV Imaging, Multispectral UV Imaging, Hyperspectral UV Imaging, and Conventional UV Imaging), Camera Format (Area-Scan Cameras, Line-Scan Cameras, High-Speed Cameras, and Scientific and Cooled Cameras), End User (Electronics and Semiconductor Manufacturers, Utilities and Electrical Network Operators, Automotive and Transportation Manufacturers, Aerospace and Defense Organizations, Pharmaceutical and Life Sciences Organizations, Food, Beverage, and Consumer Goods Manufacturers, Research Institutes and Universities, and Environmental and Forensic Laboratories), System Configuration (Standalone Camera Systems, Integrated Machine Vision Systems, Modular OEM Imaging Platforms, Portable and Handheld Systems, and Fixed Inline Inspection Systems), and Geography (North America, South America, Europe, Asia-Pacific, Middle East and Africa). The Market Forecasts are Provided in Terms of Value (USD).
| UV Cameras |
| UV Lenses, Filters, and Optical Windows |
| UV Illumination and Excitation Sources |
| Image Acquisition Hardware |
| Software and Analytics |
| Services and Integration |
| UV-A Imaging, 315-400 nm |
| UV-B Imaging, 280-315 nm |
| UV-C Imaging, 100-280 nm |
| Intensified UV Imaging |
| Multispectral UV Imaging |
| Hyperspectral UV Imaging |
| Conventional UV Imaging |
| Area-Scan Cameras |
| Line-Scan Cameras |
| High-Speed Cameras |
| Scientific and Cooled Cameras |
| Electronics and Semiconductor Manufacturers |
| Utilities and Electrical Network Operators |
| Automotive and Transportation Manufacturers |
| Aerospace and Defense Organizations |
| Pharmaceutical and Life Sciences Organizations |
| Food, Beverage, and Consumer Goods Manufacturers |
| Research Institutes and Universities |
| Environmental and Forensic Laboratories |
| Standalone Camera Systems |
| Integrated Machine Vision Systems |
| Modular OEM Imaging Platforms |
| Portable and Handheld Systems |
| Fixed Inline Inspection Systems |
| North America | United States | |
| Canada | ||
| Mexico | ||
| South America | Brazil | |
| Argentina | ||
| Rest of South America | ||
| Europe | Germany | |
| France | ||
| United Kingdom | ||
| Italy | ||
| Spain | ||
| Rest of Europe | ||
| Asia-Pacific | China | |
| Japan | ||
| South Korea | ||
| India | ||
| Taiwan | ||
| Rest of Asia-Pacific | ||
| Middle East and Africa | Middle East | Saudi Arabia |
| United Arab Emirates | ||
| Turkey | ||
| Rest of the Middle East | ||
| Africa | South Africa | |
| Nigeria | ||
| Rest of Africa | ||
| By Offering Type | UV Cameras | ||
| UV Lenses, Filters, and Optical Windows | |||
| UV Illumination and Excitation Sources | |||
| Image Acquisition Hardware | |||
| Software and Analytics | |||
| Services and Integration | |||
| By Spectral Range | UV-A Imaging, 315-400 nm | ||
| UV-B Imaging, 280-315 nm | |||
| UV-C Imaging, 100-280 nm | |||
| By Imaging Technology | Intensified UV Imaging | ||
| Multispectral UV Imaging | |||
| Hyperspectral UV Imaging | |||
| Conventional UV Imaging | |||
| By Camera Format | Area-Scan Cameras | ||
| Line-Scan Cameras | |||
| High-Speed Cameras | |||
| Scientific and Cooled Cameras | |||
| By End User | Electronics and Semiconductor Manufacturers | ||
| Utilities and Electrical Network Operators | |||
| Automotive and Transportation Manufacturers | |||
| Aerospace and Defense Organizations | |||
| Pharmaceutical and Life Sciences Organizations | |||
| Food, Beverage, and Consumer Goods Manufacturers | |||
| Research Institutes and Universities | |||
| Environmental and Forensic Laboratories | |||
| By System Configuration | Standalone Camera Systems | ||
| Integrated Machine Vision Systems | |||
| Modular OEM Imaging Platforms | |||
| Portable and Handheld Systems | |||
| Fixed Inline Inspection Systems | |||
| By Geography | North America | United States | |
| Canada | |||
| Mexico | |||
| South America | Brazil | ||
| Argentina | |||
| Rest of South America | |||
| Europe | Germany | ||
| France | |||
| United Kingdom | |||
| Italy | |||
| Spain | |||
| Rest of Europe | |||
| Asia-Pacific | China | ||
| Japan | |||
| South Korea | |||
| India | |||
| Taiwan | |||
| Rest of Asia-Pacific | |||
| Middle East and Africa | Middle East | Saudi Arabia | |
| United Arab Emirates | |||
| Turkey | |||
| Rest of the Middle East | |||
| Africa | South Africa | ||
| Nigeria | |||
| Rest of Africa | |||


Key Questions Answered in the Report
What is the size of the UV industrial imaging systems market?
The UV industrial imaging systems market was valued at USD 530.38 million in 2025 and is estimated at USD 563.61 million in 2026. It is projected to reach USD 800.69 million by 2031.
What is driving demand for UV industrial imaging systems?
Semiconductor defect detection, inline quality control, AI-assisted classification, selective material sorting, solar inspection, and electrical-discharge detection support demand.
Which spectral range leads UV industrial imaging applications?
UV-A imaging held 53.46% of the spectral range segment in 2025, supported by its established optics, LEDs, and fluorescence applications.
Which end users are expanding fastest for UV imaging?
Utilities and electrical network operators are projected to expand at a 7.44% CAGR through 2031, led by corona and partial-discharge inspection.
Which region is expanding fastest for UV industrial imaging systems?
The Middle East and Africa is projected to expand at a 7.93% CAGR through 2031, supported by solar investment and grid modernization.
Why are portable UV imaging systems becoming more relevant?
Portable systems enable field inspection of power infrastructure, aerospace assets, and solar farms that cannot be moved to fixed inspection stations.
Page last updated on:





