
Market Overview
| Study Period | 2020 - 2031 |
|---|---|
| Forecast Data Period | 2026 - 2031 |
| Base Year Market Size (2025) | USD 12.89 Billion |
| Market Size (2026) | USD 13.64 Billion |
| Market Size (2031) | USD 18.56 Billion |
| Growth Rate (2026 - 2031) | 6.36 % |
| Market Concentration | Medium |
Major Players *Disclaimer: Major Players sorted in no particular order Image © Mordor Intelligence. Reuse requires attribution under CC BY 4.0. | |
United States Endoscopy Devices Market Analysis by Mordor Intelligence
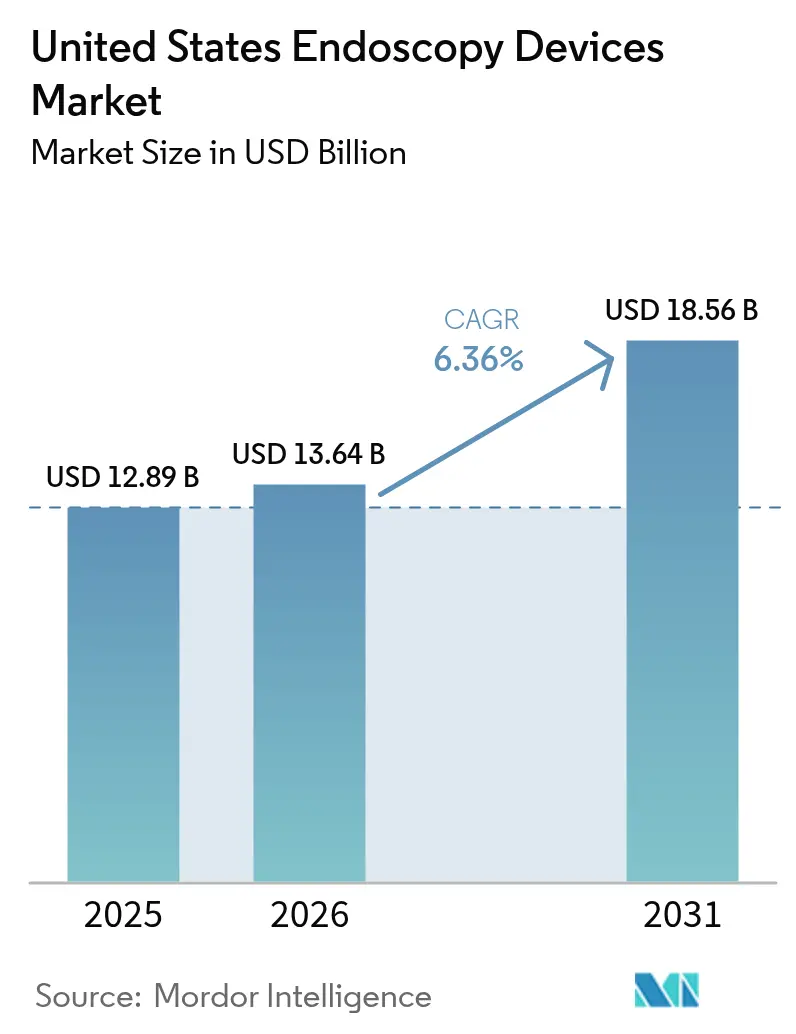
The United States Endoscopy Devices Market size is expected to increase from USD 12.89 billion in 2025 to USD 13.64 billion in 2026 and reach USD 18.56 billion by 2031, growing at a CAGR of 6.36% over 2026-2031.
A larger pool of Medicare-age adults, rapid uptake of AI-assisted 4K visualization, and payer support for outpatient procedures are replacing simple procedure-volume growth as the main value drivers. Hospitals are retiring standard-definition towers and buying premium imaging bundles that reduce reprocessing risk and raise adenoma-detection rates, while ambulatory surgical centers are choosing compact single-use scopes to avoid autoclave costs. Medicaid parity for disposables and a new Medicare add-on for AI polyp detection further strengthen equipment demand. At the same time, mounting environmental scrutiny of single-use plastic and high capital outlays for robotic systems temper the outlook, giving vendors an incentive to introduce pay-per-procedure subscription models that shift spending from capital to operating budgets.
Key Report Takeaways
- By device type, endoscopes held 55.02% of the United States endoscopy devices market share in 2025, whereas visualization and documentation equipment is forecast to accelerate at an 10.82% CAGR through 2031.
- By application, gastroenterology accounted for a 48.06% share of the United States endoscopy devices market size in 2025 and gynecology is poised to advance at a 9.67% CAGR to 2031.
- By usability, reusable systems sustained a 67.92% share in 2025 while single-use alternatives are set to expand at a 13.45% CAGR through 2031.
- By end user, hospitals commanded 72.38% of revenue in 2025 and ASCs are projected to register the fastest rise at an 8.61% CAGR.
Note: Market size and forecast figures in this report are generated using Mordor Intelligence’s proprietary estimation framework, updated with the latest available data and insights as of 2026.
United States Endoscopy Devices Market Trends and Insights
Drivers Impact Analysis*
| Driver | (~) % Impact on CAGR Forecast | Geographic Relevance | Impact Timeline |
|---|---|---|---|
| Rising Prevalence of GI & Colorectal Cancers | +1.2% | National, with elevated incidence in Southern and Midwestern states | Medium term (2-4 years) |
| Advances in HD & AI-Assisted Imaging Platforms | +1.5% | National, concentrated in academic medical centers and large hospital systems | Short term (≤ 2 years) |
| Outpatient Shift to ASCs for Minimally Invasive Endoscopy | +1.1% | National, with accelerated adoption in Florida, Texas, and California | Medium term (2-4 years) |
| Aging Population Driving Procedure Volumes | +0.9% | National, with highest impact in Sun Belt retirement destinations | Long term (≥ 4 years) |
| Medicaid Policy Boosts for Disposable Scopes | +0.7% | National, with state-level variation in Medicaid reimbursement schedules | Short term (≤ 2 years) |
| Expansion of Ambulatory Surgical Centers Boosting Outpatient Endoscopy Volumes | +1.0% | National, with fastest growth in suburban and exurban markets | Medium term (2-4 years) |
| Source: Mordor Intelligence | |||
Rising Prevalence of GI & Colorectal Cancers
Colorectal cancer produced 147,931 new U.S. cases in 2022, and the screening age now begins at 45.[1]National Institute of Diabetes and Digestive and Kidney Diseases, “Indications & Outcomes of Gastrointestinal Endoscopy,” niddk.nih.gov The change expands eligibility by about 19 million adults. Evening and weekend colonoscopy sessions are therefore common, which pushes practices to purchase durable, flexible scopes and automated washers that process 8 to 10 cases a day. The National Cancer Institute dedicated USD 274 million to colorectal research in fiscal 2024, signaling bipartisan backing for early detection. These forces together lift demand across the endoscopy devices market.
Advances in HD & AI-Assisted Imaging Platforms
Fujifilm’s CAD EYE joined three FDA-cleared AI modules in January 2024 and raised adenoma-detection rates by 8-12 percentage points. CMS added CPT 0596T in January 2025, which reimburses USD 175 per colonoscopy that incorporates AI, offsetting the typical software license fee.[2]Centers for Medicare & Medicaid Services, “CY 2025 Physician Fee Schedule Final Rule,” cms.gov Pentax launched a 4K tower in March 2024, offering twice the pixel count of HD, enabling physicians to confirm lesion margins more quickly. Bundled 4K-plus-AI systems cost USD 150,000-180,000, but hospitals justify the premium with fewer missed lesions and higher throughput. These upgrades accelerate the replacement cycle and expand the endoscopy devices market.
Outpatient Shift to Ambulatory Surgical Centers for Minimally Invasive Endoscopy
Medicare listed 6,153 certified ambulatory surgical centers in 2022, and endoscopy accounted for 38% of their caseload. CMS raised ASC reimbursement by nearly 3% for key GI codes in the 2025 rule. Private-equity chains expanded endoscopy capacity by double digits in 2024. Single-use bronchoscopes and ureteroscopes eliminate on-site sterilization, cutting overhead by up to USD 75,000 per room each year. These economies strengthen outpatient purchasing and raise overall equipment turnover in the endoscopy devices market.
Aging Population Driving Procedure Volumes
Adults aged 65 and older will top 73 million by 2030. This group experiences a 4.5-fold higher rate of GI disease and requires surveillance endoscopy every one to three years. Pulmonology demand also grows: 14.5 million Americans met lung-screening criteria in 2024, though fewer than 6% underwent the needed bronchoscopy follow-up. Medicare Advantage plans now waive copays for screening colonoscopies, which keeps procedure volumes rising. The demographic swell broadens the endoscopy devices market base for the next decade.
Restraints Impact Analysis*
| Restraint | (~) % Impact on CAGR Forecast | Geographic Relevance | Impact Timeline |
|---|---|---|---|
| High Capital Cost of Robotic / 4K Platforms | -0.8% | National, with pronounced impact on rural and critical-access hospitals | Short term (≤ 2 years) |
| Stringent FDA Re-Processing Compliance | -0.5% | National, affecting hospitals with legacy reprocessing infrastructure | Medium term (2-4 years) |
| Sustainability Pushback on Single-Use Plastic Waste | -0.3% | Concentrated in California, Oregon, and Northeast states with extended producer responsibility legislation | Long term (≥ 4 years) |
| High Capital & Lifecycle Maintenance Costs of Advanced Endoscopic Systems | -0.6% | National, with disproportionate burden on independent physician practices | Medium term (2-4 years) |
| Source: Mordor Intelligence | |||
High Capital Cost of Robotic / 4K Platforms
Intuitive Surgical’s Ion robot lists at USD 500,000-1 million and reached only 382 U.S. installs by December 2024, representing roughly 6% hospital penetration. Medtronic’s Hugo system cuts entry cost to USD 350,000 but still demands annual service near USD 80,000, raising five-year ownership above USD 750,000. Rural sites relying on cost-based Medicare payment rarely recover these sums, and 68% deferred new endoscopy purchases in 2024. High sticker prices, therefore, cap uptake and trim overall momentum in the endoscopy devices market.
Stringent FDA Re-Processing Compliance
FDA guidance now requires culture surveillance and detailed logs for duodenoscope reprocessing, adding USD 15,000-25,000 per scope each year. AAMI ST91 pushes hospitals to install automated washers with traceability, costing USD 150,000-250,000 per suite.[3]Association for the Advancement of Medical Instrumentation, “AAMI ST91 Flexible Endoscope Processing 2025,” aami.org In 2024, 11% of reprocessed ureteroscopes still failed culture tests despite adherence to the protocol. Compliance prompts many sites to consider disposables, yet the expense also slows full fleet renewal, creating a modest drag on the endoscopy devices market.
*Our forecasts treat driver/restraint impacts as directional, not additive. The impact forecasts reflect baseline growth, mix effects, and variable interactions.
Segment Analysis
By Device Type: Flexible Scopes Retain Lead while Operative Systems Accelerate
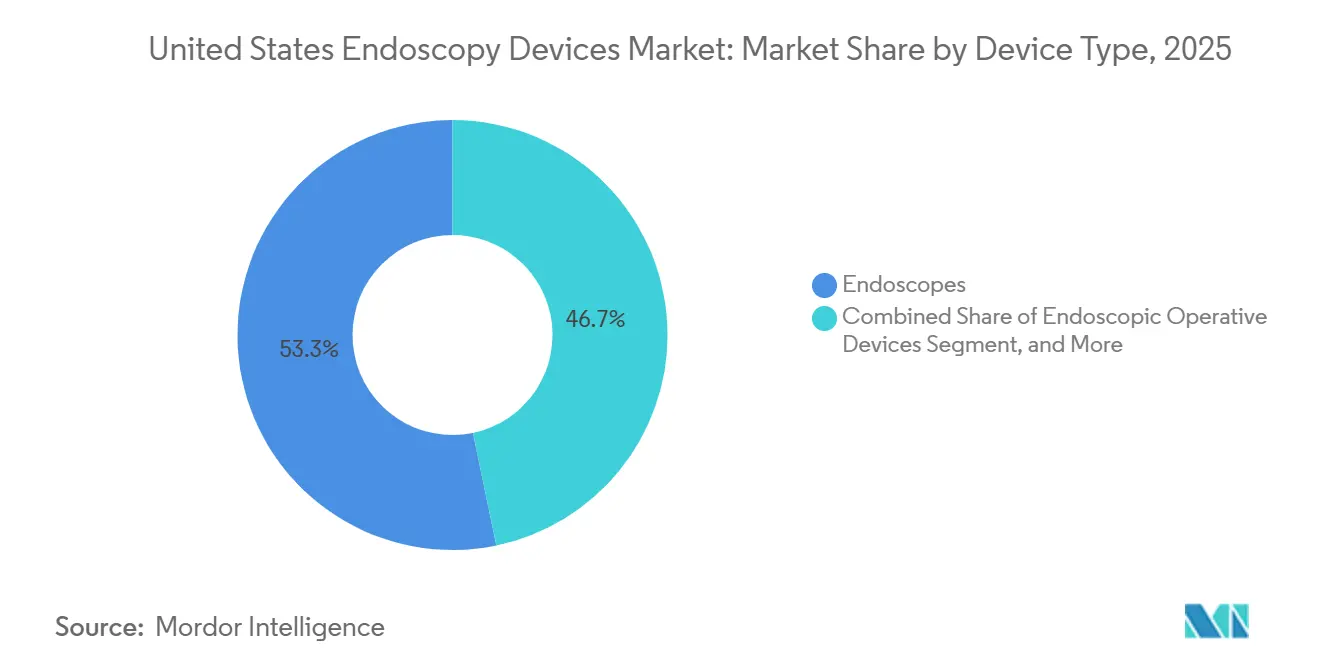
Endoscopes accounted for 53.27% of the 2025 revenue in the endoscopy devices market, anchored by flexible models that navigate tortuous GI and pulmonary anatomy and deliver high-definition video. Rigid scopes remain essential for laparoscopy and arthroscopy, but occupy a smaller share. Endoscopic operative devices are projected to rise at a 7.32% CAGR, outpacing the overall market, as surgeons adopt integrated insufflation and irrigation consoles that maintain stable pneumoperitoneum and shorten operative time. Capsule systems, such as Medtronic’s PillCam Crohn’s, address small-bowel imaging but still account for less than 3% of endoscopy device market share for this device type.
Visualization equipment is shifting from a one-time purchase to a lease model where providers pay a per-procedure fee that bundles 4K cameras and AI software updates. Standard-definition towers are being phased out, and major vendors now channel R&D into 4K and 8K prototypes. Accessories such as wound protectors show double-digit growth as single-incision techniques spread. Manual instruments remain profitable consumables; hospitals procure roughly 15-20 sets per suite each year to replace dull forceps and snares.



By Application: GI Dominates while Gynecology Surges
Gastrointestinal procedures commanded 44.73% of application revenue in 2025, supported by more than 15 million annual U.S. colonoscopies and robust upper GI surveillance, though growth moderates as screening compliance plateaus. Gynecology is the fastest-growing application, with a 7.69% CAGR, as office-based hysteroscopy expands for fibroid and polyp removal, backed by updated 2024 ACOG guidelines. Laparoscopic surgeries hold a mid-teens share, and adoption of robotic assistance continues to climb despite uncertain reimbursement parity.
Pulmonology benefits from lower lung-screen thresholds, with roughly 8% of low-dose CT findings requiring follow-up bronchoscopy. Urology advances as single-use ureteroscopes improve turnaround time, and Boston Scientific’s LithoVue reached 22% market share by 2024. ENT, neurology, and orthopedics remain smaller niches, yet chip-on-tip cameras and fluorescence imaging are gradually broadening their procedural mix.
By Usability: Reusables Dominate but Disposables Gain Ground
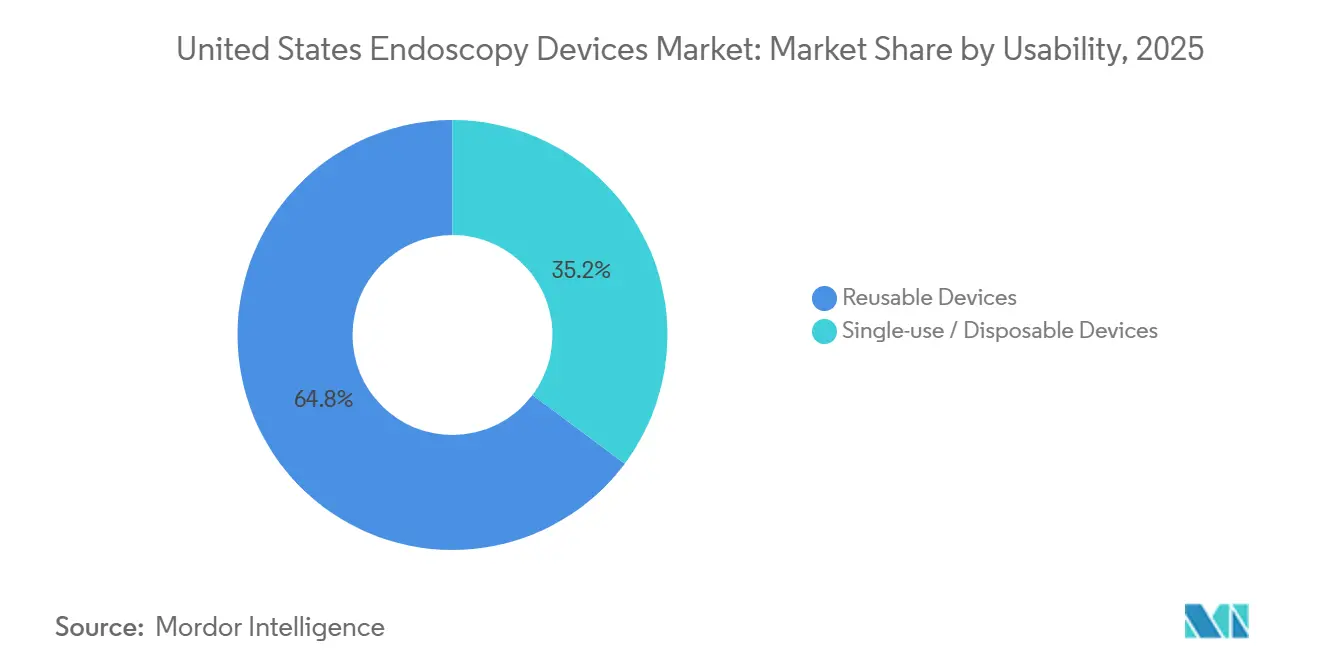
Reusable platforms accounted for 64.78% of 2025 sales in the endoscopy devices market. Hospitals keep scopes for five to seven years and pay annual service fees of USD 12,000-18,000 per unit. Single-use devices, however, are projected to grow at a 9.01% CAGR as infection-control mandates and total-cost-of-ownership analyses favor disposables in low-volume settings. Ambu shipped 1.2 million disposable bronchoscopes globally in 2024, with 58% of them landing in the United States. Boston Scientific’s Exalt D addresses the risk of elevator-channel contamination and had 340 U.S. installations by the end of 2024.
Total-cost-of-ownership studies show single-use scopes cost USD 150-300 per procedure, versus USD 2,500-4,000 annually to reprocess a reusable scope used 200 times, making disposables viable at 15-20 monthly cases. Sustainability remains unresolved: single-use scopes generate up to 2 kilograms of plastic waste per case, yet life-cycle studies that include autoclave energy are inconclusive.
By End-User: Hospitals Dominate while Specialty Clinics Accelerate
Hospitals captured 73.08% of 2025 spend, driven by complex procedures such as ERCP and therapeutic bronchoscopy, which require anesthesia backup and intensive care access. Specialty clinics are forecast to grow at an 11.01% CAGR because independent gastroenterology, urology, and pulmonology groups invest in office suites that promise same-day diagnosis. Ambulatory surgical centers, embedded within specialty-clinic figures, adopt cart-based endoscopy systems that cost 30% less than hospital towers.
A 2024 AUA survey showed 41% of office urologists had switched to single-use cystoscopes to avoid autoclave delays. Hospitals still hold advantages in high-risk cases and receive 40-60% higher reimbursement under the outpatient prospective payment schedule. Regulatory standards for emergency readiness add overhead to hospital suites yet support premium contracting that preserves their majority share of the endoscopy devices market.
Geography Analysis
Regional variations shape the U.S. endoscopy devices market. Sun Belt states such as Florida, Texas, and Arizona report the fastest growth in procedures, driven by retiree inflows and higher rates of GI disorders. Florida alone added 47 Medicare-certified ambulatory surgical centers in 2024, each privileging single-use scopes after a 2023 bronchoscope outbreak underscored infection risk.
California and New York face tighter capital budgets. Medi-Cal covers 14.5 million people and reimburses colonoscopies at 15-20% below Medicare, prompting practices to limit state-program volumes. At the same time, New York’s academic hospitals are adopting AI modules early; Massachusetts General Hospital raised adenoma-detection rates by 9.7 points after deploying Olympus’ EndoBRAIN in September 2024.
Midwest consolidation funnels complex endoscopy to urban hubs as many rural hospitals close suites or shift to outpatient-only models. The National Rural Health Association estimates 23% of rural counties lack a gastroenterologist and rely on capsule endoscopy read remotely to fill gaps. In the Pacific Northwest, extended producer responsibility laws create uncertainty about single-use device uptake.
Regulatory Landscape
Endoscopy devices in the United States are regulated by the US Food and Drug Administration (FDA), with many products routed through the 510(k) pathway under Class II controls. FDA classification activity has stayed active across GI and urology. The endoscopic pancreatic debridement device was classified into Class II with special controls (September 2024), the anchored esophageal sheath received a classification order (November 2025), and a final order in May 2026 required 510(k) premarket notification for endoscopic suturing devices used to alter gastric anatomy for weight loss.
Compliance requirements around manufacturing quality systems and reprocessing validation continue to shape purchasing and product design. In February 2026, FDA transitioned away from the Quality System Inspection Technique (QSIT) to a new inspection process for medical device manufacturing facilities, which increased the operational emphasis on inspection readiness. At the same time, FDA guidance on reprocessing validation and labeling, supported by healthcare infection-prevention bodies such as APIC and technical frameworks such as AAMI ST91, supports demand for traceability, documented cleaning instructions, and validated workflows for reusable scopes. This also influences adoption of single-use alternatives among facilities dealing with reprocessing audit pressure.
Competitive Landscape
The endoscopy devices market is moderately concentrated. Olympus, Boston Scientific, Medtronic, Karl Storz, and Stryker hold significant revenue share, yet specialists in single-use and robotics are fragmenting share. Incumbents defend their positions through AI upgrades that integrate with existing towers, thereby creating switching costs. Fujifilm’s CAD EYE and Olympus’ EndoBRAIN exemplify this strategy.
Patent filings show Medtronic focusing on AI lesion characterization, while Ambu is improving ergonomic features in disposables. Boston Scientific’s LithoVue captured 22% of U.S. ureteroscope volume in 2024, eroding reusable franchises. Ambu’s aScope line reached a 19% unit share in pulmonology with a pay-per-use model, appealing to ASCs with limited reprocessing staff.
Large integrated delivery networks negotiate enterprise AI contracts covering hardware, software, and maintenance, whereas independent practices opt for pay-per-use plans that preserve capital flexibility. FDA reprocessing requirements and Joint Commission audits raise validation costs, which discourages small entrants unless they pursue single-use paths that bypass reprocessing.
United States Endoscopy Devices Industry Leaders
Boston Scientific Corporation
Medtronic PLC
Cook Medical
Olympus Corporation
Johnson & Johnson (Ethicon)
- *Disclaimer: Major Players sorted in no particular order


Market Opportunities and Future Outlook
Service and repair capacity for the installed base is emerging as a clear whitespace as providers push higher endoscopy throughput and replace towers with premium imaging bundles that include AI modules. In May 2026, FUJIFILM Healthcare Americas Corporation commenced operations at a new 18,000-square-foot endoscopy warehouse facility in Fairfield, New Jersey, expanding its US service-center capacity by about 1.5 times. This signals that turnaround time, loaner availability, and field service logistics are becoming competitive differentiators alongside imaging performance.
Regulatory standard-setting is also creating pathways for differentiated therapeutic and accessory devices that can demonstrate risk controls through defined test and design requirements. In June 2026, FDA published a final order establishing special controls for endoscopic traction devices, specifying non-clinical performance testing and design requirements for risks such as perforation, bleeding, and mucosal injury. For developers targeting procedure efficiency and safety in GI and related endoscopic interventions, the guidance adds specificity to evidence expectations. More broadly, the updated FDA inspection practices (February 2026) elevate the value of suppliers with mature quality systems, validated reprocessing instructions, and documentation that supports hospital and ASC audits.
Recent Industry Developments
- June 2026: Cook Medical released the SureTome SW sphincterotome in the United States and Canada for cannulation of the ductal system and sphincterotomy. The release strengthens Cook Medicals therapeutic endoscopy positioning in ERCP-related procedures, where device choice is closely tied to procedural efficiency and clinician preference.
- May 2026: Olympus announced a definitive agreement to acquire BioProtect Ltd. for USD 270 million, expanding its portfolio of urological technologies. The deal broadens Olympus exposure to urology and adjacent oncology care pathways, complementing its endoscopy franchise with additional procedure-linked products that can be contracted across health-system service lines.
- March 2026: Boston Scientific received FDA 510(k) clearance for the Asurys Fluid Management System for irrigation and distention during endoscopic urologic procedures. Clearance supports deeper bundling around urology procedure ecosystems by pairing capital and disposable components, which can influence conversion decisions in hospital outpatient departments and ambulatory surgical centers.


Research Methodology Framework and Report Scope
Market Definition and Coverage
This market covers the revenues generated from endoscopy devices sold and used in the United States for diagnostic and therapeutic endoscopic procedures, across hospitals, ambulatory surgical centers, and other care settings.
Scope exclusions: We exclude general surgical tools and imaging equipment that are not primarily designed for endoscopic use, along with services, training, and maintenance that are billed separately from device sales.
Segmentation Overview
- By Device Type
- Endoscopes
- Rigid Endoscopes
- Flexible Endoscopes
- Capsule Endoscopes
- Robotic-assisted Endoscopes
- Endoscopic Operative Devices
- Irrigation / Suction Systems
- Access Devices
- Wound Protectors
- Insufflation Devices
- Manual Instruments
- Visualization Equipment
- Endoscopic Cameras
- SD Visualization Systems
- HD / 4K Visualization Systems
- Endoscopes
- By Application
- Gastrointestinal Endoscopy
- Laparoscopy
- Pulmonology / Bronchoscopy
- ENT / Otolaryngology
- Urology
- Gynecology
- Cardiology
- Neurology
- Orthopedics / Arthroscopy
- By Usability
- Reusable Devices
- Single-use / Disposable Devices
- By End-User
- Hospitals
- Ambulatory Surgical Centers
- Specialty Clinics
Data Sources, Market Sizing, and Validation
Desk Research
For the starting data, we first built a structured view of procedure demand and healthcare capacity in the US, then mapped that demand to device families used in endoscopy. Public sources were used to anchor volumes and context, such as CDC screening and disease burden publications, CMS utilization and reimbursement references, US FDA device databases and safety communications, and statistics from sources such as the National Center for Health Statistics.
Next, we used supporting documents to translate those signals into a workable market model, including company annual reports, investor presentations, hospital system updates, and association websites. Where it helped, paid subscriptions were used for company financials and market intelligence, news and financials, and patent databases, mainly to confirm product footprints, launch timing, and directional pricing moves. The source examples listed above are illustrative and not exhaustive, and other references were also used for data collection, validation, and clarification.
Primary Interviews and Surveys
To validate the model, we spoke with a mix of manufacturers, distributors, clinicians, and procurement or materials teams who see actual buying patterns and replacement cycles in the US. We used these interviews to stress test procedure growth assumptions, reusable versus single-use adoption by facility type, average selling price movement, and what is counted as a device sale versus a related capital purchase.
Distribution of primary research fieldwork respondents
| Company type | Respondent position |
|---|---|
| Top tier: 39% | CXOs: 13% |
| Mid tier: 47% | Functional/Unit leaders: 41% |
| Smaller Players: 14% | Managers: 46% |
Market-Sizing & Forecasting
Sizing started from a demand-pool build that links US endoscopy procedure volumes and care setting shifts to the device mix typically required per procedure type, which gives a top-down reconstruction of annual revenue by major device buckets. The totals were then corroborated using selective bottom-up checks, such as sampled price points for key equipment and accessories, channel feedback on shipment direction, and a sanity check using publicly discussed business line performance where available.
A few inputs that mattered in this market were procedure growth for GI and respiratory endoscopy, the shift toward ambulatory surgical centers, reusable versus single-use preference by facility type, replacement cycles for scopes and visualization systems, and typical accessory use rates by procedure. Forecasts were built using scenario analysis, where the key drivers above were flexed based on what interviewees saw for capacity expansion, infection control policies, and budget cycles. When bottom-up signals were missing for smaller categories, we handled gaps by applying conservative penetration and replacement assumptions, then rechecked them with field feedback before finalizing.
Data Validation & Update Cycle
Outputs were checked in a few passes so the numbers stayed consistent with real-world signals. We compared the model against independent indicators like procedure trends, care setting utilization shifts, and known adoption direction for single-use tools, and then flagged outliers for review.
Before sign-off, assumptions and calculations were rechecked by another analyst, and follow-up calls were triggered when a value moved outside an expected range. The report is refreshed annually, and interim updates are done when major events materially change procedure volumes, pricing, or regulatory conditions for US device markets. Right before delivery, we do a fresh scan of key updates so clients receive the most current view.
Mordor Intelligence's USA Endoscopy Devices Market Size Versus Other Published Estimates
Published market values for US endoscopy devices can look different across sources, even when they describe similar products, because the counting rules and timing choices are not always aligned. Differences usually come from what is treated as a device sale, which year is used as the anchor, and how fast prices and single-use adoption are assumed to move.
The benchmark table shows a spread that is mainly tied to scope and timing. Under Mordor Intelligence's scope, the total is built around endoscopes, endoscopic operative devices, and visualization and documentation equipment in the United States, and procedure-adjacent hospital equipment is only counted when it is clearly purchased and used for endoscopic workflows.
Benchmark comparison
| Source | Market Size | Gaps in Research Methodology |
|---|---|---|
| Mordor Intelligence | USD 13.64 B (2026) | |
| Industry Marketplace A | USD 12.17 B (2024) | Uses an earlier base year and a shorter forecast window, and the included device grouping can differ when single-use items and visualization systems are classified or priced differently. |
| Industry Publisher B | USD 3.80 B (2024) | Appears to use a narrower counted revenue pool, which can happen when only selected device types or procedure areas are included, and when capital systems are not captured consistently with accessories. |
Taken together, the differences are explainable once you line up year selection, included device families, and how reusable and single-use pricing is handled. Our approach stays traceable to procedure demand signals, care setting shifts, and practical device usage assumptions, which makes it easier to repeat the steps and update the estimate when market conditions change.


Key Questions Answered in the Report
How fast is the endoscopy devices market expected to grow in the United States?
The market is projected to expand at a 6.36% CAGR from 2026 to 2031, rising to USD 18.56 billion by the end of the period.
Which application is forecast to be the fastest growing through 2031?
Gynecology leads with a projected 7.69% CAGR, driven by office-based hysteroscopy for fibroid and polyp removal.
Are single-use or reusable scopes gaining more traction?
Reusable scopes still hold 64.78% of 2025 sales, but single-use devices are advancing at a faster 9.01% CAGR due to infection-control and cost-of-ownership advantages.
Which states show the highest growth in outpatient endoscopy?
Florida, Texas, and Arizona record the strongest volume gains, supported by population inflows and rapid expansion of ambulatory surgical centers.
What is the main barrier to robotic bronchoscopy adoption?
High ownership costs of USD 500,000-1 million per system limit uptake among rural and mid-size hospitals despite clear clinical benefits.
Page last updated on:


 Your data is secure and never sold or shared.


