
Market Overview
| Study Period | 2020 - 2031 |
|---|---|
| Forecast Data Period | 2026 - 2031 |
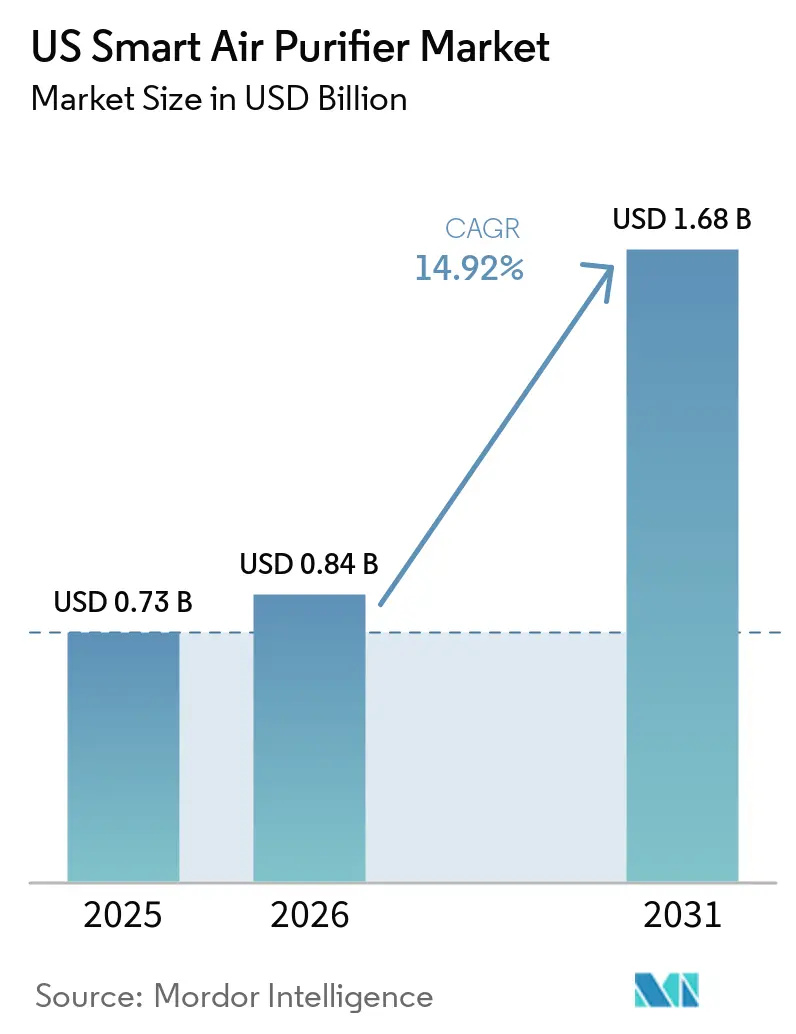
| Base Year Market Size (2025) | USD 0.73 Billion |
| Market Size (2026) | USD 0.84 Billion |
| Market Size (2031) | USD 1.68 Billion |
| Growth Rate (2026 - 2031) | 14.92 % |
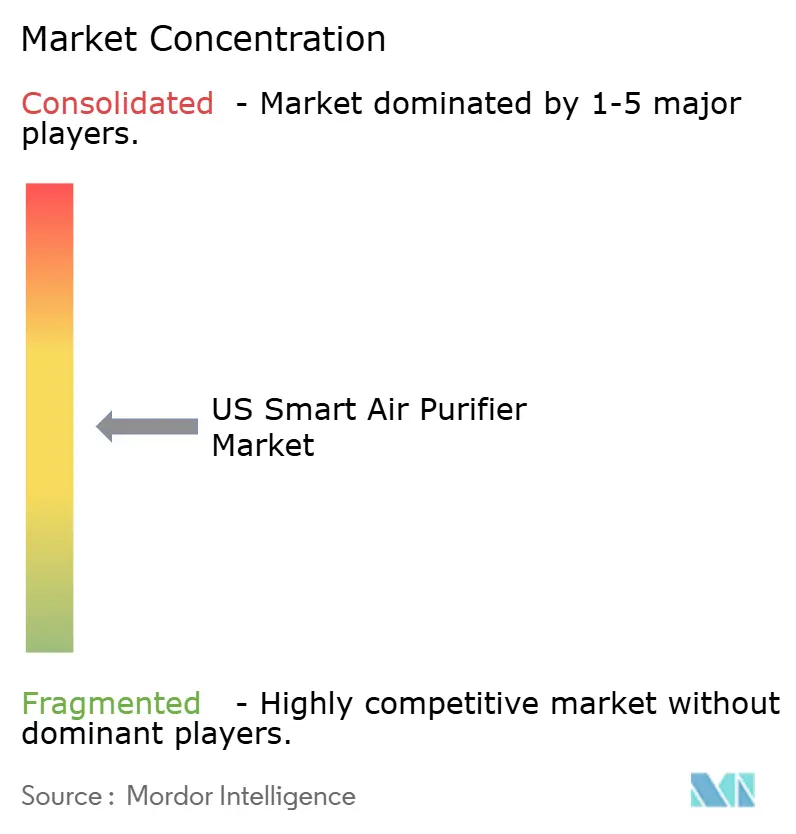
| Market Concentration | Medium |
Major Players *Disclaimer: Major Players sorted in no particular order Image © Mordor Intelligence. Reuse requires attribution under CC BY 4.0. | |
US Smart Air Purifier Market Analysis by Mordor Intelligence
US smart air purifier market size in 2026 is estimated at USD 0.84 billion, growing from 2025 value of USD 0.73 billion with 2031 projections showing USD 1.68 billion, growing at 14.92% CAGR over 2026-2031. Heightened consumer awareness after the US EPA tightened PM2.5 limits in 2024, the growing asthma burden reported by the CDC, and persistent wildfire smoke in the West continue to move air purification from a lifestyle upgrade to a perceived health necessity. Technology upgrades such as IoT-enabled sensors, the spread of WELL and LEED certifications, and wider utility rebates add further momentum. Competitive activity, including mergers and sizable research budgets, keeps price points in check and accelerates feature innovation. Supply-chain re-shoring of filter media is also beginning to mitigate tariff exposure and logistics risk while improving delivery lead times.
Key Report Takeaways
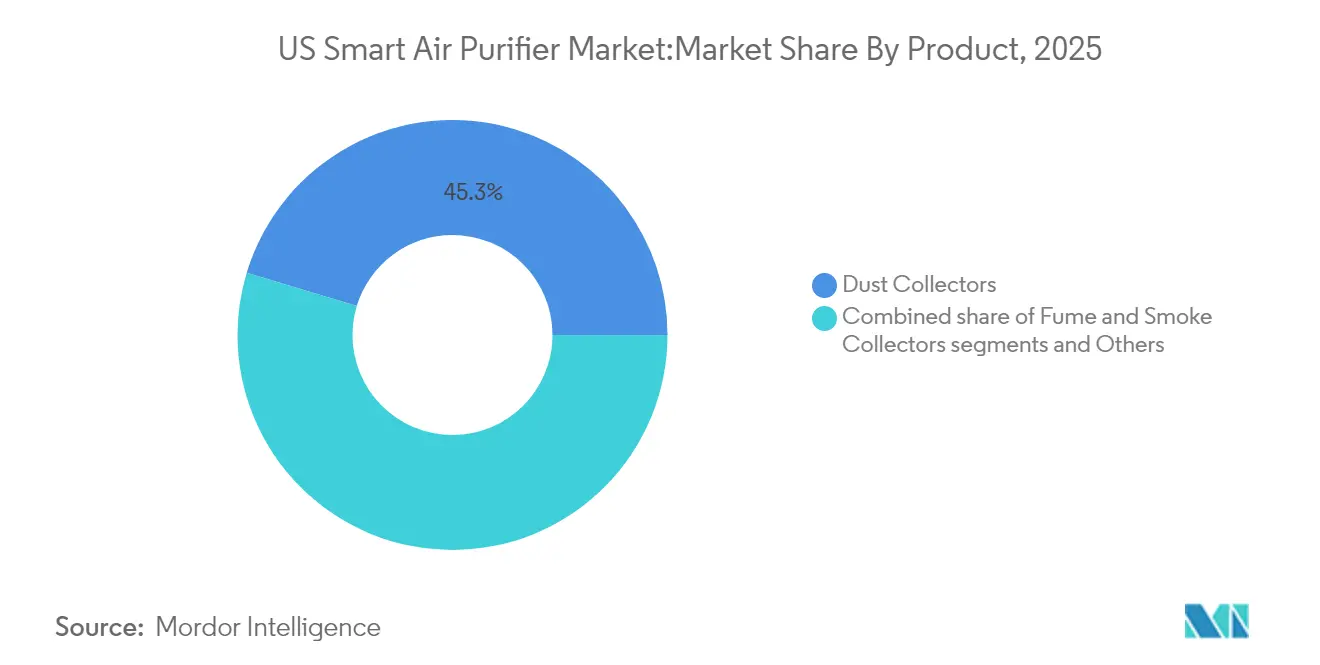
- By product type, dust collectors led with a 45.32% share in 2025; fume & smoke collectors are expected to expand at 15.12% CAGR to 2031.
- By technology, HEPA filtration dominated with 52.40% revenue share in 2025, while activated carbon systems are anticipated to grow at 15.57% CAGR.
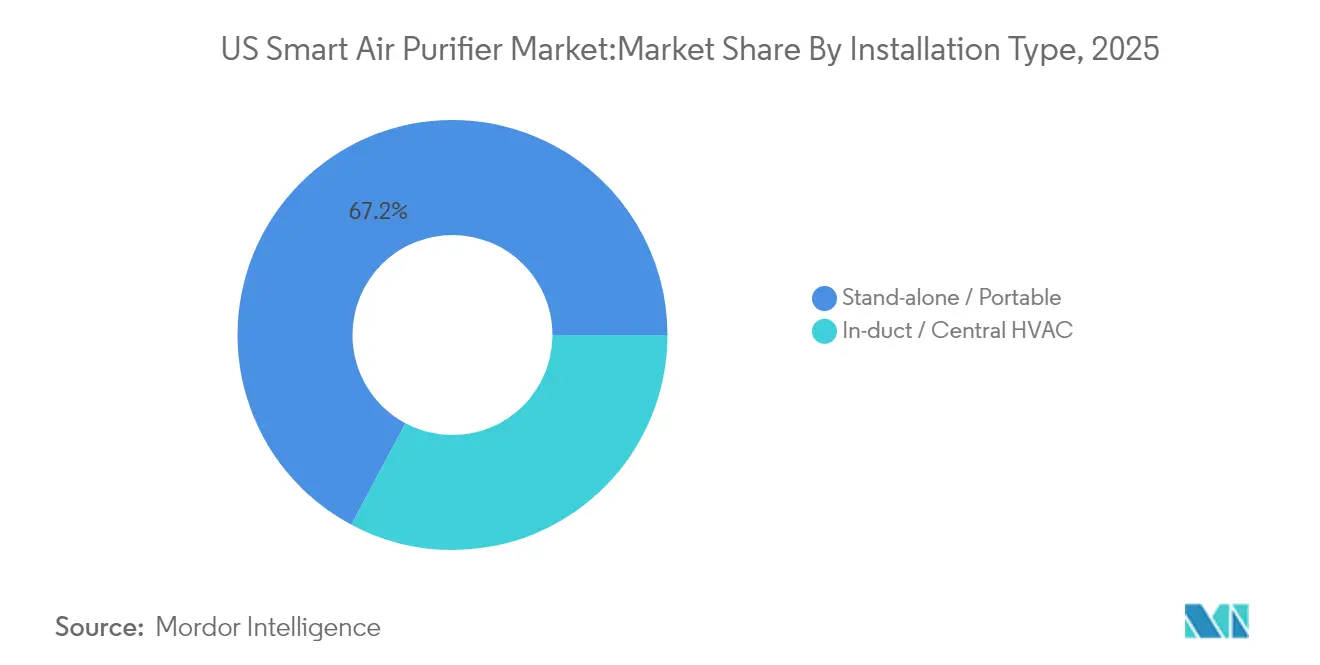
- By installation, portable units remained the preferred choice with 67.20% US smart air purifier market share in 2025; in-duct central integration is forecast to advance at 14.98% CAGR.
- By application, residential users accounted for 59.10% of the US smart air purifier market size in 2025, whereas commercial settings are projected to grow at 15.85% CAGR.
- By distribution channel, B2C/Retail captured 64.20% share of the US smart air purifier market size in 2025; B2B direct sales are set to climb at 17.12% CAGR.
- By geography, the West held 24.60% of the US smart air purifier market share in 2025, whereas the Northeast is projected to post the fastest 14.99% CAGR through 2031.
Note: Market size and forecast figures in this report are generated using Mordor Intelligence’s proprietary estimation framework, updated with the latest available data and insights as of 2026.
US Smart Air Purifier Market Trends and Insights
Drivers Impact Analysis*
| Driver | (~) % Impact on CAGR Forecast | Geographic Relevance | Impact Timeline |
|---|---|---|---|
| Rising Consumer Awareness of Indoor Air Quality | +1.8% | Global; stronger in the West and Northeast | Medium term (2-4 years) |
| Increasing Prevalence of Respiratory Diseases | +1.5% | National, concentrated in urban areas | Long term (≥ 4 years) |
| Integration of Smart-Home Connectivity (IoT) | +1.2% | National, early adoption in tech-forward regions | Short term (≤ 2 years) |
| Expansion of E-Commerce Channels | +0.9% | National, stronger impact in suburban markets | Short term (≤ 2 years) |
| Utility Rebates & Health-Insurance Incentives | +0.7% | Regional: California, Connecticut, Oregon | Medium term (2-4 years) |
| Uptake in Co-Working Offices for WELL/LEED Credits | +0.6% | Urban centers, Northeast and West Coast | Medium term (2-4 years) |
| Source: Mordor Intelligence | |||
Rising Consumer Awareness of Indoor Air Quality
Awareness spiked after the US EPA cut the annual PM2.5 limit to 9 µg/m³ in February 2024, prompting headlines that indoor pollutant loads can be two to five times higher than outdoor levels[1]US EPA, “Revised Fine Particle Standards,” epa.gov. Studies that show Americans stay indoors 90% of the day have added urgency. Manufacturers now highlight VOC (Volatile Organic Compound) removal, wildfire smoke capture, and real-time AQI (Air Quality Index) displays. Sharp’s global sales of more than 90 million Plasmacluster units illustrate how ion-based purification messaging resonates with health-conscious buyers. A National Air Quality report showing 1 in 4 citizens breathing unhealthy outdoor air further cements in-home filtration as a preventive health tool.
Increasing Prevalence of Respiratory Diseases
Respiratory disease prevalence creates a substantial addressable market. National Center for Chronic Disease Prevention and Health Promotion, data put current US asthma cases at 24.9 million. Rising medical costs have sharpened interest in preventive solutions. ASHRAE Standard 241 forces building owners to consider filtration for pathogen control, boosting demand in schools and offices[2]ASHRAE, “Standard 241: Control of Infectious Aerosols,” ashrae.org. Clinical research shows that air purifiers with both HEPA filters and UV-C lights help kids catch the flu less often and breathe easier if they have asthma. For many families focused on health, those clear benefits make the upfront cost worthwhile.
Integration of Smart-Home Connectivity (IoT)
IoT turns purifiers into proactive health managers. Embedded PM, CO₂, and VOC sensors automatically change fan speed based on pollution spikes. Dyson’s MyDyson app aggregates data from over 4 million deployed units to give personalized recommendations. Predictive maintenance alerts trigger filter re-orders and cut downtime. Voice-assistant pairing helps elderly users operate devices hands-free. Energy analytics also optimize run-time, making smart purifiers an affordable long-term choice despite higher initial prices.
Expansion of E-Commerce Channels
E-commerce sites lay out side-by-side specs, real customer reviews, and clear room-size guides—details that are hard to cover on a crowded retail shelf. Direct-to-consumer storefronts allow brands to bypass retail mark-ups and bundle subscription filter plans. Molekule reports subscribers save 40% on filter costs while ensuring timely replacement. Detailed comparison tools, verified reviews, and one-click financing make high-spec models accessible to middle-income households. Online retailers can move quickly during emergencies. When California’s wildfires filled the air with smoke, Kronos Advanced Technologies issued special discounts and arranged fast shipping so families could receive purifiers right when they needed them most.
Restraints Impact Analysis*
| Restraint | (~) % Impact on CAGR Forecast | Geographic Relevance | Impact Timeline |
|---|---|---|---|
| High Upfront & Maintenance Costs | -1.4% | National; greater impact on price-sensitive segments | Long term (≥ 4 years) |
| Ozone/UV by-product emission concerns | -0.8% | National regulatory focus in California | Medium term (2-4 years) |
| Indoor-Sensor Data-Privacy Concerns | -0.6% | National, heightened awareness in tech-forward regions | Short term (≤ 2 years) |
| Supply-Chain Dependence on Imported Filter Media | -0.5% | National vulnerabilities across all regions | Medium term (2-4 years) |
| Source: Mordor Intelligence | |||
High Upfront & Maintenance Costs
Top-shelf air purifiers do not come at a low cost. The sticker price alone can keep many middle-income families on the sidelines, and the bills do not stop there. HEPA or charcoal filters must be swapped out every few months so that annual upkeep can rival—or even top—the original purchase cost for anyone watching the budget.
Running the unit adds another layer of expense, although models with energy-saving labels do soften the hit on the power bill. A handful of states and utilities offer small rebates that take some sting out of the price, but those programs are far from universal. This cost barrier particularly impacts households when a family wants coverage in several rooms; outfitting an entire home requires a bigger cash outlay up front. Even so, many health-focused households decide the longer-term payoff—cleaner air, fewer allergy flare-ups, better sleep—is worth stretching the budget today. ENERGY STAR certified models cut annual power use by 25%, but only selected utilities fund rebates—Energy Trust of Oregon offers USD 75, and Connecticut’s program pays USD 40, leaving many consumers without cost relief [3]Energy Trust of Oregon, “Residential Appliance Rebates,” energytrust.org. Brands now counter with financing plans and trade-in credits, but affordability still curbs the US smart air purifier market in lower-income ZIP codes.
Ozone/UV By-Product Emission Concerns
Some air-cleaning methods can give off small amounts of ozone, which has pushed regulators to keep a close eye on ionizers and certain UV-C models, even though these devices are good at killing germs and trapping chemicals. In California, for example, the Air Resources Board caps indoor-air cleaner emissions at 0.05 parts per million, so brands must shift toward ozone-free options such as bipolar ionization. UV-C products face the same scrutiny, prompting manufacturers to switch to UV-C LEDs that keep ozone output near zero while still neutralizing microbes. Marketing must now explain safety testing as thoroughly as efficacy, slightly elongating the sales cycle and slowing adoption in sensitive demographics.
*Our forecasts treat driver/restraint impacts as directional, not additive. The impact forecasts reflect baseline growth, mix effects, and variable interactions.
Segment Analysis
By Product Type: Dust Collectors Dominate Despite Smoke Purifier Acceleration
Dust collectors accounted for 45.32% of the US smart air purifier market in 2025 as consumers target household allergens and pet dander. The segment benefits from recognizable HEPA branding and broad price ranges that suit casual shoppers. In contrast, fume and smoke collectors, although niche, are projected to grow at an 15.12% CAGR through 2031 amid intensifying wildfire seasons and urban smog alerts.
Technology cross-pollination is speeding product evolution. Filter-free electrostatic designs from KIMM promise 90% particulate removal with lower lifetime cost, while Sharp bundles dehumidification to attract coastal buyers. Industrial-grade systems such as AtomikAir treat up to 1 million ft³/h, opening an avenue for warehouses that previously relied on basic HVAC filtration. This shift brings new B2B revenue as facility managers look for turnkey packages that include monitoring dashboards.



By Technology: HEPA Filtration Maintains Leadership While Carbon Innovation Accelerates
HEPA systems held 52.40% share in 2025 and remain the default choice for families seeking tested 99.97% efficiency. The US smart air purifier market share for HEPA is reinforced by certification visibility and low regulatory risk. Activated-carbon units are forecast to register a 15.57% CAGR through 2031.
Fresh materials are also shaking things up. Washington State University scientists, for example, turned corn protein into a filter that rivals HEPA at 99.5% particle capture and grabs 87% of formaldehyde as well. Many brands now bundle several technologies—HEPA, carbon, UV-C—in one box to cover the full spectrum of indoor contaminants. Add Wi-Fi sensors and app controls, and the purifier can adjust itself in real time; Dyson models even diagnose their own maintenance needs to keep upkeep simple for the owner.
By Application: Residential Dominance Faces Commercial Growth Acceleration
Residential buyers held a 59.10% share in 2025, driven by allergy relief, sleep-quality concerns, and pandemic-era work-from-home habits. Demand surged in states hit by wildfire smoke, where parents purchase multiple units to safeguard their children’s lungs. Commercial installations are expected to deliver a 15.85% CAGR through 2031 as employers balance return-to-office mandates with demonstrable health safeguards.
Corporate ESG reports increasingly reference indoor-air metrics, and tenants now negotiate IAQ clauses alongside rent. Schools add modular HEPA towers to comply with state-level pathogen guidelines. Industrial buyers prioritize units with real-time VOC alarms to protect process quality and OSHA compliance. This variety positions the US smart air purifier industry to capture value far beyond its traditional household base.
By Installation Type: Portable Units Lead While Central Integration Gains Commercial Traction
The portable units remained the preferred choice with 67.20% US smart air purifier market share in 2025. Portable air purifiers dominate volume because they ship ready-to-use and can be moved between bedrooms, living rooms, and home offices without professional help. Whole-building systems installed inside HVAC trunks are predicted to grow at 14.98% CAGR through 2031, especially in offices chasing WELL credits that demand 24/7 monitoring. The US smart air purifier market size for in-duct solutions will benefit once replacement filter SKUs become standardized across equipment brands.
Building-automation vendors now integrate AQ sensors with lighting and occupancy data to cycle purification only when thresholds are breached, cutting power bills in half. California’s Title 24 energy code already mandates MERV 13 filtration in new commercial builds, creating a captive base for add-on HEPA or carbon cassettes. Companies that pair integration services with multi-year maintenance contracts are winning multi-site deals across healthcare chains.
By Distribution Channel: B2C Still Rules, but Direct B2B Sales Are Closing the Gap
Shoppers still do most of their buying through consumer-facing outlets, giving B2C channels—online stores, multi-brand retailers, and branded showrooms—a solid 64.20% share in 2025. These touchpoints let people compare specs, read reviews, and arrange doorstep delivery for a product that often needs a bit of homework before purchase.On the flip side, direct B2B orders from manufacturers are on a tear, rising at 17.12% a year through 2031. Offices, hospitals, and schools want bulk discounts, custom filters, and service contracts that big-box retailers simply do not provide. Brands are happy to oblige because they keep the retail markup, bundle predictive-maintenance software, and lock in subscription filter deals. The strategy also pays off during crises: when wildfire smoke choked California, suppliers could slash prices and ship pallets of purifiers within days—something traditional retail chains could not match.
Geography Analysis
The West still sits on top with 24.60% of 2025 sales, largely because California’s recurring wildfire smoke keeps clean-air devices front of mind and wallet. Los Angeles–Long Beach held the dubious honor of America’s most polluted metro area last year, underscoring why residents readily pay for high-end filtration.The growth sprint, however, is happening in the Northeast, where sales are projected to climb 14.99% a year to 2031. Dense cities like New York and Boston trap exhaust and industrial fumes, pushing businesses to install building-wide systems as part of WELL or LEED upgrades. Utility rebates—Connecticut offers USD 40 per qualifying unit—help middle-income families join in.Local rules shape what sells. California’s CARB limits steer buyers toward ozone-free tech, while Northeastern codes reward energy-efficient models. Climate change is only amplifying the need: longer fire seasons out West and heat-driven pollution spikes in Eastern cities ensure demand keeps rising on both coasts.
The remaining regions display differentiated needs. Midwestern industrial hubs prioritize high-capacity dust loaders, while the Southeast’s humidity spurs combined air-purifier-dehumidifier sales. The Southwest sees strong demand for high-CADR particulate filters capable of handling desert dust. Variation in rebate coverage, average income, and climatic triggers means channel partners must hold targeted inventories and agile logistics to realize full potential across the entire US smart air purifier market.
Value Chain Analysis
The US smart air purifier value chain begins with upstream materials and components, including filter media (HEPA and activated carbon), plastics, motors, PCBs, Wi-Fi or Bluetooth modules, and air-quality sensors. Many brands operate a hybrid sourcing model, drawing on established Asian supply ecosystems for technical components while handling product design, software and app layers, and US go-to-market. Performance and energy claims are shaped by the test methods and labeling programs used by manufacturers and retailers, including AHAM procedures for air cleaners and the ENERGY STAR Room Air Cleaners specification.
Midstream operations cover OEM or ODM manufacturing, final assembly, quality testing, and packaging. Downstream, brands distribute through B2C channels such as retail and e-commerce, and through direct B2B sales. Aftermarket consumables, especially replacement filters and pre-filters, are a key part of the chain, since they drive repeat purchases and help maintain performance within stated specifications. The service layer also matters more for connected devices, including subscription filter replenishment, warranty handling, and software or firmware support, which links product lifecycle economics to ongoing digital usage rather than a one-time hardware sale.
Competitive Landscape
The market is moderate, with no brand exceeding a double-digit share. Dyson, Honeywell, and Whirlpool leverage nationwide retailer agreements and large R&D budgets; Molekule merged with Aeroclean in 2024 to form MKUL Inc., creating a larger FDA-cleared product family and strengthening hospital bids.
New names are shaking up the category. Frigidaire rolled out its first air-purifier line in March 2025, and Windmill Air is courting millennials with a sleek, direct-to-consumer model that delivers medical-grade HEPA cleaning for USD 299. The real untapped potential now sits in whole-building HVAC tie-ins, heavy-duty industrial units, and hospital-grade systems—areas where tough certifications and performance specs keep casual entrants out and leave qualified suppliers room to own the space.
Industrial and commercial niches show higher switching costs and certification hurdles, favoring incumbents with UL, CARB, and FDA clearances. Brands offering full-stack solutions—hardware, software dashboard, and maintenance—win multi-location contracts in healthcare and education.
US Smart Air Purifier Industry Leaders
Honeywell International, Inc.
Dyson Limited
Coway Co., Ltd.
Koninklijke Philips N.V.
Levoit (Vesync Co., Ltd.)
- *Disclaimer: Major Players sorted in no particular order

Market Opportunities and Future Outlook
The most direct monetization opportunity is the installed base, with filter replacement required to maintain performance but fragmented across SKUs and purchase journeys. Brands that simplify replenishment through subscriptions, auto-reorder prompts from app telemetry, and bundles aimed at multi-room households can build recurring revenue and higher retention, especially when premium players lean on direct-to-consumer relationships and service-led models use rental or subscription structures. Standardized test-and-labeling frameworks also shape how vendors differentiate in energy and performance messaging, with ENERGY STAR continuing to serve as a reference point for room air cleaner efficiency and operating cost comparisons.
Commercial and whole-building opportunities depend on measurable IAQ requirements and building-certification pull, particularly for WELL and LEED projects that require monitoring and documentation rather than isolated device placement. That pattern favors connected fleets, centralized dashboards, and maintenance contracts, aligning with the shift toward B2B and direct manufacturer sales referenced in the competitive landscape. It also intersects with supply-chain changes, as selective re-shoring of assembly and filter media can shorten lead times during episodic demand spikes such as wildfire smoke events, supporting faster replenishment cycles for both devices and replacement filters.
Recent Industry Developments
- May 2026: Dyson launched the Find+Follow Purifier Cool, adding AI vision-based user detection to track movement and direct airflow where occupants are located. The release raises the feature bar in the premium connected segment and reinforces app-led differentiation beyond basic particulate sensing.
- March 2026: Coway launched the Airmega Mighty2 (AP-1512N) in the United States with an updated control interface and refreshed design. The model targets high-volume residential demand at a mainstream price point, intensifying competition around compact form factors and value-oriented smart features.
- February 2025: Coway expanded its US cylindrical lineup with the Airmega 350 and Airmega 450 featuring HyperVortex filtration. The higher-capacity introductions broaden Coway’s coverage for larger rooms and help retailers ladder consumers from entry models to premium tiers using performance-led positioning.


Research Methodology Framework and Report Scope
Market Definition and Coverage
This market covers revenue generated in the United States from smart air purifiers, meaning air cleaning devices with connected features (such as app control, sensors, or Wi-Fi) that are sold for residential and commercial use.
Scope exclusions: We exclude non-connected (basic) air purifiers and replacement consumables sold separately from the device purchase where they are not bundled.
Segmentation Overview
- By Product Type
- Dust Collectors
- Fume & Smoke Collectors
- Others
- By Technology
- HEPA
- Activated Carbon Filtration
- Ionic Filter
- Ultra-Violet Technology
- Others
- By Installation Type
- Stand-alone / Portable
- In-duct / Central HVAC
- By Application
- Residential
- Commercial
- Industrial
- By Distribution Channel
- B2C/Retail
- Multi-brand Stores
- Exclusive Brand Outlets
- Online
- Other Distribution Channels
- B2B/Directly from the Manufacturers
- B2C/Retail
- By Geography
- Northeast
- Southeast
- Midwest
- Southwest
- West
Data Sources, Market Sizing, and Validation
Desk Research
Desk work starts by grounding the size model in public signals that explain how much demand exists and what is shaping it in the US. We referenced sources such as US EPA air quality and PM2.5 updates, CDC asthma and respiratory health statistics, US Census housing and household counts, and US International Trade Commission trade data that helps interpret device import intensity and pricing pressure. For the product layer, we also reviewed ENERGY STAR and AHAM guidance and testing references that influence how buyers interpret performance claims.
To translate these signals into market math, we add company filings, earnings notes, and product announcements to understand mix shifts like HEPA adoption, sensor features, and smart-home integration, followed by reputable press coverage on wildfire seasons and indoor air quality attention. Paid subscriptions were used selectively for company financials and news screening, plus patent databases to see the pace of sensor and filtration related innovation. The sources listed here are illustrative, and many other public and paid references were used for cross-checking and clarification during the study.
Primary Interviews and Surveys
Primary work was used to pressure-test adoption assumptions for connected purifiers and to confirm pricing patterns across online and offline channels. We spoke with stakeholders across manufacturing, distribution, and commercial buyers, and the discussion was balanced across US regions so that wildfire exposure, housing stock, and commercial uptake differences could be reflected in the final model.
Distribution of primary research fieldwork respondents
| Company type | Respondent position |
|---|---|
| Top tier: 28% | CXOs: 18% |
| Mid tier: 52% | Functional/Unit leaders: 36% |
| Smaller Players: 20% | Managers: 46% |
Market-Sizing & Forecasting
The core sizing logic uses a top-down build that reconstructs the US demand pool by linking household and commercial site counts to smart purifier penetration and replacement cycles, and then converts units to value using observed average selling prices. To keep the outputs realistic, we corroborate totals with selective bottom-up checks such as sampled online assortment tracking, channel partner feedback on unit volumes, and price band splits across standalone and central HVAC linked installations.
Inputs that matter in this market include PM2.5 and smoke event intensity, urban versus suburban household mix, the share of purchases triggered by allergies and asthma concerns, smart-home adoption behavior that pulls buyers toward connected models, and the observed premium buyers pay for sensors, app control, and filter-life monitoring. Where the bottom-up checks show gaps, such as under-coverage of smaller regional sellers or installer-led commercial deals, we adjust using conservative expansion factors that are validated through interviews.
For forecasting, scenario analysis is applied, because demand can shift quickly with wildfire seasons, changing guidance on indoor air quality, and consumer spending sensitivity. The scenarios are then anchored to the most common expectations shared by industry participants on penetration growth and price movement, followed by a final smoothing step so year to year changes stay consistent with real purchase cycles.
Data Validation & Update Cycle
Outputs are validated through triangulation across independent signals, including public air quality data, trade and shipment direction, and channel pricing checks, before figures are finalized. We review variances by application and installation type, and then re-check any unusual jumps against the assumptions that caused them, which typically triggers follow-up questions with interviewees.
Each report goes through multi-step analyst reviews, with a final pass focused on removing internal inconsistencies and aligning the narrative with the model. Updates are done annually, and interim revisions are made when material events occur, such as major regulation changes, sharp pricing shifts, or meaningful technology moves that alter adoption. Before delivery, the model and key inputs are re-checked so clients receive the latest updated view.
Mordor Intelligence's US Smart Air Purifier Market Size Compared With Other Published Estimates
Published numbers for this market can look far apart, even when they talk about the same country, because the word smart is treated differently and revenue boundaries get mixed. Some estimates lean on shipments or broad air purifier spend, and others mix device revenue with filters or adjacent indoor air products, which changes the total quickly.
Channel price checks, observed retail assortment depth, and interview-confirmed adoption rates are the evidence that keeps Mordor Intelligence tied to connected-device revenue only, which is why our total typically diverges from figures that blur smart versus non-smart units or use older price points. Differences also come from whether central HVAC linked installations are counted as full device revenue, how commercial purchases are timed, and how often currency and pricing assumptions are refreshed.
Benchmark comparison
| Source | Market Size | Gaps in Research Methodology |
|---|---|---|
| Mordor Intelligence | USD 0.73 B (2025) | |
| Trade Journal A | USD 0.95 B (2025) | Uses a broader device boundary that likely counts non-connected air purifiers with app-like add-ons and applies higher blended pricing from premium models across the full mix. |
| Industry Association B | USD 0.60 B (2025) | Focuses on a narrower definition of smart that excludes some Wi-Fi enabled standalone units and may undercount e-commerce led sales that do not pass through member reporting. |
The spread in the table is mainly explained by what is counted as smart and how sales channels are captured, not by a disagreement that demand exists. When scope is kept to connected-device revenue and checked against pricing and adoption signals, the resulting size stays more traceable to repeatable inputs that clients can re-check over time.


Key Questions Answered in the Report
What is the current size of the US smart air purifier market?
The market was valued at USD 0.84 billion in 2026 and is expected to reach USD 1.68 billion by 2031
Which region leads US sales?
The West commands 24.60% revenue share in 2025 due to persistent wildfire smoke and stringent California regulations.
Which technology dominates?
HEPA filtration holds 52.40% market share owing to its proven 99.97% particle removal efficiency.
Are commercial installations growing faster than residential?
Yes, Commercial demand is projected to post a 15.85% CAGR over 2026-2031 as WELL and LEED certifications make continuous air quality monitoring a priority.
How important is e-commerce to future growth?
Online retail already represents significant revenue share and will stay pivotal as brands push subscription filter plans and region-specific promotions during air quality emergencies.
What limits broader adoption?
High upfront device costs, ongoing filter expenses, and concerns about ozone or UV by-products remain the primary restraints despite rebate programs and safer designs.
Page last updated on:


 Your data is secure and never sold or shared.


