Market Overview
| Study Period | 2020 - 2031 |
|---|---|
| Forecast Data Period | 2026 - 2031 |
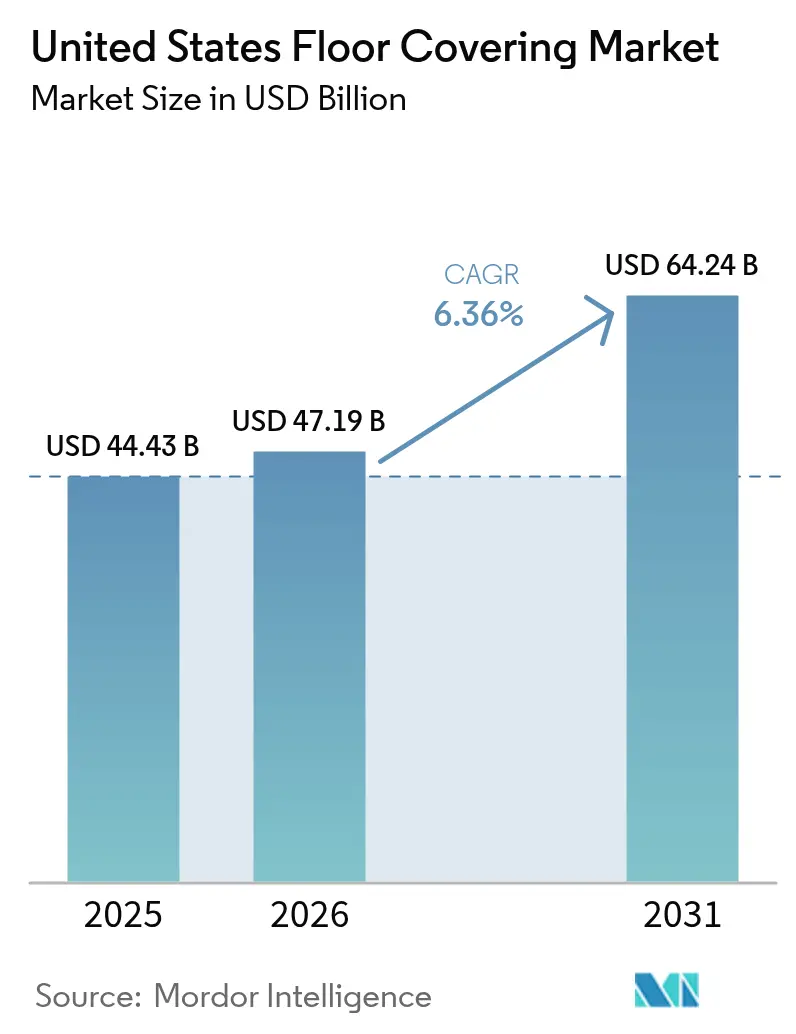
| Base Year Market Size (2025) | USD 44.43 Billion |
| Market Size (2026) | USD 47.19 Billion |
| Market Size (2031) | USD 64.24 Billion |
| Growth Rate (2026 - 2031) | 6.36% CAGR |
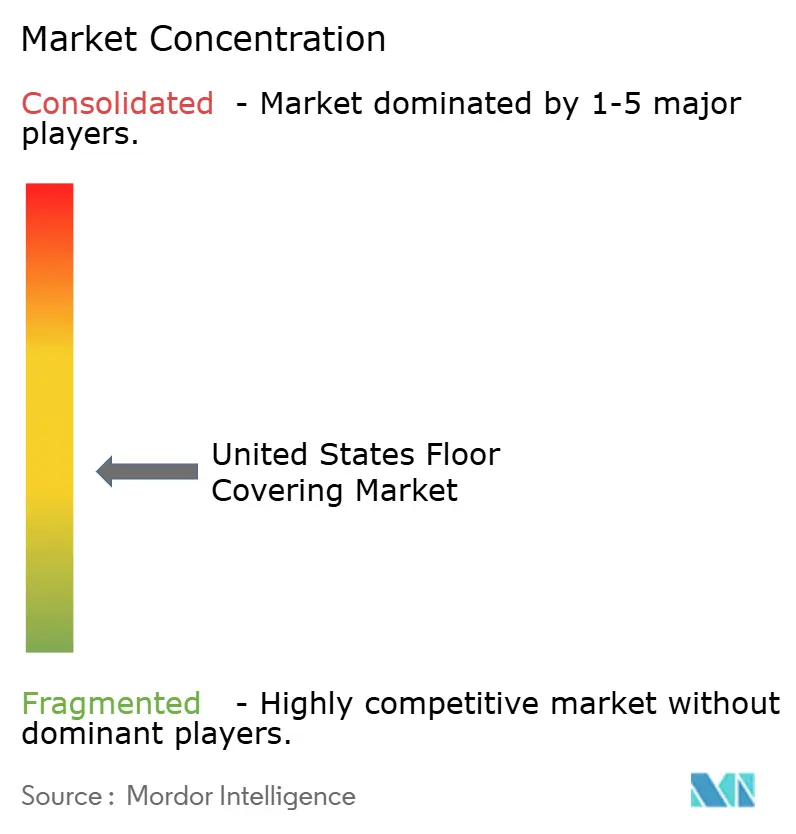
| Market Concentration | Medium |
Major Players *Disclaimer: Major Players sorted in no particular order Image © Mordor Intelligence. Reuse requires attribution under CC BY 4.0. | |
United States Floor Covering Market Analysis by Mordor Intelligence
The United States floor covering market size was USD 44.43 billion in 2025, is set to reach USD 47.19 billion in 2026, and is forecast to rise to USD 64.24 billion by 2031, reflecting a 6.36% CAGR during 2026-2031. The core momentum in the United States floor covering market comes from resilient formats, with luxury vinyl tile expanding at a 7.72% CAGR based on sustained demand in both premium and value tiers. Residential activity remains the primary base for installed volumes at 62.31% share in 2025, while healthcare facilities lead nonresidential growth with a 6.75% CAGR supported by outpatient care expansion and rapid refresh cycles. Regionally, the Southeast accounts for 26.41% of 2025 demand while the Southwest outpaces all regions at a 7.12% CAGR, helped by Sun Belt migration and new construction pipelines. Tariff actions on imported LVT and engineered products combined with domestic capacity investments by leading suppliers are shifting sourcing strategies toward the United States plants, which reduces logistics risk and lead-time volatility as the United States floor covering market matures[1]Office of the U.S. Trade Representative, “Section 301 Investigations: China,” Executive Office of the President, ustr.gov .
Key Report Takeaways
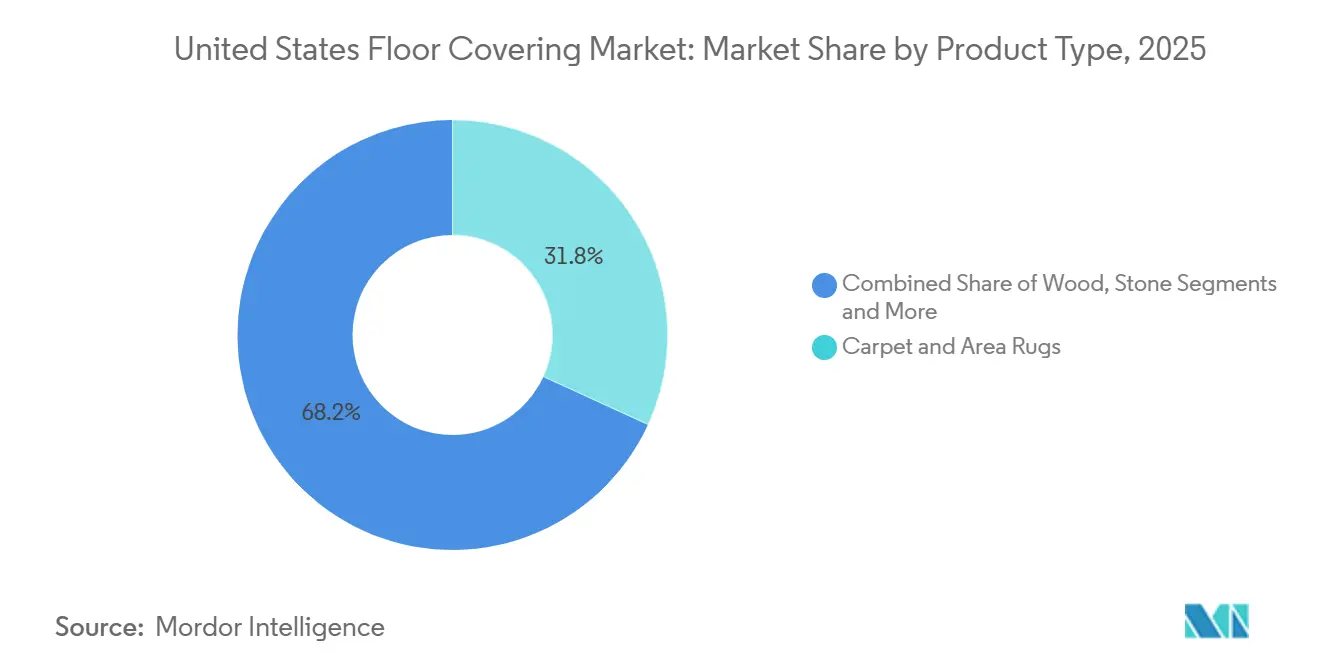
- By product type, carpet & area rugs led with 31.83% of the United States floor covering market share in 2025, while vinyl flooring is projected to expand at a 7.72% CAGR to 2031.
- By end-user, residential accounted for 62.31% of the United States floor covering market share in 2025, while commercial healthcare facilities recorded the fastest projected CAGR at 6.75% through 2031.
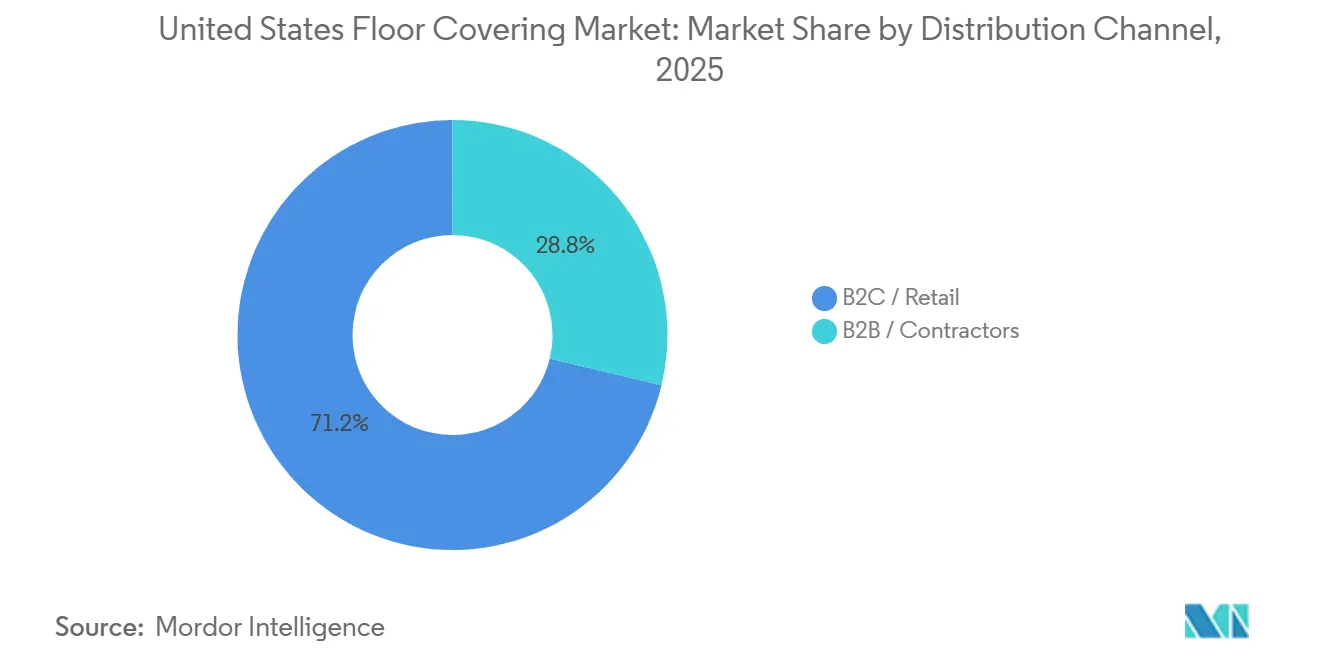
- By distribution channel, B2C/Retail held 71.23% of the United States floor covering market share in 2025, while online posted the highest projected CAGR at 6.97% through 2031.
- By geography, the Southeast commanded a 26.41% of the United States floor covering market share in 2025, while the Southwest recorded the highest projected CAGR at 7.12% during 2026-2031.
Note: Market size and forecast figures in this report are generated using Mordor Intelligence’s proprietary estimation framework, updated with the latest available data and insights as of 2026.
United States Floor Covering Market Trends and Insights
Drivers Impact Analysis*
| Driver | (~) % Impact on CAGR Forecast | Geographic Relevance | Impact Timeline |
|---|---|---|---|
| LVT/Resilient adoption across price tiers and formats | + 2.1% | National, strongest in Southeast, Southwest Sun Belt markets | Medium term (2-4 years) |
| Residential remodeling and replacement cycle resilience | + 1.8% | National, with the highest per-capita spending in the Northeast, West | Long term (≥ 4 years) |
| Commercial refurbishment in healthcare, education, and hospitality | + 1.3% | National, concentrated urban/suburban corridors | Medium term (2-4 years) |
| Shift to PVC-free/low-VOC/low-carbon specifications | + 0.6% | National, early adoption in California, Northeast institutional markets | Long term (≥ 4 years) |
| Digital specification/BIM-driven product selection | + 0.3% | National, led by metropolitan commercial projects | Short term (≤ 2 years) |
| Domestic capacity additions shorten lead times, reduce import risk | + 0.7% | National manufacturing concentration in Georgia, Tennessee | Short term (≤ 2 years) |
| Source: Mordor Intelligence | |||
LVT/Resilient Adoption Across Price Tiers and Formats
Advances in rigid core construction extend LVT’s role from budget replacement to mainstream specifications in new construction and premium remodels. Stone polymer composite offers dent resistance and moisture stability for high-traffic or wet areas, while wood polymer composite regains traction where thermal comfort and acoustics weigh heavily in multifamily living experience. Diverse installation options, including click-lock, loose-lay, and pre-glued, help contractors cope with installer scarcity by reducing job time, which matters when wages for construction trades rose to USD 40.55 per hour by January 2026. Sun Belt markets prioritize waterproof, resilient surfaces due to humidity and flood risks, aligning with the Southeast’s 26.41% 2025 share and the Southwest’s 7.12% growth rate. The Federal Housing Administration’s 203(k) rehabilitation pathway supports material upgrades in distressed properties, which broadens access for resilient flooring in affordable housing retrofits as agencies standardize specification and compliance.
Residential Remodeling and Replacement Cycle Resilience
Rate lock-in discourages moves yet channels equity and savings toward renovation, which stabilizes project backlogs for flooring dealers and installers. Research shows that rate lock-in reduced mobility during 2021-2022, which suppressed transactions while preserving upgrade budgets among owners who preferred to stay put[2]Staff Economists, “Finance And Economics Discussion Series 2024-088r1,” Board of Governors of the Federal Reserve System, federalreserve.gov . Homeowners report that affordability constraints do not deter planned renovations, and 2024 remodeling outlays remained strong by historical standards despite higher financing costs. In new construction, hard-surface preferences in kitchens and living rooms reset buyer expectations, which then spill into existing-home updates that replace textile surfaces with resilient or laminate alternatives. This backdrop keeps the United States floor covering market tied closely to repair and remodel cycles, which tend to be less volatile than the pace of existing home sales.
Commercial Refurbishment in Healthcare, Education, Hospitality
Healthcare construction spending reached USD 68.7 billion on an annualized basis by December 2025, with expanding outpatient and medical office footprints that specify seamless sheet vinyl in clinical zones and LVT or carpet tile in administrative spaces. Education spending totaled USD 140.2 billion, with K-12 representing the majority of activity, which funds replacements of aging VCT with low-emitting LVT and carpet tile to meet standards such as LEED and CHPS. Hospitality advanced to USD 24.8 billion with a 2.0% year-over-year gain as properties cycle through 5–7-year refresh intervals that prioritize durable, easily cleaned surfaces aligned with brand schemes. Renovation and conversion activity between 300,000 and 400,000 rooms in 2025 underscores the recurring nature of floor replacements in this asset class. This combination of healthcare, education, and hospitality work adds a stable nonresidential base for the United States floor covering market as managers seek low-VOC, resilient, and modular options with rapid install.
Shift to PVC-Free, Low-VOC, Low-Carbon Specifications
Procurement teams now weigh indoor air quality credentials heavily, and FloorScore is widely accepted for LEED v4.1, WELL, BREEAM, CHPS, and Green Globes submissions. GREENGUARD Gold has become a frequent requirement in schools and healthcare, reinforcing low-emitting thresholds for sensitive-use environments. Manufacturers respond with product lines that reduce or eliminate PVC content and formaldehyde-bearing binders, with documented moves like magnesium oxide cores in premium rigid core to avoid chlorine-based resins. Declare labels from the International Living Future Institute are gaining traction with public owners, promoting full ingredient disclosure and avoiding Red List chemicals in competitive bids. Policy signals such as EPA’s formaldehyde emission standards and California’s Proposition 65 enforcement have reinforced the shift to water-based adhesives and low-emitting backings, which raises the sustainability bar in the United States floor covering market.
Restraints Impact Analysis*
| Restraint | (~) % Impact on CAGR Forecast | Geographic Relevance | Impact Timeline |
|---|---|---|---|
| Housing affordability, high mortgage rates suppress turnover | - 1.4% | National, acute in high-cost Northeast, West Coast metros | Medium term (2-4 years) |
| Trade actions/tariffs on LVT and inputs elevate costs | - 0.9% | National, import-reliant distributors, Southeast ports | Short term (≤ 2 years) |
| Installer labor constraints raise install costs/lead times | - 0.7% | National, most severe in the Midwest, rural markets | Long term (≥ 4 years) |
| EPR/take-back compliance adds costs and complexity | - 0.3% | California, Oregon, Maine, Washington, Colorado, Minnesota, Maryland | Long term (≥ 4 years) |
| Source: Mordor Intelligence | |||
Housing Affordability, High Mortgage Rates Suppress Turnover
Thirty-year mortgage rates staying elevated reduces existing home sales, which removes a historic catalyst for move-in-driven flooring replacements. Rate lock-in leaves most borrowers below current rate levels, which immobilizes listings and elongates tenure even as owners invest in targeted renovations. Research from the Federal Reserve attributes a large share of the mobility decline to rate lock-in, which tightens for-sale inventory and sustains price levels despite higher financing costs. Existing home sales slowed to cyclical lows, creating a headwind for entry-level and mid-tier purchases that often accompany relocations. Households that remain in place still undertake selective upgrades, but fewer moves dampen the volume of full-home replacements that usually accompany ownership changes in the United States floor covering market.
Trade Actions/Tariffs on LVT and Inputs Elevate Costs
Section 301 duties on Chinese-origin LVT and related inputs continue to affect cost structures, while importers shift sourcing to alternate Asian hubs or domestic capacity to mitigate exposure. Changes introduced in late 2025 extended tariff reach across engineered wood and laminate categories, which compounded price pressures and prompted multiple price adjustments at the distributor level. Customs guidance and product classification rulings influence sourcing strategies and landed costs, adding complexity to procurement planning and delivery timing. Domestic capacity expansion programs by Shaw, Mohawk, and AHF aim to reduce reliance on imports and stabilize supply, but new lines require ramp periods before they ease near-term constraints. This environment keeps the United States floor covering market sensitive to policy updates and trade enforcement cycles that can alter price parity across categories.
*Our forecasts treat driver/restraint impacts as directional, not additive. The impact forecasts reflect baseline growth, mix effects, and variable interactions.
Segment Analysis
By Product Type: Resilient Formats Reshape Replacement Cycles
Carpet & Area Rugs held 31.83% share in 2025, while vinyl flooring posted the fastest growth at a 7.72% CAGR as homeowners and facility managers favored waterproof, low-maintenance surfaces in high-use spaces. This shift reflects a broad preference for hard surfaces in main living areas, with new-home norms setting expectations that migrate into remodel specifications. Rigid core platforms, coupled with improved digital printing and abrasion resistance, position LVT as the default solution in moisture-prone rooms where ceramic would have historically dominated. Laminate’s improved water-resistant cores and surface realism offer a value alternative where premium LVT’s price points are a barrier, which broadens addressable budgets. Wood maintains a premium niche supported by aspirational aesthetics and resale dynamics, though recent tariff updates are increasing the appeal of domestically made engineered options in the United States floor covering market.
Ceramic & Porcelain Tiles sustain relevance in commercial kitchens and wet rooms due to code-driven sanitation requirements and impact resistance. Stone remains anchored in ultra-premium residential and signature hospitality settings where long lifecycle and prestige value justify specialized install and maintenance. Other products, including rubber, linoleum, and bio-based lines, gain incremental share in institutions that emphasize embodied carbon reduction and transparent ingredients. As a result, resilient formats hold the most robust growth trajectory among product types, and category leaders continue to invest in domestic lines to stabilize supply and deliver faster service in the United States floor covering market.


By End-User: Healthcare Facilities Drive Commercial Growth
Residential accounted for 62.31% of 2025 volume and value, supported by steady remodeling outlays even as mobility slowed under higher rates. Commercial Healthcare Facilities represent the fastest-growing nonresidential slice with a 6.75% CAGR, given outpatient migration, urgent care scaling, and medical office buildings catching up with acute care footprints. Clinical spaces emphasize homogeneous sheet for infection control, while administrative and patient areas often opt for LVT and carpet tile for comfort and noise attenuation. Hospitality & Leisure refresh every 5-7 years, which entrenches floor replacements as an operating expense rather than a one-time upgrade and keeps contractors active in cyclical downtimes. Education continues to replace legacy VCT with low-VOC alternatives to meet LEED and CHPS goals in high-traffic corridors and learning spaces.
Retail and corporate offices remain mixed as remote work compresses densities, although footprints that remain in use still cycle through selective refreshes to align with brand and wellness standards. Government facilities prioritize compliant low-emitting materials and Buy American criteria where applicable, which advantages suppliers with verified product declarations, certifications, and domestic lines. Specialty commercial users such as logistics and data centers demand surfaces that withstand heavy loads and chemical exposure, which retain roles for VCT, epoxy, and polished concrete outside traditional decorative categories. This distribution of end uses supports a balanced growth profile for the United States floor covering market through multi-channel demand.
By Distribution Channel: Online Accelerates Direct Fulfillment
B2C/Retail controlled 71.23% share in 2025 through home centers and specialty dealers, with digital journeys now central to evaluation and purchase. Online is the fastest-growing path at a 6.97% CAGR, as visualization tools and sampling kits help buyers finalize choices and complete orders without showroom visits. Specialty retailers continue to win on complex installs and bespoke selections, and they rely on vendor rebates and buying groups to keep pace with big-box pricing. B2B/Contractor channels deliver job-site services, credit, and logistics that most retail networks do not match, and their influence grows with installer scarcity and project complexity. The United States floor covering market continues to blend digital and in-person workflows, with online configuration tools compressing selection time and reducing returns in both residential and commercial projects.
Installers selectively steer customers toward formats that match labor availability and risk tolerance, which influences channel-level mix and inventory choices. Retailers expand partnerships with certified crews, and project owners favor suppliers that can commit to schedule integrity under tight windows. Direct-to-consumer fulfillment options reduce friction for straightforward installs, and several brands now support quick-ship programs for top sellers to align with peak demand seasons. Over time, channels converge around service, speed, and predictable outcomes rather than the legacy divide between showroom and pro desk in the United States floor covering market. These patterns strengthen online adoption while preserving the specialist role for complex projects that need hands-on oversight.
Geography Analysis
The Southeast led with a 26.41% share in 2025 on the strength of in-migration and year-round building activity that supports a high cadence of new and replacement installations. The region also posted the highest annualized housing starts at 741,000 in December 2025, a level that tops other regions and aligns with resilient demand for waterproof formats in humid climates. The Southwest is set to grow fastest at a 7.12% CAGR through 2031, anchored by population gains around Phoenix, Las Vegas, and Albuquerque, and by building practices that favor low-maintenance hard surfaces. The West recorded 334,000 annualized housing starts with environmental regulations that favor low-emitting and energy-efficient materials, which pushes demand toward certified resilient and tile products[3]Proposition 65 Office, “Safe Drinking Water and Toxic Enforcement Act of 1986,” California OEHHA, oehha.ca.gov. These conditions continue to shape product mix and specifications in the United States floor covering market by region.
The Midwest posted 177,000 annualized starts, with slower population growth but steady remodel demand in older housing stock that cycles through replacements on predictable timelines. Adoption of 2024 energy codes steers specifications toward assemblies that pair efficiently with insulated subfloors, which strengthens the case for resilient and laminate in certain climates. The Northeast was the smallest in new construction at 152,000 annualized starts, but it remains a premium market with higher per-square-foot project budgets and strict building codes. Local policies such as New York City’s Local Law 97 and Massachusetts’ Stretch Energy Code intensify the focus on low-carbon, low-emitting flooring in public and private projects. Across all regions, installer availability is tighter in rural zones, while larger Sun Belt metros benefit from more fluid labor pools that can absorb demand surges more easily in the United States floor covering market.
Coastal states often lead on specification frameworks and procurement standards, which pull best practices into broader adoption over time. Agencies also bring EPR and take-back requirements into solicitations, which reward suppliers that invest in logistics and data systems to handle recovery. As procurement evolves, suppliers with U.S. manufacturing and verified declarations often gain an edge in local awards due to perceived reliability and compliance alignment. These regional specifics collectively create a resilient base for the United States floor covering market while reinforcing the importance of supply chain agility and certification coverage.
Competitive Landscape
The supplier base is moderately fragmented, with no single firm commanding an outsized share across all categories, and the top tier focuses on capacity additions and product innovation to protect positions. Mohawk, Shaw, Tarkett, Mannington, and AHF collectively account for a sizable portion of sales, and that concentration shapes pricing benchmarks and dealer programs across carpet, resilient, and laminate. Company disclosures point to multi-year capital programs oriented around domestic LVT and SPC lines, plus modernization of carpet and laminate assets to improve yields and shorten delivery windows. These moves aim to offset tariff exposure and trans-Pacific logistics risks while boosting responsiveness to retailer and contractor needs in the United States floor covering market.
Shaw completed a USD 90 million expansion at its Ringgold, Georgia, site and reports strong utilization that supports LVT and WPC requirements while reducing reliance on imported inventory[4]Shaw Press Office, “Shaw Invests USD 90 Million To Expand Georgia Manufacturing,” Shaw Industries, shawinc.com . Mohawk reported USD 450 million in capital expenditures in 2024 and plans USD 520 million for 2025, with spending directed to Dalton and Mexicali sites for LVT, laminate, and carpet capacity. AHF secured a significant SPC footprint through acquisition, placing the company among the largest domestic rigid core producers and reinforcing supply options under shifting trade policy. Digital specification platforms and BIM content investments by leading brands help streamline design workflows and differentiate customer experience in categories that risk commoditization.
White-space growth centers on PVC-free, resilient, low-VOC carpet tile systems and adhesives with reduced emissions, which align with public-sector awards and healthcare standards. Brands have launched domestic SPC lines under Buy America and related requirements, which creates opportunities in infrastructure-linked and institutional projects. Companies are also exploring circularity and take-back solutions at scale, with pilots tied to EPR readiness and client sustainability targets. These strategies underpin a competitive environment defined by reliability, compliance, and speed to market in the United States floor covering market.
United States Floor Covering Industry Leaders
Mohawk Industries, Inc.
Shaw Industries Group, Inc.
Tarkett (North America)
Mannington Mills, Inc.
AHF Products (Bruce, Armstrong Flooring brand)
- *Disclaimer: Major Players sorted in no particular order

Recent Industry Developments
- January 2026: Shaw Industries’ Ringgold, Georgia, resilient plant operated at high utilization following completion of the USD 90 million expansion, increasing domestic capacity for LVT and WPC and reducing reliance on imports.
- November 2025: MSI Surfaces introduced Studio Adlar, a USA-manufactured SPC LVP collection with a 30-mil wear layer that targets commercial performance and supports BAA and BABA-compliant projects.
- December 2025: Mohawk Industries reported USD 450 million in 2024 capital expenditures and USD 520 million planned for 2025 to enhance LVT, laminate, and carpet production capacity in North America.


Research Methodology Framework and Report Scope
Market Definitions and Key Coverage
Our study defines the United States floor covering market as all factory-made surfacing materials, carpet and area rugs, resilient sheets and tiles (including LVT/SPC/WPC), and non-resilient hard surfaces such as wood, laminate, and ceramic that are sold for installation on interior floors in residential or non-residential buildings, valued at first point of sale.
Scope exclusion: wear layers, underlays, installation sundries, and site-applied floor coatings are not counted.
Segmentation Overview
- By Product Type
- Carpet & Area Rugs
- Wood Flooring
- Ceramic & Porcelain Tiles
- Laminate Flooring
- Vinyl Flooring ( LVT, Sheet, VCT)
- Stone Flooring
- Other Products
- By End-User
- Residential
- Commercial
- Hospitality & Leisure
- Retail & Shopping Centers
- Healthcare Facilities
- Education
- Corporate Offices
- Public & Government Buildings
- Other Commercial Users
- By Distribution Channel
- B2C / Retail
- Home Centers
- Specialty Flooring Stores
- Online
- Other Distribution Channels
- B2B / Contractors
- B2C / Retail
- By Region
- Northeast
- Southeast
- Midwest
- Southwest
- West
Detailed Research Methodology and Data Validation
Primary Research
Mordor analysts interviewed flooring manufacturers, regional distributors, buying-group executives, specialty retailers, and commercial flooring contractors across the Northeast, Southeast, Midwest, Southwest, and West. These discussions clarified channel mark-ups, installation mix shifts, post-tariff sourcing moves, and realistic square-foot pricing, allowing us to refine assumptions and reconcile any gaps left by desk work.
Desk Research
We first reviewed publicly available statistics from the U.S. Census Bureau's Monthly Construction Spend, the Bureau of Labor Statistics' Producer Price Index for flooring products, and housing starts data from the National Association of Home Builders to size the demand pool. Trade flows were mapped with United States International Trade Commission shipment codes, while usage trends were cross-checked against annual surveys by the Tile Council of North America and the Carpet & Rug Institute. Company revenues and plant capacities were pulled from D&B Hoovers and validated through 10-K filings and investor decks.
These sources let us benchmark volumes, average selling prices, and import penetration before moving to deeper validation. The list above is illustrative; many additional industry journals, patent abstracts, and government releases were consulted during data gathering and clarification.
Market-Sizing & Forecasting
A top-down model links construction spend, housing turnover, and floor area coefficients to derive total installable square footage, which is then priced using blended ASPs. Selective bottom-up roll-ups of listed suppliers and sampled dealer invoices are applied to sense-check results. Key variables include new single-family starts, existing-home sales, non-residential square-foot completions, import share of resilient tiles, and PPI movements, each forecast through multivariate regression supported by expert consensus. Where hard data were missing, especially for niche channels, we bridged gaps with regional penetration rates from our interview panel and adjusted for documented channel margins.
Data Validation & Update Cycle
Outputs pass three rounds of analyst peer review in Mordor before sign-off. Variances over preset thresholds trigger source re-checks or fresh calls. The model is refreshed each year, with interim updates when material events, such as tariff shifts, large plant openings, or sudden demand shocks, occur, so clients receive the latest view.
Why Mordor's United States Floor Covering Baseline Commands Confidence
Published estimates often diverge because firms pick different product baskets, pricing points, or refresh cadences.
Key gap drivers include whether loose-lay mats, garage coatings, or freight charges enter the valuation; some studies report conservative 2023 recession lows, while others extrapolate aggressive post-COVID rebounds; currency and inflation adjustments also vary.
Benchmark comparison
| Market Size | Anonymized source | Primary gap driver |
|---|---|---|
| USD 45.47 B (2025) | Mordor Intelligence | - |
| USD 43 B (2022) | Global Consultancy A | excludes LVT imports and applies 2022 recession pricing |
| USD 21.25 B (2023) | Industry Journal B | values only manufacturer shipments, omits dealer mark-ups |
| USD 26.5 B (2024) | Regional Consultancy C | counts residential channels but omits commercial retrofit spend |
Taken together, the comparison shows that Mordor's balanced scope, current-year pricing, and annual refresh cadence deliver a transparent, decision-ready baseline that users can trace back to clear variables and repeatable steps.


Key Questions Answered in the Report
What is the current size and growth outlook for the United States floor covering market?
The United States floor covering market size was USD 44.43 billion in 2025 and is projected to reach USD 64.24 billion by 2031 at a 6.36% CAGR.
Which product category is growing fastest in the United States floor covering market?
Vinyl flooring led growth with a projected 7.72% CAGR due to its waterproof performance, format diversity, and faster installation advantages.
Which end-use segment will expand the quickest through 2031?
Commercial healthcare facilities are projected to advance at a 6.75% CAGR as outpatient and clinic spaces scale across urban and suburban corridors.
What regional dynamics matter most for demand planning?
The Southeast held a 26.41% share in 2025, while the Southwest posts the fastest trajectory at a 7.12% CAGR, reflecting Sun Belt migration and resilient-friendly specifications.
How are tariffs and domestic capacity affecting supply?
Section 301 duties and reciprocal measures on engineered categories raised import costs, which accelerated domestic investments by Shaw, Mohawk, and AHF to shorten lead times and hedge policy risk.
Which certifications are shaping specifications in institutional projects?
FloorScore and GREENGUARD Gold lead low-emitting standards, while Declare labels and EPA formaldehyde rules push material transparency and low-VOC chemistries.
Page last updated on:


