US Electric Bus Battery Pack Market Size and Share
Market Overview
| Study Period | 2017 - 2029 |
|---|---|
| Forecast Data Period | 2025 - 2029 |
| Historical Data Period | 2017 - 2023 |
| Market Size (2025) | USD 68.49 Million |
| Market Size (2029) | USD 194 Million |
| Growth Rate (2025 - 2029) | 29.73% CAGR |
| Market Concentration | High |
Major Players*Disclaimer: Major Players sorted in no particular order Image © Mordor Intelligence. Reuse requires attribution under CC BY 4.0. | |

US Electric Bus Battery Pack Market Analysis by Mordor Intelligence
The US Electric Bus Battery Pack Market size is estimated at 68.49 million USD in 2025, and is expected to reach 194 million USD by 2029, growing at a CAGR of 29.73% during the forecast period (2025-2029).
The US electric bus battery pack industry is undergoing a transformative phase driven by increasing environmental consciousness and stringent emission regulations. Major cities and transit authorities are accelerating their transition to zero-emission public transportation systems, with California leading the charge through its mandate for all transit buses to be zero-emission vehicles by 2040. The push towards sustainability has catalyzed investments in electric bus battery technology and manufacturing capabilities, with companies like Proterra establishing new production facilities. This shift is further supported by federal and state-level initiatives, including the Biden administration's commitment to modernizing public transportation infrastructure and reducing carbon emissions.
Technological advancements in battery chemistry and design are reshaping the industry landscape, with manufacturers focusing on developing more efficient and cost-effective solutions. The integration of advanced battery management systems and thermal control technologies has significantly improved the performance and reliability of electric bus batteries. Battery pack costs have shown a consistent decline, reaching approximately $141 per kWh in 2023, making electric buses increasingly competitive with traditional diesel alternatives. These improvements have also led to enhanced range capabilities and faster charging times, addressing key operational concerns of transit authorities.
The domestic manufacturing ecosystem for electric bus battery packs is expanding rapidly, with several companies establishing production facilities across the United States. In early 2023, Proterra manufactured its first battery pack at its new Powered 1 facility in Greer, South Carolina, marking a significant milestone in localizing the supply chain. Strategic partnerships between battery manufacturers and bus OEMs are becoming increasingly common, as evidenced by collaborations between major players like LG Energy Solution and various bus manufacturers. This vertical integration trend is helping optimize production costs and ensure a steady supply of critical components.
The competitive landscape is evolving with the entry of new players and the expansion of existing manufacturers' capabilities. Leading companies are investing in research and development to differentiate their offerings through improved energy density, longer lifecycle, and enhanced safety features. The market structure is characterized by a mix of established players and innovative startups, with Proterra maintaining its position as a market leader with a 12.27% share in 2022. The industry is witnessing a shift towards the standardization of battery pack specifications and charging infrastructure, which is expected to facilitate broader adoption of electric buses across different transit agencies and operational environments. The ongoing bus electrification efforts are crucial in achieving these goals.
US Electric Bus Battery Pack Market Trends and Insights
Tesla, Toyota, Ford, Hyundai, and Honda dominate the US electric vehicle battery pack market
- The electric vehicle market is highly consolidated, with five major players, Tesla, Toyota Group, Ford Group, Hyundai, and Honda, accounting for almost 75% of the market in 2023. Tesla is the largest seller of electric vehicles in the United States, accounting for around 30% of the market. The company focuses on innovative technologies and has strong strategic partnerships with manufacturers of various EV components (such as batteries). Being a US-based company, it has a strong customer base with great product and service offerings across the United States.
- Toyota Group is the second largest seller of electric vehicles, accounting for around 28% across the United States. The company has a strong supply and distribution network and operates as a reliable brand among customers with wide product offerings of various electric cars. The Ford Group holds 3rd place in EV sales across the United States, with around 10% of the market share. Being a domestic brand, the company has strong goodwill among customers with a wide product and service network in the United States.
- Hyundai is the fourth-largest player, accounting for around 5.4% of the market share in EV sales across the United States. The company has a strong production and supply chain network, with wide innovative products offered at reasonable prices over other brands. Honda is the fifth-largest player in the EV market, maintaining its market share at around 5%. Other players selling EVs in the United States include Kia, Jeep, BMW, and Volvo.


Tesla maintains dominance, holding the majority share, and contributes to the major demand for battery packs in the United States
- The United States is one of the most popular countries in North America, where the demand for EVs steadily increased during 2017-2023. The market for electric SUVs is steadily increasing as consumer preferences gradually move to a more sporty and adventurous drive and other benefits at a comparable price point as other EVs like sedans. SUVs offer more leg and headroom, which attracts customers as a comfortable ride is one of the main priorities.
- In the US EV battery pack market, sales of the Tesla Model Y have grown significantly. The car attracts customers seeking an electric car with long-range, good seating capacity, and large cargo capacity. Companies offering electric sedans are also getting good responses from the US population. Tesla Model 3 was also among the best sellers in the US EV battery pack market in 2023, owing to its full electric technology, high-performance capabilities, fast charging technology, and good range offerings.
- International brands also offer electric SUVs and sedans in the US EV battery pack market. Toyota RAV4 plug-in hybrid is one of the popular cars and witnessed good sales in 2023. A good service network, lower prices than other brands, and a reliable brand image are reasons for the growing sales of Toyota cars. Another good-selling car by Toyota in the US EV battery pack market is the Sienna, offered with a hybrid powertrain; consumers with big families looking for 7-seater cars have positively responded to the Toyota Sienna. Other vehicles competing in the US EV battery pack market include the Toyota Highlander, Jeep Wrangler, Toyota Camry, Honda Accord, and Ford Mustang Mach-E.

OTHER KEY INDUSTRY TRENDS COVERED IN THE REPORT
- Government investments boost electrification of buses and the demand for bus battery packs in the United States
- Decreasing battery pack prices and government initiatives drive the electric vehicle battery pack market in the United States
- Declining battery prices transform electric mobility; this trend was expected to continue in 2023
- Rising demand and strategic product launches drive the electric vehicle battery pack market in the United States
- Growing demand for electric vehicles in the United States drives the usage of NMC, NCA, and LFP battery chemistries
- Rising electric vehicle adoption in the United States drives the demand for battery materials, with NMC batteries dominating the market
- Advancements in battery technology are driving the growth of electric vehicles in the United States
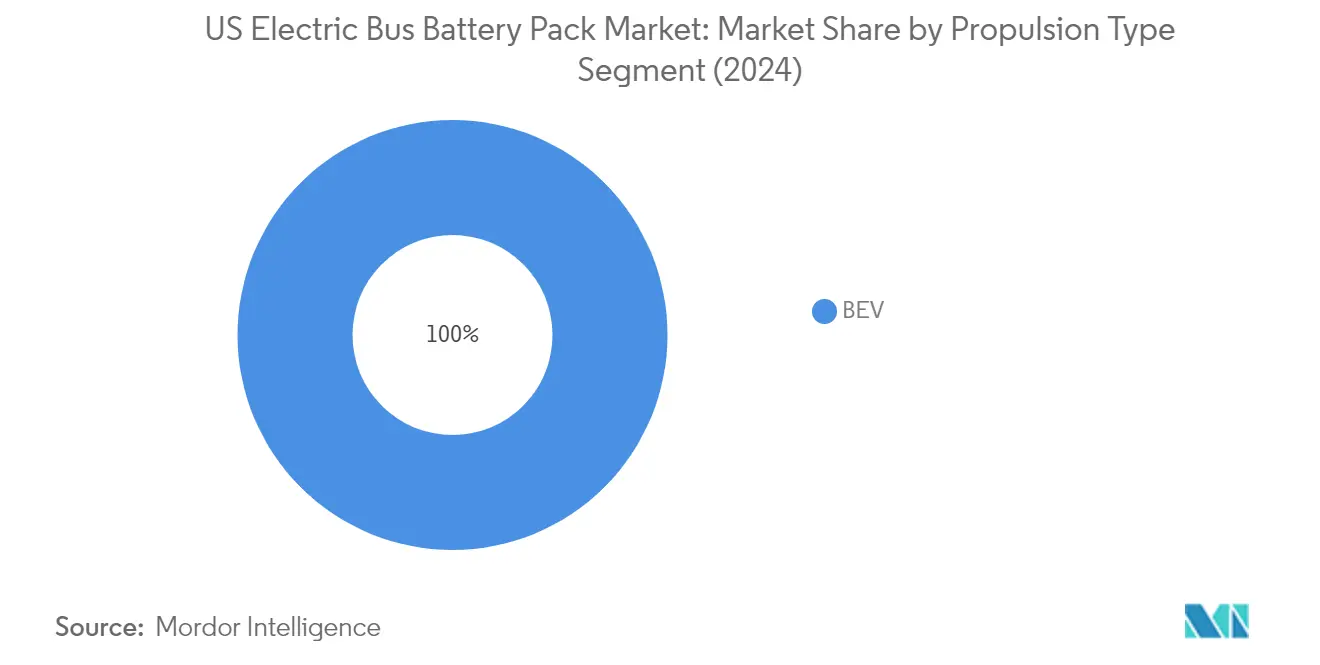
Segment Analysis: Propulsion Type
BEV Segment in US Electric Bus Battery Pack Market
Battery Electric Vehicles (BEVs) have established complete dominance in the US electric bus battery pack market, commanding approximately 100% of the market share in 2024. This overwhelming market presence can be attributed to several factors, including the superior performance capabilities of BEVs, their alignment with zero-emission goals, and strong government support through initiatives and funding programs. The segment's growth is further bolstered by major manufacturers like Proterra, BYD, and New Flyer, who have committed to expanding their BEV bus offerings. The segment is experiencing robust growth and is projected to maintain its strong momentum through 2029, driven by increasing adoption of electric buses in public transportation, technological advancements in battery technology, and the expanding charging infrastructure network across the United States. The ongoing focus on reducing carbon emissions and improving air quality in urban areas continues to favor BEV adoption, while declining battery costs and improving energy density make these vehicles increasingly attractive to transit agencies and operators.

Segment Analysis: Battery Chemistry
NMC Segment in US Electric Bus Battery Pack Market
The Nickel Manganese Cobalt (NMC) battery chemistry segment maintains its dominant position in the US electric bus battery pack market, commanding approximately 58% market share in 2024. This substantial market presence can be attributed to NMC batteries' superior energy density, averaging around 200 Wh/kg, and impressive cycle life of about 3,000 cycles. Major electric bus manufacturers like Proterra and BYD have integrated NMC battery technology into their flagship models, leveraging its optimal balance of performance, cost-effectiveness, and reliability. The segment's growth is further bolstered by continuous technological advancements in NMC chemistry, resulting in enhanced thermal stability and improved safety features. Additionally, the increasing focus on range optimization and fast-charging capabilities has made NMC batteries particularly attractive for electric bus applications, especially in urban transit operations where reliable performance is crucial.
LFP Segment in US Electric Bus Battery Pack Market
The Lithium Iron Phosphate (LFP) battery chemistry segment is experiencing remarkable growth in the US electric bus battery pack market, with a projected growth rate of approximately 57% during 2024-2029. This impressive growth trajectory is driven by several key factors, including LFP batteries' enhanced safety profile, extended cycle life, and improving cost competitiveness. The segment is benefiting from significant technological advancements, particularly in energy density optimization and thermal management systems. Major battery manufacturers are investing heavily in LFP technology development, focusing on addressing previous limitations while maintaining the chemistry's inherent advantages. The segment's growth is further supported by increasing adoption among electric bus manufacturers who prioritize operational safety and long-term reliability. Additionally, the expanding charging infrastructure and improving battery management systems are making LFP batteries increasingly attractive for electric bus applications.
Remaining Segments in Battery Chemistry
The remaining segments in the battery chemistry market, including NCA (Nickel Cobalt Aluminum) and other emerging chemistries, continue to play significant roles in shaping the US electric bus battery pack landscape. NCA batteries are particularly notable for their high energy density and superior performance characteristics, making them suitable for long-range electric bus applications. Other emerging battery chemistries, including solid-state batteries and advanced lithium-based formulations, are gaining attention for their potential to offer breakthrough improvements in safety, energy density, and charging capabilities. These segments are driving innovation in the market, with manufacturers exploring hybrid chemistry solutions and novel material combinations to optimize performance. The diversity of battery chemistries available is enabling electric bus manufacturers to select the most appropriate technology based on specific operational requirements and route characteristics.
Segment Analysis: Capacity
40-80 kWh Segment in US Electric Bus Battery Pack Market
The 40-80 kWh battery pack segment dominates the US electric bus battery pack market, commanding approximately 66% market share in 2024. This segment's prominence can be attributed to its optimal balance between driving range and weight considerations, making it particularly suitable for urban transit operations. The capacity range offers sufficient energy storage for typical daily routes while maintaining reasonable vehicle weight and cost efficiency. Major manufacturers like Proterra and BYD have extensively deployed this capacity range in their electric bus models, recognizing its effectiveness in meeting the operational requirements of transit agencies. The segment's success is further bolstered by advancements in battery management systems and thermal control technologies, which have enhanced the performance and reliability of these mid-range capacity battery packs.
Above 80 kWh Segment in US Electric Bus Battery Pack Market
The above 80 kWh segment is experiencing the most rapid growth in the US electric bus battery pack market, driven by increasing demand for longer-range electric buses and enhanced operational capabilities. This segment's growth is supported by technological advancements in battery chemistry and thermal management systems, enabling higher energy densities and improved performance. Transit agencies are increasingly favoring higher capacity battery packs to ensure extended operational hours and reduce charging frequency. The segment benefits from ongoing developments in fast-charging infrastructure and smart energy management systems, which help optimize the utilization of larger battery packs. Additionally, government initiatives promoting zero-emission public transportation have created a favorable environment for the adoption of high-capacity battery packs.
Remaining Segments in Capacity
The remaining capacity segments, including 15-40 kWh and less than 15 kWh, serve specific niches in the US electric bus battery pack market. The 15-40 kWh segment caters to shorter routes and urban shuttle services where frequent charging opportunities are available. These smaller capacity battery packs offer advantages in terms of reduced vehicle weight and lower upfront costs, making them suitable for specific operational scenarios. The less than 15 kWh segment primarily serves specialized applications such as campus shuttles and controlled environment operations. Both segments continue to evolve with improvements in battery technology and charging infrastructure, maintaining their relevance in specific use cases within the electric bus ecosystem.
Segment Analysis: Method
Laser Segment in US Electric Bus Battery Pack Market
The laser method has emerged as the dominant technology in the US electric bus battery pack market, commanding approximately 75% of the total market volume in 2024. This substantial market share can be attributed to several key advantages that laser technology offers in battery pack manufacturing. The laser method provides superior precision and control during the welding process, resulting in stronger and more reliable connections between battery cells. Additionally, this technology minimizes the risk of damage to battery cells and contributes to reducing the overall weight of the battery pack. The adoption of laser technology has been further driven by the growing demand for lighter and more efficient electric buses, as well as the increasing focus on manufacturing high-quality battery packs that meet stringent safety and performance standards. Major electric bus manufacturers have increasingly integrated laser-based manufacturing processes into their production lines to enhance the quality and reliability of their battery packs.
Laser Segment Growth in US Electric Bus Battery Pack Market
The laser segment in the US electric bus battery pack market is experiencing a remarkable growth trajectory, driven by continuous technological advancements and increasing adoption of electric buses. The segment's expansion is supported by ongoing improvements in laser welding technology, which enables manufacturers to achieve higher precision, better control, and enhanced efficiency in battery pack production. The technology's ability to deliver stronger and more reliable connections between battery cells positions it as a key enabler for meeting the evolving requirements of the electric bus industry. Furthermore, the integration of advanced automation and control systems in laser-based manufacturing processes has significantly improved production efficiency and quality consistency. The growing emphasis on sustainable transportation solutions and stringent quality requirements in battery pack manufacturing continues to drive the adoption of laser technology across the industry.
Segment Analysis: Component
Cathode Segment in US Electric Bus Battery Pack Market
The cathode segment dominates the US electric bus battery pack market, commanding approximately 69% of the total market share in 2024. This significant market position is attributed to cathode materials' crucial role in determining battery performance, energy density, and overall efficiency. Leading OEMs like Proterra, New Flyer, and BYD have shown a strong preference for advanced cathode materials, particularly NCM (Nickel Cobalt Manganese) cathodes, due to their superior energy density and enhanced performance characteristics. The segment's growth is further supported by ongoing investments in research and development aimed at improving cathode material composition and manufacturing processes. Additionally, the increasing focus on sustainable transportation and the push for electric bus adoption by various municipalities and transit agencies across the United States has created a robust demand for high-performance cathode materials.
Separator Segment in US Electric Bus Battery Pack Market
The separator segment is emerging as the fastest-growing component in the US electric bus battery pack market, with projections indicating robust growth from 2024 to 2029. This growth is primarily driven by technological advancements in separator materials, particularly the adoption of ceramic-coated polyethylene separators that offer enhanced thermal stability and safety features. The segment's expansion is further supported by increasing investments in research and development of advanced separator technologies, including nanofiber-based separators and innovative coating materials. Major manufacturers are focusing on developing separators with improved porosity, mechanical strength, and thermal stability to meet the demanding requirements of electric bus applications. The integration of artificial intelligence and machine learning in separator design and optimization is also contributing to the segment's growth trajectory, enabling manufacturers to develop more efficient and reliable products.
Remaining Segments in Component Market
The anode and electrolyte segments play vital roles in the US electric bus battery pack market, each contributing unique characteristics to overall battery performance. The anode segment focuses on developing materials with higher energy storage capacity and improved charging capabilities, with graphite remaining the predominant material choice. Manufacturers are exploring silicon-based anodes and other advanced materials to enhance battery performance. Meanwhile, the electrolyte segment concentrates on developing advanced formulations that improve ion conductivity and battery safety. Both segments are witnessing continuous innovation in material science and manufacturing processes, with manufacturers focusing on improving safety, performance, and cost-effectiveness of their components.
Segment Analysis: Material Type
Natural Graphite Segment in US Electric Bus Battery Pack Market
Natural graphite has emerged as the dominant material type in the US electric bus battery pack market, commanding approximately 30% of the total market value in 2024. This material's prominence can be attributed to its superior conductivity, cost-effectiveness, and eco-friendly characteristics. Natural graphite's particle size typically ranges from 15 1⁄4m to 25 1⁄4m, offering optimal performance in battery applications. The material's high intercalation capacity, averaging around 340 mAh/g, makes it particularly suitable for electric bus battery packs, enabling enhanced energy storage and extended battery lifespan. Major manufacturers and suppliers in the US market, including Asahi Kasei, Celgard, and Toray Industries, have been instrumental in maintaining the steady supply of high-quality natural graphite materials for battery production.
Nickel Segment in US Electric Bus Battery Pack Market
The nickel segment is positioned for remarkable growth in the US electric bus battery pack market, with projections indicating an impressive growth rate of approximately 52% from 2024 to 2029. This substantial growth trajectory is driven by nickel's crucial role in enhancing battery energy density and overall performance. The material's superior characteristics in terms of thermal stability and durability make it increasingly attractive for electric bus applications. Leading manufacturers are investing heavily in nickel-based battery technology development, focusing on improving efficiency and reducing costs. The segment's growth is further supported by advancements in manufacturing processes and increasing demand for high-performance electric bus batteries that can deliver extended range and reliable operation.
Remaining Segments in Material Type
The other significant materials in the US electric bus battery pack market include lithium, cobalt, manganese, and various other supplementary materials. Lithium continues to play a fundamental role in battery chemistry, offering high energy density and excellent cycle life. Cobalt, despite supply chain challenges, remains crucial for battery stability and performance. Manganese has gained attention for its cost-effectiveness and ability to enhance battery safety. Other materials, including aluminum and copper, contribute to various aspects of battery functionality, from thermal management to electrical conductivity. Each of these materials brings unique properties and advantages to battery pack manufacturing, collectively supporting the advancement of electric bus battery technology.
Competitive Landscape
Top Companies in US Electric Bus Battery Pack Market
The US electric bus battery pack market is characterized by intense competition and continuous innovation among key players. Companies are heavily investing in research and development to enhance battery performance, energy density, and charging capabilities while simultaneously working to reduce production costs. Strategic partnerships between battery manufacturers and electric bus OEMs have become increasingly common, enabling vertical integration and supply chain optimization. Manufacturing facility expansions, particularly in regions with strong government support for bus electrification, demonstrate the industry's commitment to increasing production capacity. Companies are also focusing on developing advanced battery management systems, implementing sustainable manufacturing practices, and establishing robust after-sales service networks to maintain competitive advantages.
Market Dominated by Global Technology Leaders
The US electric bus battery pack market exhibits a moderately consolidated structure, with a mix of global conglomerates and specialized battery manufacturers. Major players include established Asian manufacturers who have successfully leveraged their technological expertise and economies of scale to capture significant market share, alongside emerging domestic players focusing on innovative battery solutions. These companies are increasingly establishing local manufacturing facilities to comply with "Buy America" requirements and reduce supply chain dependencies. The market has witnessed several strategic partnerships and joint ventures between battery manufacturers and automotive companies, aimed at securing supply chains and accelerating technological advancement.
The competitive landscape is further shaped by the presence of vertically integrated electric bus manufacturers who develop their own battery systems, creating additional competition for pure-play battery manufacturers. Market entry barriers remain high due to substantial capital requirements, technical expertise needs, and stringent quality and safety standards. The industry has seen limited merger and acquisition activity, with companies preferring strategic partnerships and joint ventures to full integration, allowing them to maintain flexibility while sharing technological and financial resources.
Innovation and Localization Drive Future Success
Success in the US electric bus battery pack market increasingly depends on companies' ability to develop cost-effective, high-performance electric bus batteries while establishing a local manufacturing presence. Manufacturers must focus on improving energy density, extending battery life, and reducing charging times while maintaining competitive pricing. Building strong relationships with electric bus manufacturers and transit agencies through customized solutions and reliable after-sales support is crucial. Companies need to invest in advanced manufacturing technologies and automation to improve production efficiency and maintain quality standards while reducing costs.
For new entrants and smaller players, focusing on specific market niches or innovative battery technologies could provide opportunities to gain market share. Developing expertise in specific applications, such as fast-charging solutions or extreme weather performance, could help differentiate offerings in a competitive market. Companies must also prepare for evolving regulations regarding battery recycling and sustainability, which could impact market dynamics. The ability to adapt to changing transit agency requirements and maintain strong relationships with key stakeholders will be crucial for long-term success. Additionally, companies need to maintain flexible manufacturing capabilities to accommodate rapid technological changes and evolving customer preferences.
US Electric Bus Battery Pack Industry Leaders
BYD Company Ltd.
Contemporary Amperex Technology Co. Ltd. (CATL)
LG Energy Solution Ltd.
Proterra Operating Company Inc.
SK Innovation Co. Ltd.
- *Disclaimer: Major Players sorted in no particular order


Recent Industry Developments
- January 2023: Samsung SDI is considering setting up another joint venture with a U.S. carmaker to expand its presence in the rapidly growing North American electric vehicle market.
- January 2023: Omega Seiki Mobility and iM3NY have formed a joint venture to bring US battery cell technology to India.
- January 2023: Proterra Powered EV battery was manufactured at the company's new Powered 1 battery production factory in Greer, South Carolina, marking the first one produced at the factory.


US Electric Bus Battery Pack Market Report Scope
BEV, PHEV are covered as segments by Propulsion Type. LFP, NCA, NCM, NMC, Others are covered as segments by Battery Chemistry. 15 kWh to 40 kWh, 40 kWh to 80 kWh, Above 80 kWh, Less than 15 kWh are covered as segments by Capacity. Cylindrical, Pouch, Prismatic are covered as segments by Battery Form. Laser, Wire are covered as segments by Method. Anode, Cathode, Electrolyte, Separator are covered as segments by Component. Cobalt, Lithium, Manganese, Natural Graphite, Nickel are covered as segments by Material Type.| BEV |
| PHEV |
| LFP |
| NCA |
| NCM |
| NMC |
| Others |
| 15 kWh to 40 kWh |
| 40 kWh to 80 kWh |
| Above 80 kWh |
| Less than 15 kWh |
| Cylindrical |
| Pouch |
| Prismatic |
| Laser |
| Wire |
| Anode |
| Cathode |
| Electrolyte |
| Separator |
| Cobalt |
| Lithium |
| Manganese |
| Natural Graphite |
| Nickel |
| Other Materials |
| Propulsion Type | BEV |
| PHEV | |
| Battery Chemistry | LFP |
| NCA | |
| NCM | |
| NMC | |
| Others | |
| Capacity | 15 kWh to 40 kWh |
| 40 kWh to 80 kWh | |
| Above 80 kWh | |
| Less than 15 kWh | |
| Battery Form | Cylindrical |
| Pouch | |
| Prismatic | |
| Method | Laser |
| Wire | |
| Component | Anode |
| Cathode | |
| Electrolyte | |
| Separator | |
| Material Type | Cobalt |
| Lithium | |
| Manganese | |
| Natural Graphite | |
| Nickel | |
| Other Materials |


Market Definition
- Battery Chemistry - Various types of battery chemistry considred under this segment include LFP, NCA, NCM, NMC, Others.
- Battery Form - The types of battery forms offered under this segment include Cylindrical, Pouch and Prismatic.
- Body Type - Body types considered under this segment include is variety of buses.
- Capacity - Various types of battery capacities inldude under theis segment are 15 kWH to 40 kWH, 40 kWh to 80 kWh, Above 80 kWh and Less than 15 kWh.
- Component - Various components covered under this segment include anode, cathode, electrolyte, separator.
- Material Type - Various material covered under this segment include cobalt, lithium, manganese, natural graphite, nickel, other material.
- Method - The types of method covered under this segment include laser and wire.
- Propulsion Type - Propulsion types considered under this segment include BEV (Battery electric vehicles), PHEV (plug-in hybrid electric vehicle).
- ToC Type - ToC 3
- Vehicle Type - Vehicle type considered under this segment include commercial vehicles with various EV powertrains.
| Keyword | Definition |
|---|---|
| Electric vehicle (EV) | A vehicle which uses one or more electric motors for propulsion. Includes cars, buses, and trucks. This term includes all-electric vehicles or battery electric vehicles and plug-in hybrid electric vehicles. |
| PEV | A plug-in electric vehicle is an electric vehicle that can be externally charged and generally includes all electric vehicles as well as plug-electric vehicles as well as plug-in hybrids. |
| Battery-as-a-Service | A business model in which the battery of an EV can be rented from a service provider or swapped with another battery when it runs out of charge |
| Battery Cell | The basic unit of an electric vehicle's battery pack, typically a lithium-ion cell, that stores electrical energy. |
| Module | A subsection of an EV battery pack, consisting of several cells grouped together, often used to facilitate manufacturing and maintenance. |
| Battery Management System (BMS) | An electronic system that manages a rechargeable battery by protecting the battery from operating outside its safe operating area, monitoring its state, calculating secondary data, reporting data, controlling its environment, and balancing it. |
| Energy Density | A measure of how much energy a battery cell can store in a given volume, usually expressed in watt-hours per liter (Wh/L). |
| Power Density | The rate at which energy can be delivered by the battery, often measured in watts per kilogram (W/kg). |
| Cycle Life | The number of complete charge-discharge cycles a battery can perform before its capacity falls under a specified percentage of its original capacity. |
| State of Charge (SOC) | A measurement, expressed as a percentage, that represents the current level of charge in a battery compared to its capacity. |
| State of Health (SOH) | An indicator of the overall condition of a battery, reflecting its current performance compared to when it was new. |
| Thermal Management System | A system designed to maintain optimal operating temperatures for an EV's battery pack, often using cooling or heating methods. |
| Fast Charging | A method of charging an EV battery at a much faster rate than standard charging, typically requiring specialized charging equipment. |
| Regenerative Braking | A system in electric and hybrid vehicles that recovers energy normally lost during braking and stores it in the battery. |


Research Methodology
Mordor Intelligence follows a four-step methodology in all its reports.
- Step-1: Identify Key Variables: To build a robust forecasting methodology, the variables and factors identified in Step-1 are tested against available historical market numbers. Through an iterative process, the variables required for market forecast are set and the model is built based on these variables.
- Step-2: Build a Market Model: Market-size estimations for the historical and forecast years have been provided in revenue and volume terms. Market revenue is calculated by multiplying the volume demand with volume-weighted average battery pack price (per kWh). Battery pack price estimation and forecast takes into account various factors affecting ASP, such as inflation rates, market demand shifts, production costs, technological developments, and consumer preferences, providing estimations for both historical data and future trends.
- Step-3: Validate and Finalize: In this important step, all market numbers, variables, and analyst calls are validated through an extensive network of primary research experts from the market studied. The respondents are selected across levels and functions to generate a holistic picture of the market studied.
- Step-4: Research Outputs: Syndicated Reports, Custom Consulting Assignments, Databases & Subscription Platforms


