Market Overview
| Study Period | 2019 - 2031 |
|---|---|
| Forecast Data Period | 2026 - 2031 |
| Historical Data Period | 2019 - 2024 |
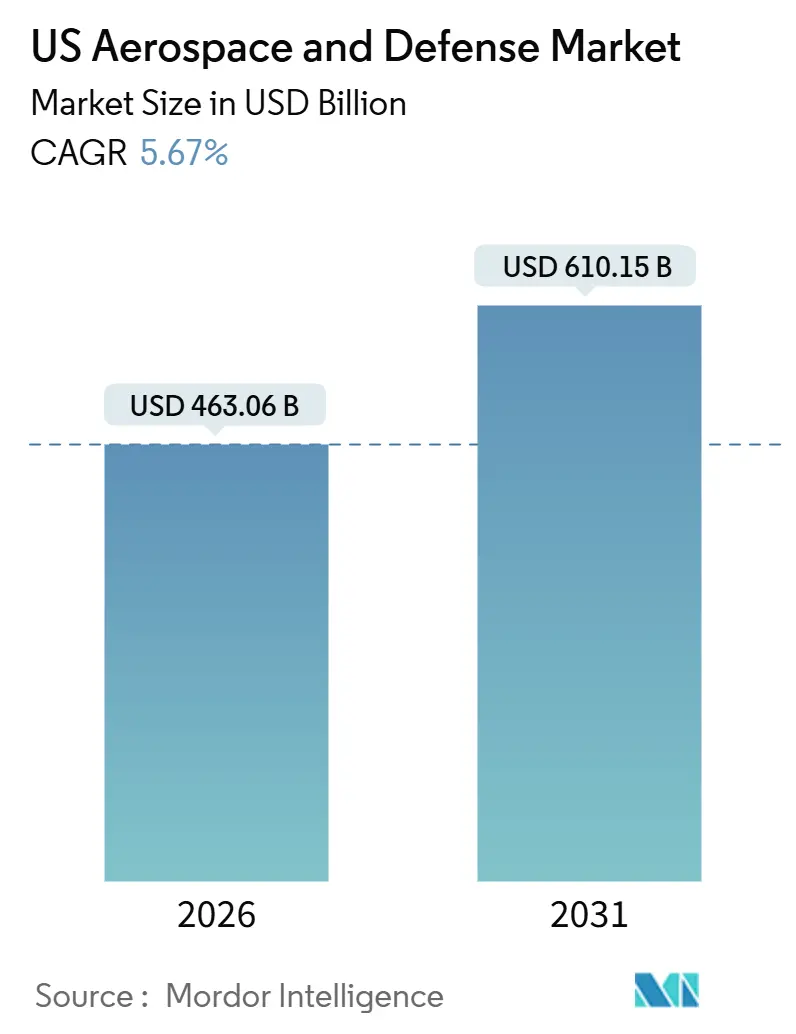
| Market Size (2026) | USD 463.06 Billion |
| Market Size (2031) | USD 610.15 Billion |
| Growth Rate (2026 - 2031) | 5.67% CAGR |
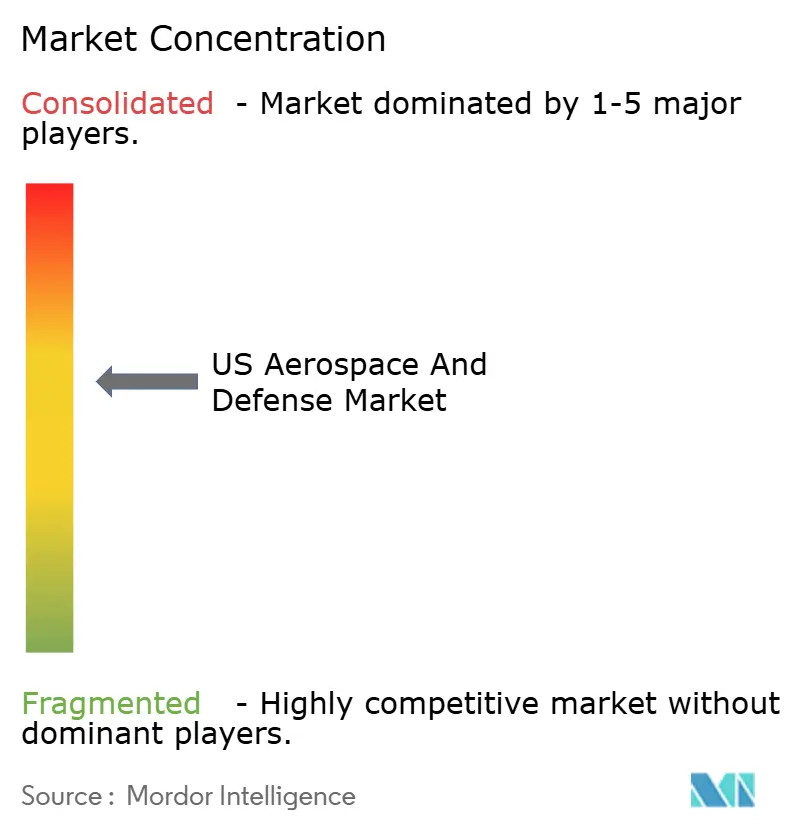
| Market Concentration | Medium |
Major Players *Disclaimer: Major Players sorted in no particular order Image © Mordor Intelligence. Reuse requires attribution under CC BY 4.0. | |
US Aerospace And Defense Market Analysis by Mordor Intelligence
The US aerospace and defense market size is USD 463.06 billion in 2026 and, at a forecast CAGR of 5.67%, is projected to reach USD 610.15 billion by 2031. Robust federal outlays, commercial aviation fleet renewal, and proliferating satellite constellations are converging to sustain this growth. Defense funding remains the revenue anchor, yet commercial aerospace is regaining momentum as narrow-body order backlogs normalize and launch economics improve. Suppliers are benefiting from Defense Production Act incentives that encourage domestic sourcing of titanium, rare-earth magnets, and semiconductor substrates, though these measures are inflating near-term unit costs. Competitive dynamics are shifting as venture-backed entrants target autonomous systems and niche commercial spaces, forcing incumbents to accelerate software-centric upgrades. Environmental and cybersecurity mandates are simultaneously raising compliance overhead, creating both headwinds and high-barrier market opportunities.
Key Report Takeaways
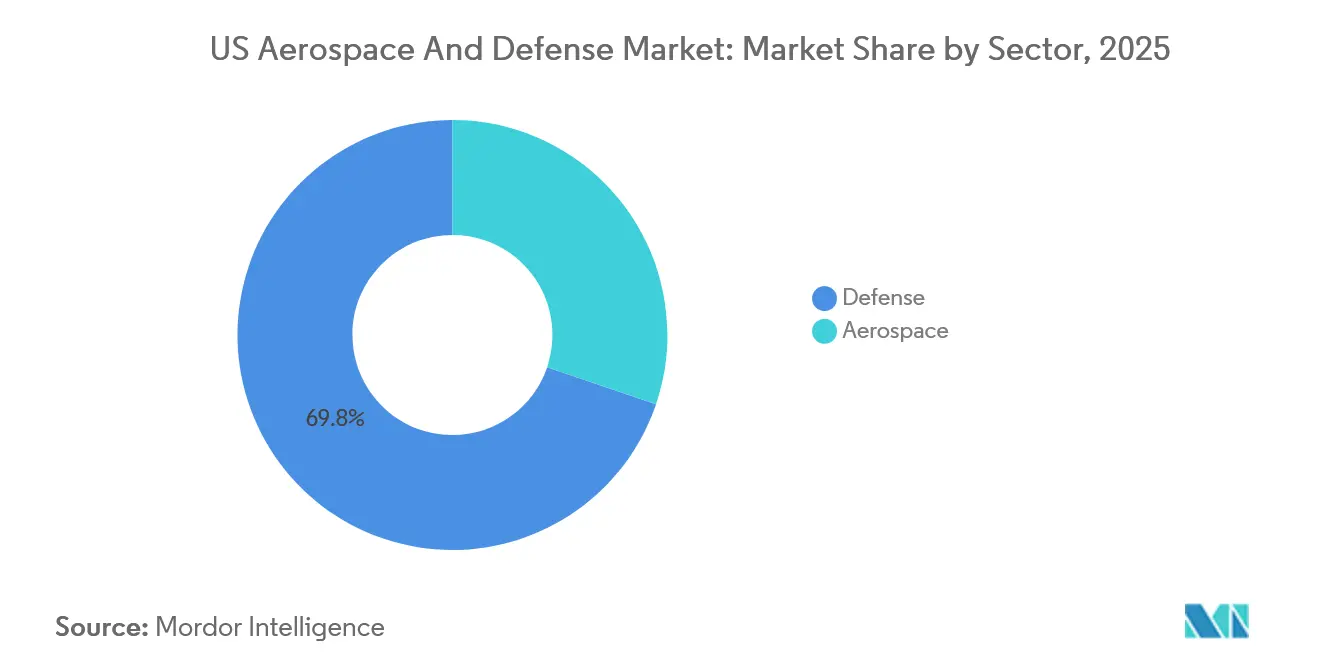
- By sector, defense held 69.78% of the US aerospace and defense market share in 2025; the aerospace sector is expected to expand at a 5.82% CAGR through 2031.
- By platform, space platforms posted the fastest 7.12% CAGR, while aerial platforms commanded 31.25% revenue share of the US aerospace and defense market size in 2025.
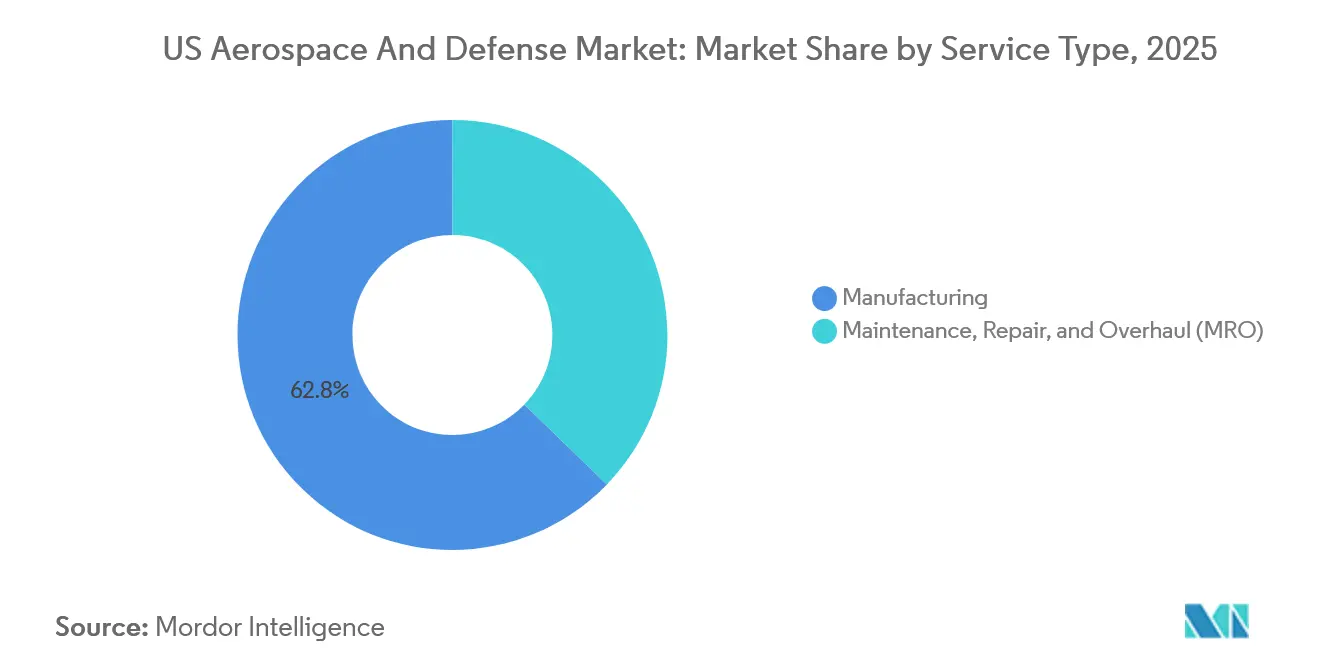
- By service type, manufacturing services led with a 62.76% revenue share in 2025; maintenance, repair, and overhaul is forecasted to grow at a 5.92% CAGR to 2031.
- By component, airframes and structures accounted for 41.98% of the US aerospace and defense market size in 2025, whereas composite and carbon fiber components are advancing at a 6.86% CAGR.
Note: Market size and forecast figures in this report are generated using Mordor Intelligence’s proprietary estimation framework, updated with the latest available data and insights as of January 2026.
US Aerospace And Defense Market Trends and Insights
Drivers Impact Analysis*
| Driver | (~) % Impact on CAGR Forecast | Geographic Relevance | Impact Timeline |
|---|---|---|---|
| Surging DoD procurement and RDT&E budgets | +1.80% | National, concentrated in key defense hubs | Long term (≥ 4 years) |
| Commercial and general-aviation fleet renewal | +1.20% | National, spillover to global supply chains | Medium term (2–4 years) |
| Rapid growth in commercial launch and LEO sats | +1.00% | National, export to allied markets | Long term (≥ 4 years) |
| Supply-chain reshoring incentives | +0.60% | Midwest and Southeast manufacturing clusters | Medium term (2–4 years) |
| AI-enabled digital MRO twins | +0.50% | Nationwide, early adoption by major carriers | Short term (≤ 2 years) |
| Demand for attritable autonomous aircraft | +0.40% | DoD-led, allied co-development | Medium term (2–4 years) |
| Source: Mordor Intelligence | |||


Surging DoD Procurement And RDT&E Budgets
Fiscal-year 2024 legislation appropriated USD 849.8 billion for national defense, raising RDT&E to a record USD 145 billion.[1]Department of Defense, “Fiscal Year 2024 Defense Budget,” defense.gov These funds are propelling programs such as the B-21 Raider, Columbia-class submarines, and the Replicator autonomous systems initiative. Multi-year procurement contracts are insulating prime contractors from demand shocks, while higher technology readiness levels are accelerating the transition of hypersonic, electronic-warfare, and counter-UAS prototypes into production. The surge is also heightening cybersecurity requirements; companies that have secured Cybersecurity Maturity Model Certification Level 3 are winning sole-source classified awards, reinforcing competitive moats. Although compliance adds 5-8% to program costs, the visibility of a long-term budget topline continues to attract commercial suppliers into defense work.
Commercial and General-Aviation Fleet-Modernization Cycles
The Boeing and Airbus backlogs stood at 14,773 jets at the end of 2025, with narrow-body models representing over 80% of the orders.[2]Mark Johnson, “Boeing, Airbus Backlogs Hit 14,000 Aircraft,” Financial Times, ft.com Delivery rates are normalizing as supply-chain bottlenecks ease; combined hand-overs are targeted at 1,400 aircraft in 2026. The US fleet averaged 14.2 years in 2025, stimulating retirements of older 757s and 737NGs and lifting demand for engines, avionics, and cabin retrofits. General-aviation deliveries are improving in tandem, supported by FAA certification of synthetic vision cockpits that reduce pilot workload. Sustainable aviation fuel mandates are adding 15% to fuel bills but are encouraging the purchase of more efficient models, thereby reinforcing the replacement cycle.
Rapid Growth in Commercial Launch and Satellite Constellations
SpaceX executed 136 Falcon 9 launches in 2024, placing 2,400 Starlink satellites into orbit and capturing 85% of the global launch mass, while in 2025, it recorded 167 launches, placing close to 2,700 Starlink satellites in orbit. Starship’s forthcoming heavy-lift capacity and Blue Origin’s New Glenn, which was expected to enter service in 2025, are reducing per-kilogram prices, thereby broadening access for both defense and commercial payloads. Rocket Lab’s vertically integrated Neutron vehicle is designed for medium-lift missions that Falcon rideshares currently under-serve. Constellations are diversifying beyond broadband to include Earth observation, tactical data relay, and resilient mesh architectures for missile warning. These dynamics underpin the 7.12% CAGR of the space segment.
Supply-Chain Reshoring Incentives and DPA Funding
Since 2023, USD 1.2 billion in Defense Production Act Title III awards have flowed to domestic producers of titanium, rare-earth magnets, and wide-bandgap semiconductors.[3]Federal Register, “Defense Production Act Title III Awards,” federalregister.gov Arconic, MP Materials, and Wolfspeed are expanding US capacity, mitigating geopolitical risk at the expense of 6-10% higher near-term costs. Spirit AeroSystems repatriated composite wing fabrication for the 737 MAX to Wichita in 2025, citing concerns over quality control. CHIPS Act subsidies are further catalyzing the development of aerospace-grade semiconductor fabs in New York and Texas. The reshoring wave is re-balancing supplier footprints toward the Midwest and Southeast manufacturing corridors.
Restraints Impact Analysis*
| Restraint | (~) % Impact on CAGR Forecast | Geographic Relevance | Impact Timeline |
|---|---|---|---|
| Chronic supply-chain bottlenecks and skilled-labor gaps | -0.90% | Midwest and Southeast manufacturing hubs | Medium term (2–4 years) |
| Tightening export-control and cybersecurity compliance costs | -0.5% | National, affecting FMS-heavy contractors | Long term (≥ 4 years) |
| Escalating environmental mandates and remediation expenses | -0.4% | National, higher in states with stringent eco-regulations | Medium term (2–4 years) |
| Launch-services overcapacity driving price compression | -0.3% | National, centered on commercial-space launch corridors | Short term (≤ 2 years) |
| Source: Mordor Intelligence | |||
Chronic Aerospace Supply-Chain Bottlenecks and Skilled-Labor Shortages
Spirit AeroSystems operated at 70% of its planned fuselage output in 2024 due to shortages of fasteners, hydraulic fittings, and prepreg. Bureau of Labor Statistics data indicate that there will be 35,000 unfilled machinist and composite-technician roles by 2028, resulting in a 15% workforce gap. Titanium sponge prices jumped 22% in 2024 after Russian export restrictions, and lead times for aluminum extrusions stretched to 52 weeks. Apprenticeship programs initiated by Boeing and Lockheed Martin will not yield journey-level staff until late in the decade, prolonging existing constraints. Resulting schedule slips have pushed initial operating capability for platforms such as the F-15EX and CH-53K by up to 12 months.
Tightening Export-Control and Cybersecurity Compliance Costs
2024 ITAR amendments now require annual on-site audits of foreign end-users and fully auditable supply-chain records.[4]Department of Commerce, “ITAR End-Use Monitoring Amendments,” federalregister.gov RTX spent USD 180 million on export compliance in 2024, up 14% year over year. Achieving CMMC Level 3 certification costs mid-tier suppliers USD 2-5 million, prompting some to exit defense work altogether. The Bureau of Industry and Security’s October 2024 rule limiting high-performance semiconductor exports is curtailing potential foreign sales for C4ISR integrators. These factors increase fixed costs and reinforce domestic-market dependency, constraining top-line growth opportunities abroad.
*Our forecasts treat driver/restraint impacts as directional, not additive. The impact forecasts reflect baseline growth, mix effects, and variable interactions.
Segment Analysis
By Sector: Defense Funding Anchors Growth While Commercial Recovery Accelerates
Defense revenues accounted for 69.78% of the US aerospace and defense market in 2025, supported by committed outlays for the B-21 Raider, Columbia-class submarine, and Next-Generation Air Dominance programs. Stable, multi-year contracts shield prime contractors from cyclical shocks and provide visibility into long-term cash flows. Land-system upgrades, such as the Army’s Optionally Manned Fighting Vehicle, and naval programs, including Virginia-class submarine block buys, further anchor growth. Regulatory pressure via cybersecurity mandates is raising barriers to entry, limiting foreign competition yet intensifying compliance costs for domestic suppliers.
Aerospace, covering civil and military aviation, is posting a 5.82% CAGR to 2031, outpacing Defense’s 5.54%. Narrow-body backlogs, led by the 737 MAX and A320neo, underpin production ramps toward 50 and 65 units per month by 2026. Military aviation benefits from fighter recapitalization, with the Air Force buying 80 F-35As annually and B-21 entering low-rate production. While Defense retains the lion’s share of revenue, commercial jetliner deliveries and general aviation modernization are expanding the overall US aerospace and defense market size at a steady pace.


By Platform: Space Leads While Aerial Assets Dominate Revenue
Space platforms posted the highest 7.12% CAGR, propelled by proliferated low-Earth-orbit constellations and heavy-lift launch vehicles. The Space Development Agency’s 300-satellite tranche and commercial broadband networks such as Starlink and Kuiper validate mesh-network economics. Aerial platforms still account for 31.25% of the US aerospace and defense market size, driven by narrow-body deliveries and fighter procurement. Unmanned aerial systems are expanding at a rate of 6.2%, while rotary-wing programs, such as the V-280 Valor, reinforce helicopter demand.
Fixed-wing production remains the revenue backbone of aerial platforms, yet the shift to attritable drones signals a future transformation in the mix. Terrestrial and naval platforms continue to grow at a rate of 5-6% on the back of armored-vehicle modernization and surface-combatant construction, but neither category matches the momentum seen in space.
By Service Type: Manufacturing Dominates but MRO Gains Ground
Manufacturing services contributed 62.76% of 2025 revenues, reflecting the capital-intensive nature of airframe and propulsion production lines. The nine-year aircraft backlog of 5,600 units at Boeing underscores the durability of this revenue base. Maintenance, repair, and overhaul, however, is advancing at a 5.92% CAGR as fleets age. The average age of commercial aircraft surpassed 14 years in 2025, catalyzing heavy maintenance visits and the adoption of digital twins. Air Force depot budgets reached USD 18 billion in 2024, sustaining the workload for both public and private depots.
Digital-maintenance platforms are shifting revenue models toward predictive analytics subscriptions, rewarding technology-enabled providers. This evolution embeds recurring software revenue within the service mix, complementing traditional labor-intensive overhaul work.
By Component: Composite Materials See Fastest Upside
Airframes and Structures delivered 41.98% of 2025 component revenue amid high barriers to entry and locked-in supply agreements. Propulsion systems are expected to follow at 28%, supported by 1,650 LEAP and 950 GTF engine deliveries in 2024. Electronics and mission systems captured 18% of the market and are growing at a rate of 5.5%, as AESA radars and electronic-warfare pods proliferate. Composite materials are advancing at a 6.86% CAGR on the back of weight-reduction mandates; the 787 is 50% composite by mass, setting a benchmark for future narrow-bodies.
Investment flows are materializing accordingly. Hexcel’s USD 250 million Utah prepreg plant and Toray’s South Carolina expansion underline the race to secure carbon-fiber supply. Additive manufacturing is also being applied to structural components, prompting the FAA and DoD to develop new qualification protocols.
Geography Analysis
The US aerospace and defense market is inherently national, yet regional clustering is pronounced. The Pacific Coast is home to commercial-jet final assembly, classified airframe design, and legacy space manufacturing. Southern California and Washington employ over 180,000 aerospace workers, anchored by Boeing’s Renton and Everett lines and Lockheed Martin’s Skunk Works. The Southeast corridor has evolved into a growth pole; Airbus’s Mobile line delivered 63 A320-family jets in 2024, and Blue Origin’s Huntsville factory is ramping up BE-4 engine output.
Texas hosts vertically integrated space and fighter-aircraft hubs. SpaceX’s Starbase executed five Starship test flights in 2024, while Lockheed Martin’s Fort Worth plant turns out 156 F-35s annually. The Midwest remains pivotal for propulsion and aerostructures, with GE Aerospace’s Evendale turbines and Spirit AeroSystems’ Wichita fuselages. New England anchors submarine and heavy-lift helicopter production; Electric Boat’s Columbia-class hulls and Sikorsky’s CH-53K lines dominate local employment.
Federal and state incentives shape capital allocation. CHIPS Act subsidies are financing semiconductor fabs in New York and Texas, while Alabama and South Carolina are deploying tax abatements and workforce grants to secure engine and airframe projects. Environmental regulations vary by region: California’s Low-Carbon Fuel Standard accelerates sustainable-fuel uptake, whereas EPA PFAS rules impose cleanup obligations at legacy Connecticut and Ohio sites.
Competitive Landscape
The top five prime contractors represent a significant share of the total contract value, with the remaining portion distributed among over 1,200 tier-one suppliers and numerous lower-tier firms. Incumbents retain dominance in classified fighters, bombers, and submarines, yet venture-backed challengers are scaling quickly in commercial space and autonomous systems. SpaceX’s full-stack vertical integration and Lockheed Martin’s 2025 acquisition of Terran Orbital illustrate divergent strategies to secure satellite supply chains.
Software differentiation is reshaping competitiveness. Palantir secured a USD 480 million Army contract for AI-enabled command and control, and Kratos undercuts traditional unmanned-system suppliers by 40% through open-architecture designs. Cybersecurity compliance serves as both a barrier and a moat; firms achieving CMMC Level 3 win sole-source awards, while smaller suppliers, unable to justify the compliance costs, exit or consolidate.
White-space opportunities lie in hybrid-electric regional aircraft, on-orbit servicing, directed-energy weapons, and counter-hypersonic systems. Venture capital is flowing faster than traditional defense R&D budgets into these niches, pressuring incumbents to partner or acquire. As a result, competitive intensity is bifurcating between mature, capital-heavy programs and agile, software-defined segments.
US Aerospace And Defense Industry Leaders
Lockheed Martin Corporation
The Boeing Company
RTX Corporation
Space Exploration Technologies Corp. (SpaceX)
Northrop Grumman Corporation
- *Disclaimer: Major Players sorted in no particular order

Recent Industry Developments
- December 2025: The US Air Force awarded Boeing the Engineering and Manufacturing Development (EMD) contract for the sixth-generation F-47 NGAD fighter. This aircraft is intended to replace the F-22 and function as the primary air-superiority component within the Next Generation Air Dominance (NGAD) system of systems.
- September 2025: The US Navy awarded contracts to General Atomics, Boeing, Anduril, and Northrop Grumman for the development of armed, unmanned collaborative combat aircraft (CCA) designed for carrier operations. Additionally, Lockheed Martin has been chosen to develop the standard control system.


US Aerospace And Defense Market Report Scope
This report analyzes the United States of America aerospace and defense market, with a focus on federal defense budgets, procurement and acquisition policies, export control frameworks, and the industrial and technological capabilities of key market participants. It evaluates the influence of the US Department of Defense (DoD), allied programs, and commercial aerospace demand on market dynamics. The study provides a comprehensive examination of historical trends, current market conditions, and future growth prospects for the US defense and aerospace sectors. Data-driven insights are included to identify strategic opportunities, modernization priorities, and competitive positioning within the US Aerospace and Defense ecosystem.
The US aerospace and defense market is segmented by sector (aerospace and defense), platform (airborne, terrestrial, and naval), service type (manufacturing and maintenance, repair, and overhaul [MRO]), and component (airframes and structures, propulsion systems and engines, electronics and mission systems, composite and carbon fibre components, electronic warfare [EW] and sensors). Market size and forecasts for each segment are presented in value terms (USD), allowing for a detailed analysis of demand patterns, investment trends, and long-term capability development in the United States aerospace and defense industry.
By Sector
| Aerospace | Civil Aerospace |
| Military Aerospace | |
| Defense | Land Systems |
| Naval Systems | |
| Air Combat Systems |
By Platform
| Aerial | Fixed Wing Aircraft |
| Rotary Wing Aircraft | |
| Unmanned Aerial Systems | |
| Terrestrial | Armored Vehicles |
| Artillery and Missile Systems | |
| Soldier Systems and Electronics | |
| Naval | Surface Combatants |
| Submarines | |
| Naval Aviation | |
| Space | Navigation Satellites |
| Earth Observation/Remote Sensing Satellites | |
| Scientific Research/Astronomical Satellites | |
| Communication Satellites |
By Service Type
| Manufacturing |
| Maintenance, Repair, and Overhaul (MRO) |
By Component
| Airframes and Structures |
| Propulsion Systems and Engines |
| Electronics and Mission Systems |
| Composite and Carbon Fibre Components |
| Electronic Warfare (EW) and Sensors |
| By Sector | Aerospace | Civil Aerospace |
| Military Aerospace | ||
| Defense | Land Systems | |
| Naval Systems | ||
| Air Combat Systems | ||
| By Platform | Aerial | Fixed Wing Aircraft |
| Rotary Wing Aircraft | ||
| Unmanned Aerial Systems | ||
| Terrestrial | Armored Vehicles | |
| Artillery and Missile Systems | ||
| Soldier Systems and Electronics | ||
| Naval | Surface Combatants | |
| Submarines | ||
| Naval Aviation | ||
| Space | Navigation Satellites | |
| Earth Observation/Remote Sensing Satellites | ||
| Scientific Research/Astronomical Satellites | ||
| Communication Satellites | ||
| By Service Type | Manufacturing | |
| Maintenance, Repair, and Overhaul (MRO) | ||
| By Component | Airframes and Structures | |
| Propulsion Systems and Engines | ||
| Electronics and Mission Systems | ||
| Composite and Carbon Fibre Components | ||
| Electronic Warfare (EW) and Sensors | ||


Key Questions Answered in the Report
How large will US aerospace and defense revenue be by 2031?
The market is projected to reach USD 610.15 billion by 2031, rising from USD 463.06 billion in 2026 at a 5.67% CAGR.
Which segment is growing fastest within US aerospace and defense?
Space platforms lead with a 7.12% CAGR thanks to proliferated low-Earth-orbit constellations and cheaper launch prices.
What share do the top five primes hold?
Lockheed Martin Corporation, RTX Corporation, The Boeing Company, Space Exploration Technologies Corp. (SpaceX), and Northrop Grumman Corporation together captured a major share of prime-contract awards in 2024.
Why is MRO spending rising?
The average US commercial fleet age climbed past 14 years in 2025, increasing heavy-maintenance visits and engine overhauls and driving a 5.92% CAGR in MRO revenue.
How are supply-chain risks being mitigated?
Defense Production Act Title III funding and CHIPS Act subsidies are financing domestic capacity for titanium, magnets and aerospace-grade semiconductors, reducing reliance on foreign suppliers at the cost of higher unit prices.
What opportunities exist for new entrants?
White-space areas such as hybrid-electric regional aircraft, directed-energy integration and on-orbit servicing offer growth paths, especially for firms with software and vertical-integration strengths.
Page last updated on:


