Uranium Enrichment Market Size and Share
Market Overview
| Study Period | 2020 - 2030 |
|---|---|
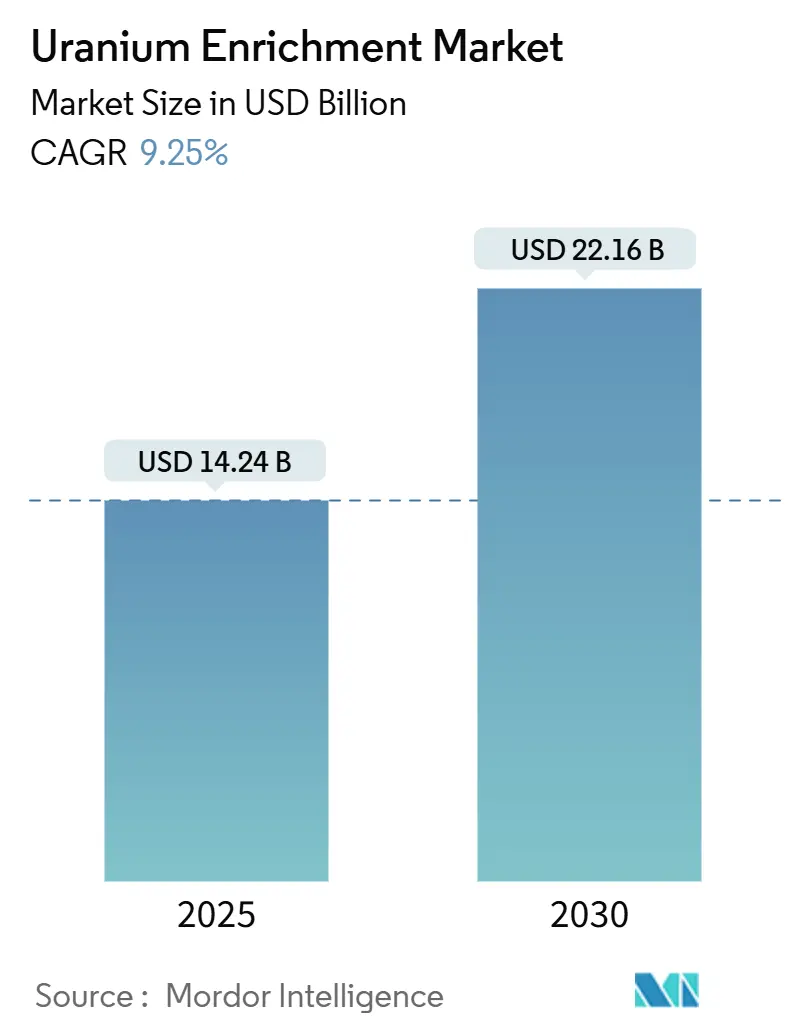
| Market Size (2025) | USD 14.24 Billion |
| Market Size (2030) | USD 22.16 Billion |
| Growth Rate (2025 - 2030) | 9.25% CAGR |
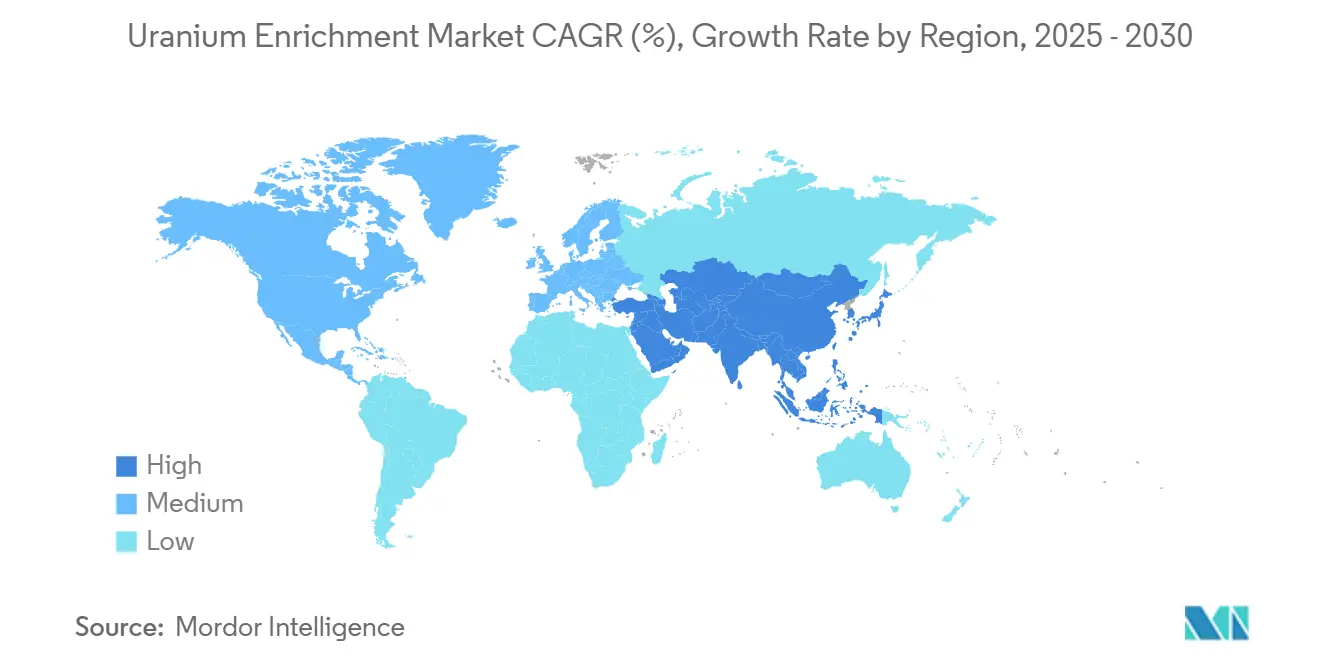
| Fastest Growing Market | Asia Pacific |
| Largest Market | Asia Pacific |
| Market Concentration | High |
Major Players *Disclaimer: Major Players sorted in no particular order Image © Mordor Intelligence. Reuse requires attribution under CC BY 4.0. | |
Uranium Enrichment Market Analysis by Mordor Intelligence
The Uranium Enrichment Market size is estimated at USD 14.24 billion in 2025, and is expected to reach USD 22.16 billion by 2030, at a CAGR of 9.25% during the forecast period (2025-2030).
Rising demand for high-assay low-enriched uranium (HALEU) that contains 5-20% U-235, swift build-out of small modular reactors (SMRs), and government-funded capacity additions underpin this growth trajectory. Geopolitical realignment away from Russian enrichment services, which covered 27% of the United States' needs in 2024, is steering USD 4.2 billion of Western investment into alternative supply chains. Asia-Pacific led the market, propelled by China’s 56 operating reactors and Japan’s restart program. State-owned enterprises in Russia and China controlled 62% of global capacity in 2024, creating concentration risk that now drives Western capacity expansion.
Key Report Takeaways
- By enrichment method, gas centrifuge held 58.9% of the uranium enrichment market share in 2024, while laser isotope separation is projected to expand at 11.2% CAGR through 2030.
- By uranium type, Low-Enriched Uranium (LEU) accounted for 88.1% of the uranium enrichment market size in 2024, and High-Assay Low-Enriched Uranium (HALEU) is set to record a 12.3% CAGR during 2025-2030.
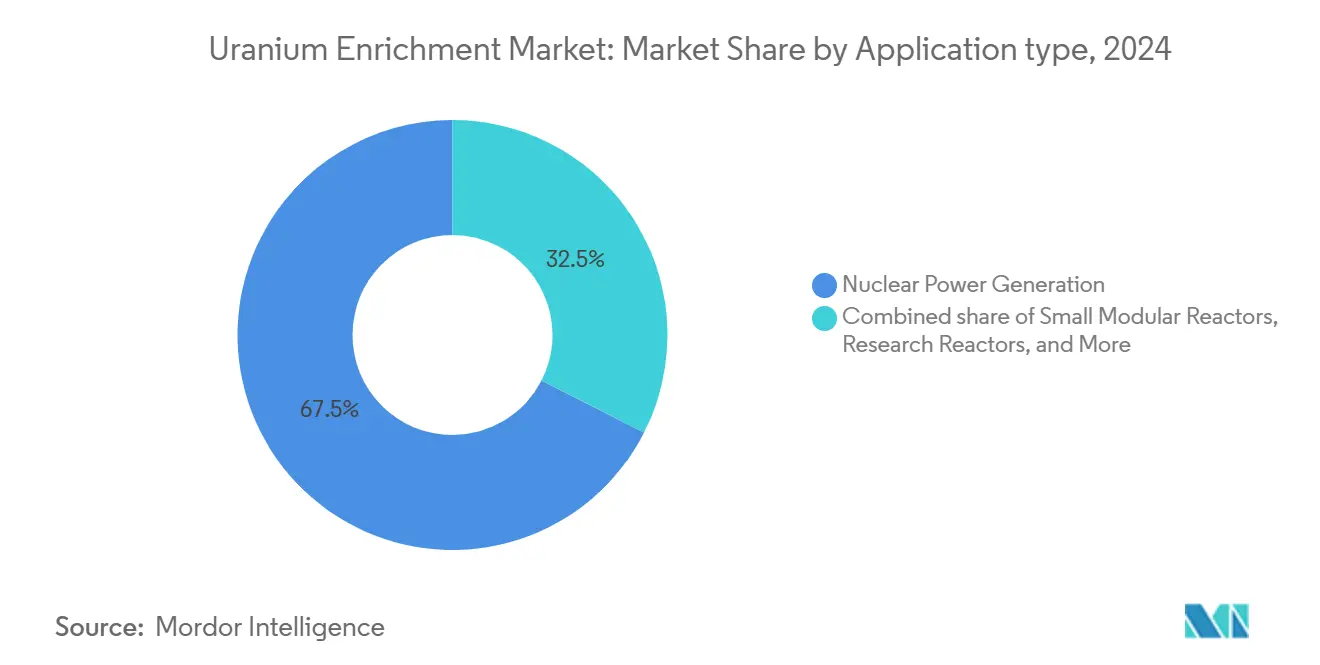
- By application, nuclear power generation commandeda 67.5% share of the uranium enrichment market size in 2024, whereas Small Modular Reactors (SMRs) are advancing at an 11.8% CAGR to 2030.
- By end-user, utilities and nuclear power plants captured a 60.4% share in 2024, while private SMR developers are forecast to post the highest CAGR of 12.6% through 2030.
- By geography, Asia-Pacific led with 33.7% uranium enrichment market share in 2024 and is projected to sustain a 9.9% CAGR between 2025-2030.
Global Uranium Enrichment Market Trends and Insights
Drivers Impact Analysis*
| Driver | (~) % Impact on CAGR Forecast | Geographic Relevance | Impact Timeline |
|---|---|---|---|
| Accelerated SMR build-outs post-2030 | +1.80% | Global, early focus on North America & Europe | Long term (≥ 4 years) |
| Surge in HALEU demand for advanced reactors | +2.10% | US, UK, EU | Medium term (2-4 years) |
| Government-backed enrichment capacity expansion | +1.60% | North America, Europe, Asia-Pacific | Medium term (2-4 years) |
| Re-entry of Japan’s nuclear fleet | +0.90% | Asia-Pacific | Short term (≤ 2 years) |
| Defense-sector demand for naval propulsion fuel | +0.70% | US, UK, France, India | Long term (≥ 4 years) |
| Uranium supply diversification away from Russia | +1.40% | Global except Russia | Short term (≤ 2 years) |
| Source: Mordor Intelligence | |||
Accelerated SMR Build-outs Post-2030
SMR deployment is reshaping the uranium enrichment market. The United States Department of Energy (DOE) projects cumulative HALEU demand exceeding 40 metric tons by 2030 and climbing toward 600 metric tons annually thereafter.(1)Source: U.S. Department of Energy, “Projected HALEU Requirements for Advanced Reactors,” energy.govSMRs typically operate on 15-20% U-235 fuel, which only Russia and China supply at a commercial scale today. Western firms are investing heavily to bridge this gap; for instance, Urenco is spending GBP 196 million on its Capenhurst HALEU line that targets 10 tonnes annual output by 2031. Higher enrichment levels can extend core life, trimming fuel costs for a 12-module SMR by roughly USD 5.84 million annually. Technology vendors like ASP Isotopes are testing quantum enrichment methods to address a projected 3,000 metric-ton HALEU shortfall by 2035.
Surge in HALEU Demand for Advanced Reactors
Advanced reactor designers are converging on HALEU, creating immediate supply urgency. The International Atomic Energy Agency lists about 40 SMR designs in active development, heightening proliferation scrutiny as enrichment edges closer to weapons-grade thresholds. Centrus Energy produced 900 kg of HALEU in 2024 for DOE, while Washington committed USD 2.7 billion to accelerate domestic supply. Orano plans enrichment above 6% after 2025, contingent on customer commitments, and EU research reactors alone will need up to 1 ton yearly HALEU by 2035.(2)Source: Orano, “Strategic Enrichment Roadmap,” orano.group
Government-backed Enrichment Capacity Expansion (US, EU, India)
Security concerns outweigh pure economics as Western governments fund parallel supply chains. DOE awarded six suppliers USD 3.4 billion of long-term LEU contracts, ensuring baseline demand for new facilities. Urenco is adding 15% capacity in the Netherlands, Germany, and New Mexico, totaling over 1.45 million separative work units (SWU) annually. India is doubling enrichment output at Mysore and building an additional plant in Karnataka to serve civil and strategic programs. Subsidies, purchase agreements, and regulatory support cushion higher domestic costs and narrow the price gap with lower-cost Russian output.
Re-entry of Japan’s Nuclear Fleet
Japan’s 20% nuclear electricity target by 2040 re-opens a large enrichment market after a decade of stagnation. Fourteen reactors produced 93.48 TWh in fiscal 2024, while new rules oblige reactors older than 30 years to file long-term plans every decade. Tokyo has joined a five-nation consortium earmarking USD 4.2 billion for diversified uranium supply, signaling alignment with Western enrichment initiatives. Domestic enrichment upgrades slated for completion in 2027 will boost self-sufficiency and underpin restart schedules. Korea Hydro & Nuclear Power’s 10-year LEU procurement from Centrus marks broader Asian interest in North American supply.
Restraints Impact Analysis*
| Restraint | (~) % Impact on CAGR Forecast | Geographic Relevance | Impact Timeline |
|---|---|---|---|
| Geopolitical sanctions disrupting supply chains | -1.20% | Global except Russia & China | Short term (≤ 2 years) |
| High CAPEX & long permitting timelines | -0.80% | North America, Europe | Long term (≥ 4 years) |
| Public opposition in key growth markets | -0.40% | Europe, select Asia-Pacific | Medium term (2-4 years) |
| Volatility in uranium spot prices | -0.60% | Global | Short term (≤ 2 years) |
| Source: Mordor Intelligence | |||
Geopolitical Sanctions Disrupting Supply Chains
Sanctions on Rosatom fracture established logistics. The US import ban removes a quarter of domestic enrichment services, while EU utilities spent EUR 700 million on Russian uranium in 2024, which now needs replacement.(3)Source: Bruegel, “EU Reliance on Russian Nuclear Fuel,” bruegel.org Prices have surged 506% since the Ukraine conflict began, and SWU contract rates climbed above USD 99. VVER reactors in Slovakia and Hungary still rely on Russian fuel assemblies, forcing expensive design modifications or sanction waivers, illustrating the uneven impact across reactor fleets. Western capacity gaps will take at least five years to plug, prolonging market tightness.
High CAPEX & Long Permitting Timelines
New enrichment plants exceed USD 1 billion and require multi-year Nuclear Regulatory Commission reviews. Global Laser Enrichment expects operations at Paducah no earlier than 2030. Even before fabrication begins, NexGen Energy’s Rook I capital cost rose to CAD 2.2 billion (USD 1.58 billion). Complex safety cases deter private capital unless backstopped by government contracts. Cost inflation in concrete, steel, and specialty alloys further strains budgets, making state participation almost mandatory.
*Our forecasts treat driver/restraint impacts as directional, not additive. The impact forecasts reflect baseline growth, mix effects, and variable interactions.
Segment Analysis
By Enrichment Method: Laser Disruption Gains Momentum
Gas centrifuge technology held 58.9% uranium enrichment market share in 2024, sustained by proven scalability and favorable energy efficiency. Urenco’s tri-continental plants collectively added 15% more capacity during 2024-2025, highlighting continued investment in upgraded centrifuge cascades. Laser isotope separation, however, is projected to deliver the highest 11.2% CAGR to 2030 as Global Laser Enrichment commercializes SILEX technology. The uranium enrichment market size for laser methods could reach multi-billion-dollar values by 2030 once the Paducah facility starts producing 5 million pounds U3O8 equivalent annually.
Second-generation gaseous diffusion is now marginal due to high power use, and plasma or chemical exchange concepts remain in pilot phases. Yet government security agendas align with laser’s smaller footprint and lower energy profile, making advanced methods a strategic hedge against Russian centrifuge dominance. Western utilities are already writing optional volumes into contracts, contingent on SILEX hitting technical milestones.


By Type of Uranium: HALEU Alters Fuel Economics
LEU retained 88.1% market share in 2024 as conventional light-water reactors continued routine refueling cycles. Nevertheless, HALEU is rising at a 12.3% CAGR and will pressure supply chains as SMR fleets expand. The uranium enrichment market size dedicated to HALEU could exceed USD 4 billion by 2030 if DOE forecasts for 600 metric tons of annual demand materialize.
Centrus’s 900 kg production in 2024 showcases initial capability, yet the United States alone will require roughly 15-fold that volume by 2028 to satisfy pilot SMR projects. European research reactors expect 700 kg annually by 2035, underscoring global adoption. HEU remains restricted to defense and select medical isotope reactors under tight safeguards. Heightened proliferation oversight for enrichments above 12% U-235 adds compliance costs and incentivizes domestic production within allied jurisdictions.
By Application: SMRs Reshape Demand Patterns
Nuclear power generation accounted for 67.5% of the uranium enrichment market size 2024, anchored by 440-plus operating reactors worldwide. SMRs are set to grow fastest at 11.8% CAGR, delegating more value to higher enrichment tiers and flexible contract structures. TerraPower’s Natrium and X-energy’s Xe-100 reactors require HALEU and have secured preliminary supply agreements with Centrus and Urenco.
Research reactors and medical isotope facilities exhibit modest but steady volume requirements with above-average enrichment levels. Naval propulsion demand is likewise stable yet premium-priced, providing counter-cyclical revenue when commercial orders dip. The convergence of power generation and process heat applications in advanced designs blurs segment lines, but fuel vendors are responding by offering bundled enrichment-to-fabrication contracts.
By End-user: Private Developers Accelerate Innovation
Utilities and nuclear power plants still absorbed 60.4% of enriched uranium demand in 2024, tied to multi-cycle refueling schedules. Yet private SMR developers are forecast to post the swiftest 12.6% CAGR to 2030, reflecting new financing models that bypass traditional rate-based structures. X-Energy, NuScale, and Terrestrial Energy all negotiate long-term enrichment packages years before first-of-a-kind reactor deployment, providing suppliers early revenue visibility.
Fuel fabricators push upstream integration to secure HALEU, while defense ministries lock in multiyear volumes. Research institutions, helped by government grants, broaden isotope and materials testing programs, offering niche opportunities for high-enrichment services.
Geography Analysis
Asia-Pacific held 33.7% uranium enrichment market share in 2024, thanks to China’s 242.2 TWh nuclear output and 29-unit construction queue, reinforcing regional demand for both LEU and future HALEU. The region’s 9.9% CAGR outlook reflects Chinese capacity additions, Japanese restarts, and India’s enrichment doubling initiative at Mysore and Karnataka sites. South Korea’s fleet now operates above 80% capacity, and emerging players like Indonesia and the Philippines are evaluating SMRs.
North America is the fastest-growing region as Washington sets aside USD 3.4 billion for domestic LEU procurement and funds multiple HALEU demonstration contracts. Urenco USA’s 15% capacity lift adds 700,000 SWU annually, and Global Laser Enrichment’s Paducah project aims to commercialize laser enrichment by 2030. Canada, the top uranium producer outside Kazakhstan, assesses enrichment options for domestic BWRX-300 builds, potentially creating a continental fuel-cycle cluster.
Europe faces mixed signals. Germany’s post-2023 nuclear exit removed near-term LEU demand, yet France, the United Kingdom, and Central and Eastern European states are modernizing fleets and investing in HALEU plants. Urenco’s synchronous expansions in the Netherlands and Germany will add 750 tonnes SWU yearly, and the UK’s Capenhurst project targets 10 tonnes HALEU annually by 2031. EU reliance on Russian enriched uranium, worth EUR 700 million in 2024, accelerates these projects, while new partnerships in Mongolia and Uzbekistan diversify the primary supply.

Competitive Landscape
The uranium enrichment market remains highly concentrated. Rosatom’s Tenex and China National Nuclear Corporation controlled more than 62% of global SWU capacity in 2024, reinforcing geopolitical risk for Western utilities. Urenco is the principal Western competitor, operating across three continents with roughly 10 million SWU annually and newly authorized 10% enrichment at its New Mexico plant.
Government procurement is reshaping competition. DOE’s multibillion-dollar contracts assure off-take for domestic entrants, while the UK and EU subsidize HALEU projects to deter reliance on Russian supply. Technology differentiation is emerging as the critical battleground. Global Laser Enrichment’s SILEX process promises lower energy usage, and ASP Isotopes is piloting quantum methods. Companies securing proprietary processes can command premium pricing, particularly for HALEU volumes tied to SMR deployments.
Strategic alliances are deepening vertical integration. Orano’s joint venture in Uzbekistan guarantees feed material for French enrichment plants. BWX Technologies is building centrifuge manufacturing in Tennessee to support defense fuel autonomy, and Centrus has entered a 10-year enriched uranium supply agreement with Korea Hydro & Nuclear Power. Consolidation appears likely as capital intensity and technological barriers favor well-funded incumbents allied with national governments.
Uranium Enrichment Industry Leaders
URENCO Group
Tenex (Rosatom)
Orano
CNNC (SWU/LES)
Centrus Energy Corp.
- *Disclaimer: Major Players sorted in no particular order


Recent Industry Developments
- July 2025: Global Laser Enrichment submitted a full license application for the Paducah laser enrichment facility aimed at processing 200,000 metric tons of tails with commercial operations penciled in for 2030.
- June 2025: DOE extended Centrus Energy’s HALEU supply contract after Centrus reached the 900 kg production milestone at Piketon, Ohio.
- May 2025: Urenco USA started production from its new centrifuge cascade in New Mexico, the first phase of a 700,000 SWU annual expansion finishing in 2027.
- April 2025: BWX Technologies acquired land in Oak Ridge, Tennessee for advanced centrifuge manufacturing tied to DOE’s Domestic Uranium Enrichment Centrifuge Experiment program.
- March 2025: Orano and Uzbekistan’s Navoiyuran formed Nurlikum Mining to develop South Djengeldi, targeting 700 tonnes uranium a year.


Global Uranium Enrichment Market Report Scope
| Gaseous Diffusion |
| Gas Centrifuge |
| Laser Isotope Separation |
| Plasma Separation |
| Chemical Exchange |
| Low-Enriched Uranium (LEU) |
| High-Assay Low-Enriched Uranium (HALEU) |
| Highly Enriched Uranium (HEU) |
| Nuclear Power Generation |
| Small Modular Reactors (SMRs) |
| Research Reactors |
| Medical Isotope Production |
| Naval Propulsion |
| Utilities & Nuclear Power Plants |
| Government & Defense |
| Fuel Fabricators |
| Research Institutions |
| Private SMR Developers |
| North America | United States |
| Canada | |
| Mexico | |
| Europe | Germany |
| United Kingdom | |
| France | |
| Italy | |
| NORDIC Countries | |
| Russia | |
| Rest of Europe | |
| Asia-Pacific | China |
| India | |
| Japan | |
| South Korea | |
| ASEAN Countries | |
| Rest of Asia-Pacific | |
| South America | Brazil |
| Argentina | |
| Rest of South America | |
| Middle East and Africa | Saudi Arabia |
| United Arab Emirates | |
| South Africa | |
| Egypt | |
| Rest of Middle East and Africa |
| By Enrichment Method | Gaseous Diffusion | |
| Gas Centrifuge | ||
| Laser Isotope Separation | ||
| Plasma Separation | ||
| Chemical Exchange | ||
| By Type of Uranium | Low-Enriched Uranium (LEU) | |
| High-Assay Low-Enriched Uranium (HALEU) | ||
| Highly Enriched Uranium (HEU) | ||
| By Application | Nuclear Power Generation | |
| Small Modular Reactors (SMRs) | ||
| Research Reactors | ||
| Medical Isotope Production | ||
| Naval Propulsion | ||
| By End-user | Utilities & Nuclear Power Plants | |
| Government & Defense | ||
| Fuel Fabricators | ||
| Research Institutions | ||
| Private SMR Developers | ||
| By Geography | North America | United States |
| Canada | ||
| Mexico | ||
| Europe | Germany | |
| United Kingdom | ||
| France | ||
| Italy | ||
| NORDIC Countries | ||
| Russia | ||
| Rest of Europe | ||
| Asia-Pacific | China | |
| India | ||
| Japan | ||
| South Korea | ||
| ASEAN Countries | ||
| Rest of Asia-Pacific | ||
| South America | Brazil | |
| Argentina | ||
| Rest of South America | ||
| Middle East and Africa | Saudi Arabia | |
| United Arab Emirates | ||
| South Africa | ||
| Egypt | ||
| Rest of Middle East and Africa | ||


Key Questions Answered in the Report
What CAGR is projected for the uranium enrichment market during 2025-2030?
The market is forecast to post a 9.25% CAGR, climbing from USD 12.98 billion in 2024 to USD 22.16 billion by 2030.
Why is HALEU becoming important for nuclear fuel supply?
Small modular and other advanced reactors operate on 15-20% U-235 fuel, driving HALEU demand up 12.3% CAGR and prompting new Western enrichment projects.
Which region currently leads demand for enriched uranium?
Asia-Pacific held 33.7% share in 2024, backed by China’s reactor build-out and Japan’s restart program.
How concentrated is global enrichment capacity?
The top five producers, led by Rosatom and CNNC, control more than 80% of global SWU capacity, indicating a highly concentrated market.
What technology is disrupting traditional centrifuge enrichment?
Laser isotope separation, notably through SILEX technology at Global Laser Enrichment’s Paducah project, is expected to grow at 11.2% CAGR through 2030.
How are Western governments addressing reliance on Russian enrichment?
The United States allocated USD 3.4 billion for domestic LEU contracts, the EU is funding HALEU facilities, and multiple Western firms are expanding or building centrifuge and laser plants.
Page last updated on:


