
United States Solar Photovoltaic (PV) Market Size and Share
Market Overview
| Study Period | 2022 - 2032 |
|---|---|
| Forecast Data Period | 2027 - 2032 |
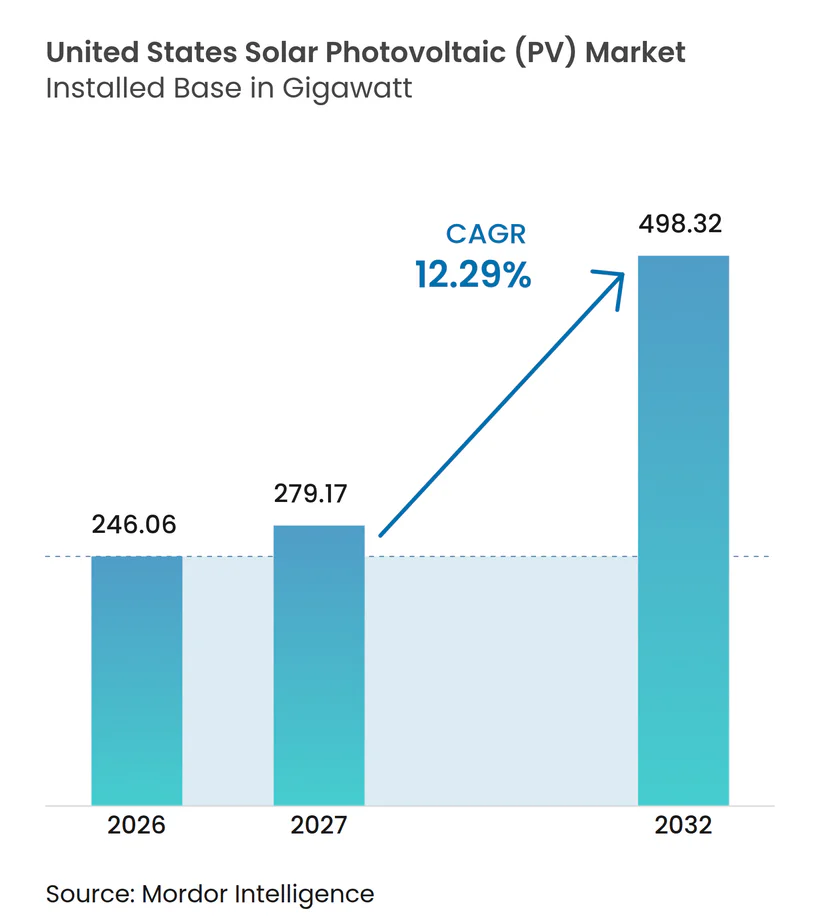
| Base Year Market Size (2026) | 246.06 gigawatt |
| Market Volume (2027) | 279.17 gigawatt |
| Market Volume (2032) | 498.32 gigawatt |
| Growth Rate (2027 - 2032) | 12.29 % |
| Market Concentration | Medium |
Major Players *Disclaimer: Major Players sorted in no particular order Image © Mordor Intelligence. Reuse requires attribution under CC BY 4.0. | |
United States Solar Photovoltaic (PV) Market Analysis by Mordor Intelligence
The United States Solar Photovoltaic Market size in terms of installed base is expected to increase from 246.06 gigawatt in 2026 to 279.17 gigawatt in 2027 and reach 498.32 gigawatt by 2032, growing at a CAGR of 12.29% over 2027-2032. The United States Solar Photovoltaic (PV) market is supported by utility-scale construction, with 43 GW installed during 2025 and solar remaining the largest source of new generating capacity for a 5th consecutive year.[1] Developers are preparing for 43.4 GW of utility-scale solar additions in 2026, which places project schedules and interconnection readiness at the center of investment decisions.[2] Corporate electricity demand is reinforcing the role of large buyers in the United States Solar Photovoltaic (PV) market, while storage is improving the value of generation delivered outside midday hours.[3] Domestic manufacturing is also becoming more important because module availability, ownership structures, and local production affect project eligibility and procurement choices. The main limits on the United States Solar Photovoltaic (PV) market are long interconnection timelines, grid congestion, and a tighter federal incentive timetable, which favor developers with ready projects and secure financing.[4]
Key Report Takeaways
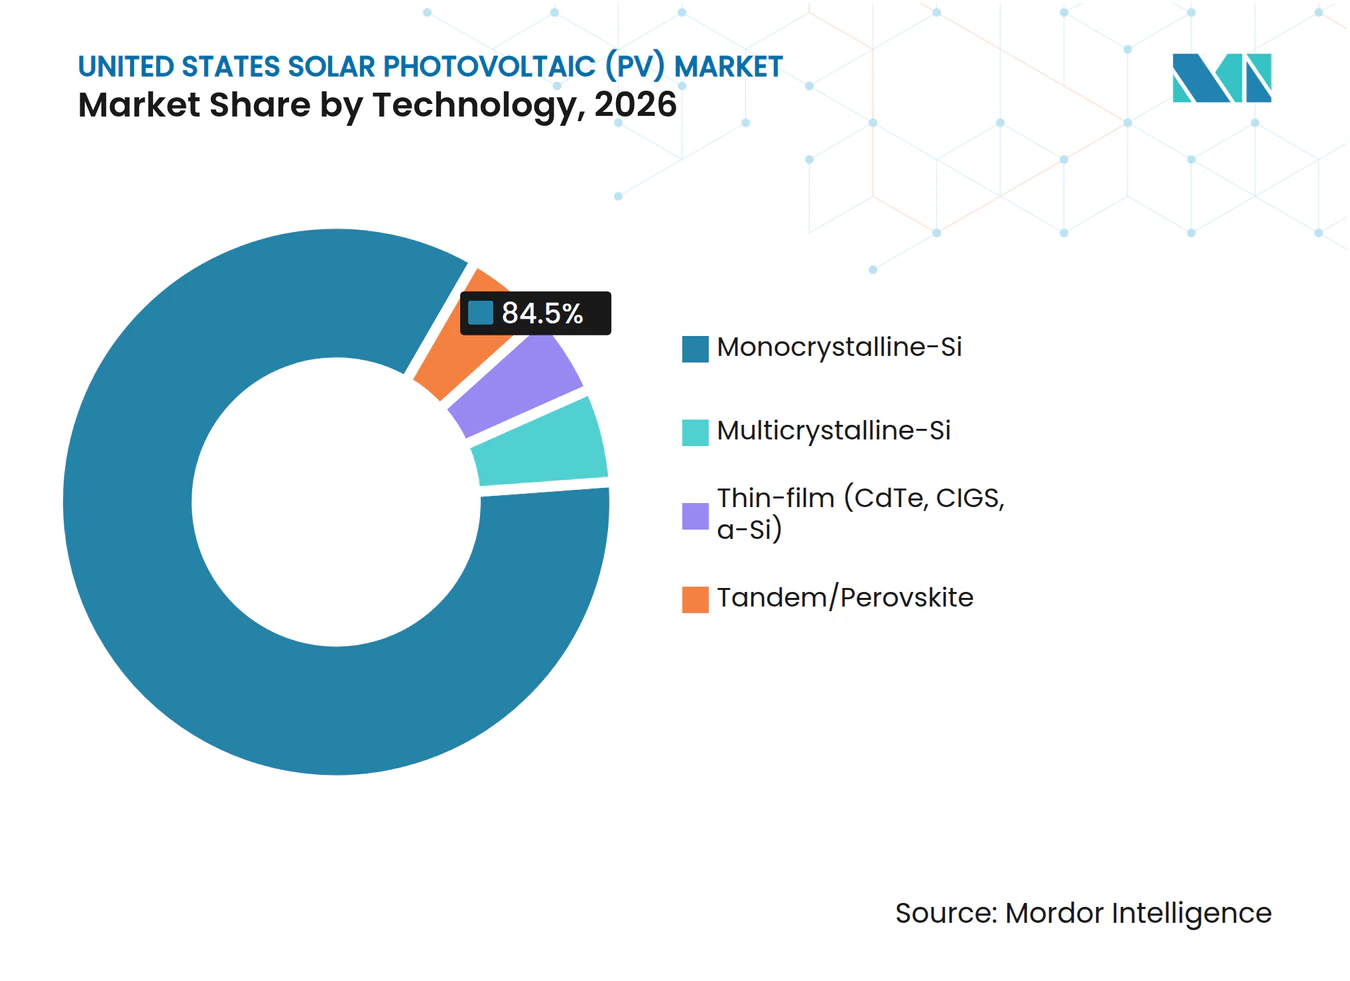
- By technology, Monocrystalline-Si held 84.5% of the United States Solar Photovoltaic (PV) market share in 2026, while Tandem/Perovskite is forecast to expand at a 32.6% CAGR through 2032.
- By deployment type, ground-mounted systems accounted for 73.8% of the United States Solar Photovoltaic (PV) market share in 2026, while floating PV is projected to grow at a 22.3% CAGR through 2032.
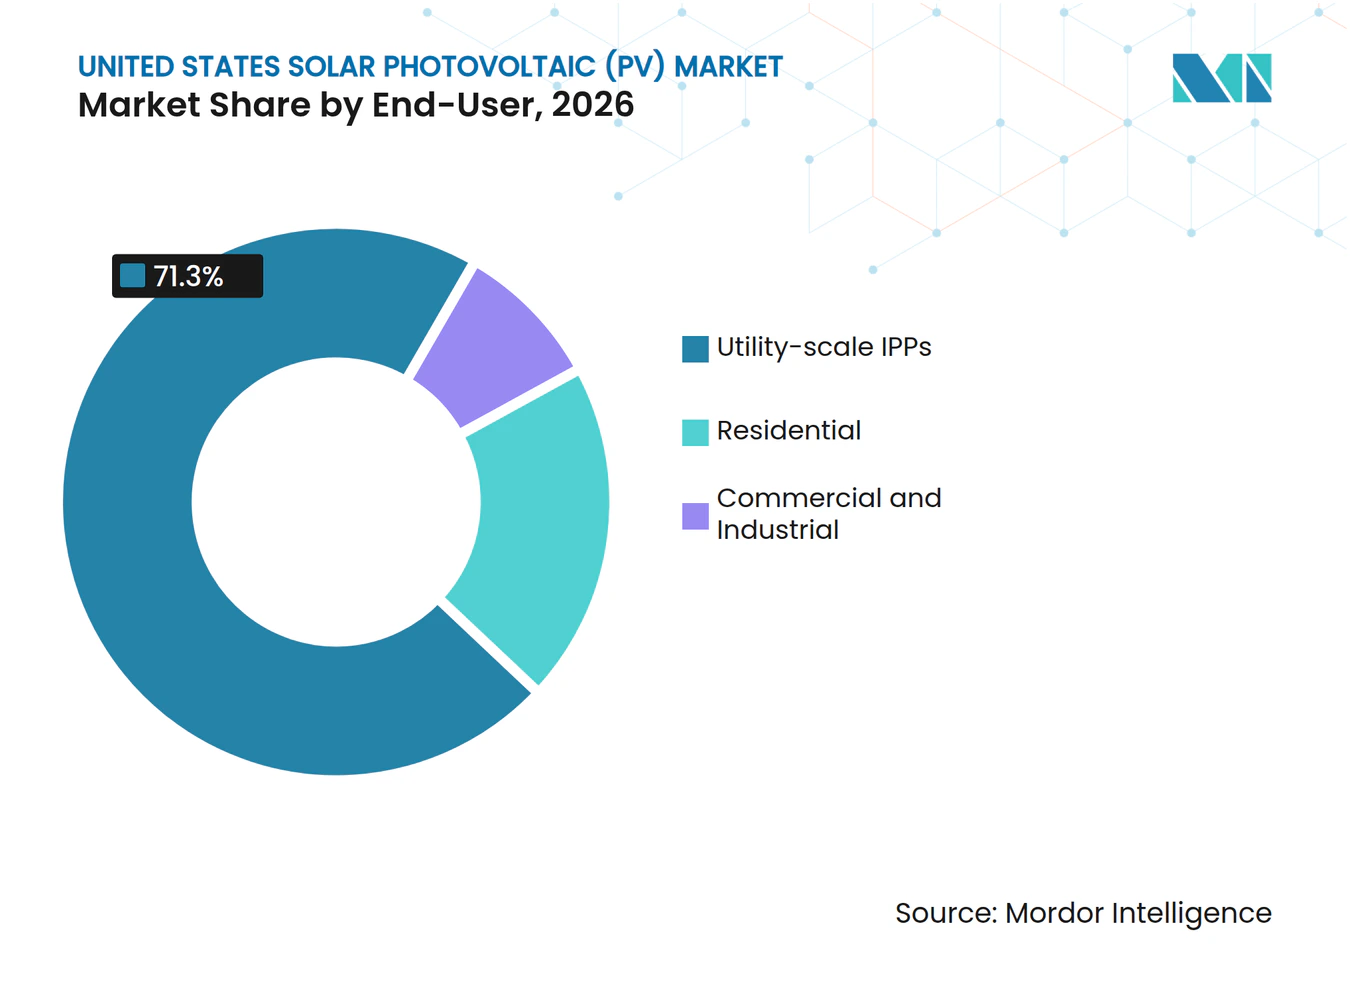
- By end-user, utility-scale Independent Power Producers (IPPs) accounted for 71.3% of the United States Solar Photovoltaic (PV) market size in 2026 and are forecast to grow at a 13.7% CAGR through 2032.
Note: Market numbers in this report are based on Mordor Intelligence's proprietary estimation framework, which combines nine months of actuals with Q4 projections for base year 2026.
United States Solar Photovoltaic (PV) Market Trends and Insights
Drivers Impact Analysis*
| Driver | (~) % Impact on CAGR Forecast | Geographic Relevance | Impact Timeline |
|---|---|---|---|
| Federal Tax Incentives and Project Bankability | +4.0% | National, with stronger gains in ERCOT and MISO | Short term (≤ 2 years) |
| Corporate Power Procurement and Data-Center Load Growth | +2.5% | ERCOT, PJM, and CAISO | Medium term (2-4 years) |
| Solar-Plus-Storage and Grid-Edge Value Stacking | +2.0% | CAISO, ERCOT, and SPP | Medium term (2-4 years) |
| Domestic Manufacturing and Supply-Chain Localization | +1.5% | National, especially the Southeast and Southwest | Medium term (2-4 years) |
| Retail Electricity Rate Inflation and Resilience Demand | +0.8% | National, especially California, New Jersey, and Virginia | Medium term (2-4 years) |
| Agrivoltaics and Land-Use Optimization | +0.5% | Midwest cropland belt, Southeast, and Nevada | Long term (≥ 4 years) |
| Source: Mordor Intelligence | |||
Federal Tax Incentives and Project Bankability
Federal incentives continue to shape project sequencing in the United States Solar Photovoltaic (PV) market. The revised timetable for Sections 48E and 45Y links access to credits with construction and in-service milestones, making schedule certainty material to project finance. Developers with completed land, equipment, engineering, and interconnection work are better placed to meet the applicable requirements. This environment brings lenders, tax-equity providers, and construction contractors into financing discussions earlier. It also concentrates capital around projects that can demonstrate a credible path to commercial operation. The retained Section 45X manufacturing credit preserves an incentive for US production even as project-level eligibility becomes more constrained.
Corporate Power Procurement and Data-Center Load Growth
Large corporate buyers are becoming a more visible source of contracted demand for the United States Solar Photovoltaic (PV) market. Clearway Energy Group signed agreements with Google totaling nearly 1.2 GW across Missouri, Texas, and West Virginia. These agreements show why developers with large portfolios and established delivery capabilities can secure long-term offtake. Data-center demand is particularly relevant in the Electric Reliability Council of Texas (ERCOT), PJM Interconnection (PJM), and the California Independent System Operator (CAISO) because new loads require dependable energy supply. Larger contracts can support financing for projects that would otherwise face merchant-price exposure. The resulting concentration of demand increases the value of strong customer relationships and timely project execution.
Solar-Plus-Storage and Grid-Edge Value Stacking
Co-located batteries broaden the revenue options available to projects in the United States Solar Photovoltaic (PV) market. An analysis of 280 operating solar-plus-storage projects found that batteries could raise the national generation-weighted value of solar from USD 29 per MWh to USD 75 per MWh in 2024. The improvement came mainly from capacity value, followed by ancillary services and energy shifting. A shared interconnection point can also reduce development complexity when grid access is scarce. The 837 MW Tehuacana Creek 1 project in Texas combines solar capacity with 418 MW of storage, showing the scale at which this design is being used. Storage therefore helps developers respond to curtailment and evening-demand conditions that standalone systems cannot address as effectively.
Domestic Manufacturing and Supply-Chain Localization
Domestic production is changing equipment procurement in the United States Solar Photovoltaic (PV) market. Announced investment in US solar manufacturing reached USD 45.8 billion after the Inflation Reduction Act, while online module capacity exceeded 65.5 GW by mid-2025. Corning entered wafer production during Q3 2025, completing a domestic solar supply chain that included wafers, cells, and modules. Local production can reduce procurement uncertainty for developers seeking domestic-content benefits. It also makes ownership, sourcing, and compliance standards more relevant in supplier selection. Manufacturing expansion in Georgia, South Carolina, and other southern states links industrial investment with nearby project-development activity.
Restraints Impact Analysis*
| Restraint | (~) % Impact on CAGR Forecast | Geographic Relevance | Impact Timeline |
|---|---|---|---|
| Interconnection Queue Delays and Upgrade Costs | -3.50% | National (especially PJM, MISO, and the Non-ISO West) | Medium term (2-4 years) |
| Federal Tax-Credit Phaseout and Policy Uncertainty | -2.50% | National (greater effect on community solar & residential) | Short term (≤ 2 years) |
| Trade Actions and Imported Component Cost Volatility | -2.00% | National (concentrated among crystalline silicon module buyers) | Medium term (2-4 years) |
| Transmission Congestion, Curtailment, and Negative Pricing | -1.50% | CAISO, ERCOT in West Texas, and the Non-ISO West | Medium term (2-4 years) |
| Source: Mordor Intelligence | |||
Interconnection Queue Delays and Upgrade Costs
Interconnection remains the most persistent constraint on the United States Solar Photovoltaic (PV) market. The Federal Energy Regulatory Commission (FERC) recorded 2,130 GW of active queue capacity at the end of 2025, and solar, storage, and hybrid projects represented 74% of the total. Lawrence Berkeley National Laboratory found that the median time from application to an interconnection agreement exceeded 3 years, while commercial operation could take more than 5 years in regions with available data. Long review periods can put incentive eligibility and equipment-delivery schedules at risk. They can also expose developers to uncertain network upgrade requirements. Queue reforms can improve future processing, but active projects still require transmission solutions and clearer cost allocation.
Federal Tax-Credit Phaseout and Policy Uncertainty
The faster phaseout schedule makes policy timing a direct project risk for the United States Solar Photovoltaic (PV) market. Projects that do not meet relevant construction or service deadlines may lose access to Sections 48E and 45Y. This places more pressure on project sponsors to finalize financing, procurement, and construction plans quickly. The end of Section 25D credit after 2025 also changes the economics for owner-occupied rooftop systems. Third-party ownership can partly reduce the upfront cost facing customers who continue to consider distributed solar. Community and smaller commercial projects may face greater difficulty because they often have less financing flexibility than large utility-scale portfolios.
*Our forecasts treat driver/restraint impacts as directional, not additive. The impact forecasts reflect baseline growth, mix effects, and variable interactions.
Segment Analysis
By Technology: Monocrystalline-Si Retains Scale While Tandem Cells Advance
Monocrystalline-Si held 84.5% of the United States Solar Photovoltaic (PV) market share in 2026. Its position rests on established manufacturing processes, high conversion efficiency, and broad acceptance among utility-scale buyers. Tunnel Oxide Passivated Contact (TOPCon) cell upgrades continue to improve the performance of crystalline silicon modules. Multicrystalline-Si is losing relevance in large projects because its efficiency ceiling limits power density. This matters where land, tracker capacity, and interconnection rights must yield the highest possible output. The United States Solar Photovoltaic (PV) industry therefore continues to rely on monocrystalline technology for most capacity additions.
Tandem/Perovskite is forecast to grow at a 32.6% CAGR through 2032. Perovskite/silicon tandem cells achieved certified conversion efficiency of 35.0% by 2026, exceeding the single-junction crystalline-silicon limit.. Commercial activity in 2025 included tandem module sales and announcements for gigawatt-scale facilities. Trinasolar reported a certified 32.6% record for a 210 mm half-cut industrial tandem cell and an 865 W module output record. These results suggest that higher-efficiency technologies are moving closer to production-relevant formats. Thin-film also has a strategic role because First Solar’s cadmium telluride modules are domestically produced and do not rely on crystalline silicon.



By Deployment Type: Ground-Mounted Systems Lead While Floating PV Expands Siting Options
Ground-mounted systems accounted for 73.8% of the United States Solar Photovoltaic (PV) market size in 2026. Large sites benefit from lower structural costs than rooftops and can use trackers to increase output. Their scale also supports centralized construction, operations, and interconnection planning. Rooftop and building-integrated systems serve different customer needs and face different compensation structures. Changes from full retail net metering toward avoided-cost compensation affect project economics for some new customers. Storage pairing is becoming more relevant as system owners seek resilience and higher self-consumption.
Floating PV is projected to grow at a 22.3% CAGR through 2032. The National Renewable Energy Laboratory (NREL) estimates that federally controlled reservoirs could technically host 861 GW to 1,042 GW of floating capacity. Diamond Infrastructure and Third Pillar Solar agreed to develop up to 500 MW on Texas reservoirs. The Texas proposal includes a stated potential investment above USD 700 million and projected evaporation savings of 15%. These projects show how water infrastructure can create a new siting option for solar assets. Water and land-management considerations can therefore support deployment where conventional sites are constrained.
By End-User: Utility-Scale Independent Power Producers (IPPs)
Utility-scale IPPs held 71.3% of the United States Solar Photovoltaic (PV) market size in 2026 and are forecast to expand at a 13.7% CAGR through 2032. Their scale aligns with large corporate contracts that often require hundreds of megawatts. IPPs can combine development teams, financing capacity, and operating experience across several states. This supports larger project portfolios and helps spread permitting and interconnection risk. It also gives established developers an advantage when schedules are compressed by policy deadlines. The United States Solar Photovoltaic (PV) industry consequently remains led by companies that can finance and deliver utility-scale capacity.
Institutional capital remains important in the IPP segment. AES secured a USD 700 million revolving credit facility for 2 GW of clean-energy capacity across 9 states. This financing model shows the advantage held by sponsors that can support larger portfolios. Commercial and industrial users face higher Power Purchase Agreement (PPA) prices and must assess on-site generation against grid costs. Residential customers are adapting to the end of Section 25D through third-party ownership and storage-based offerings. Those models can preserve access to solar without requiring the customer to make the full upfront investment.

Geography Analysis
Texas accounted for 40% of planned 2026 utility-scale additions and installed 11 GW during 2025. This share makes Texas the central growth location within the United States Solar Photovoltaic (PV) market. ERCOT offers extensive solar resources, large sites, industrial demand, and increasing data-center load. The state also supports large solar-plus-storage projects that can respond to changing grid conditions. Its high planned capacity reinforces the importance of utility-scale developers with mature project pipelines.
The Southwest remains important, with Arizona and California each representing 6% of planned 2026 additions. California has strong solar resources, but negative prices occurred in 28.26% of 5-minute intervals during April 2026. This compared with an 8.4% full-year average in 2025 and reflected midday oversupply and limited northbound transmission. California Independent System Operator (CAISO) approved USD 6.7 billion of transmission projects in 2026 to address congestion and demand growth. Arizona, California, and Nevada remain relevant because high irradiance can still support strong project economics when grid access is available.
The Southeast is gaining relevance as both a manufacturing and deployment area in the United States Solar Photovoltaic (PV) market. Hanwha Qcells’ Georgia campus can produce up to 8.4 GW of modules each year and is advancing full ingot, wafer, and cell integration by the end of 2026. First Solar plans to begin production at its 3.7 GW Gaffney facility in South Carolina during H2 2026. The Midwest recorded the fastest year-on-year installation growth in 2025, as Indiana increased installations from 1.6 GW to nearly 3 GW and Illinois, Ohio, and Michigan set records. In the Mid-Atlantic, queue delays remain a major bankability issue, while Southwest Power Pool (SPP) has increased agreement signings and introduced an interim application mechanism.
Competitive Landscape
Market Concentration
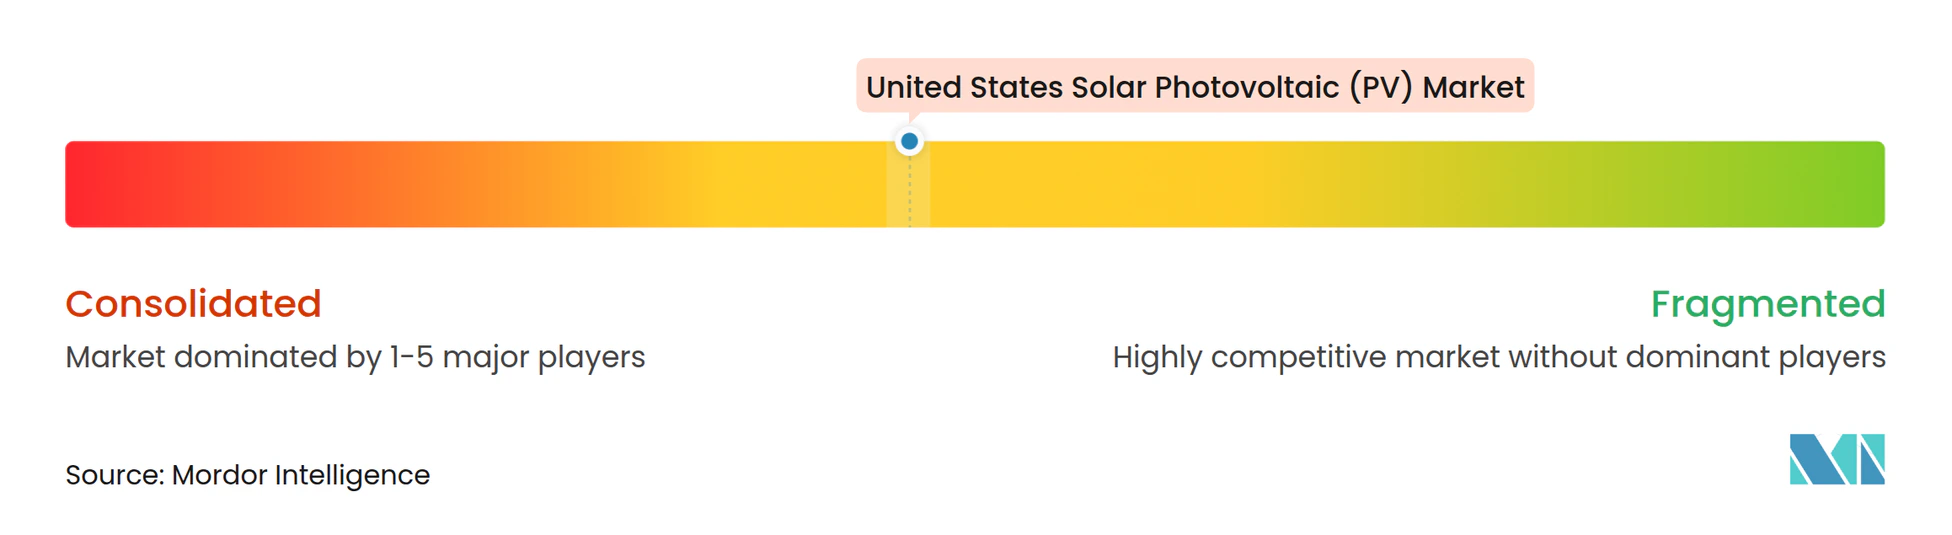
The United States Solar Photovoltaic (PV) market is moderately concentrated across manufacturing, development, and residential sales. Module production is moderately fragmented, while utility-scale development is more concentrated around firms with financing capacity and contracted portfolios. Domestic sourcing and ownership compliance have become important differentiators for module suppliers. First Solar has a distinct position because its cadmium telluride technology supports a differentiated domestic manufacturing offer. The company selected South Carolina for a 3.7 GW facility, which is scheduled to begin commercial operations during H2 2026. These factors give it visibility in a procurement environment that places greater weight on domestic capacity.
Hanwha Qcells is advancing vertical integration at its Cartersville, Georgia campus, which strengthens its domestic manufacturing position. Canadian Solar formed CS PowerTech under 75.1% North American ownership and plans to expand its Mesquite, Texas facility to 10 GW of nameplate capacity by H2 2026. Nextpower has moved beyond tracker supply toward power conversion, electrical systems, robotic operations, and digital monitoring. This change reflects a broader effort to capture more value across a project’s operating life. In the development tier, NextEra Energy, AES, Invenergy, EDF Renewables NA, and Brookfield Renewable benefit from scale, financing relationships, and established power-purchase counterparties. Community solar and agrivoltaics remain areas where interconnection barriers and fragmented capabilities limit scaled participation.
Residential competition is increasingly shaped by integrated solar and storage products. Tesla held 33.4% of the US residential inverter market in Q4 2025, passing Enphase and SolarEdge as bundled systems gained importance. Enphase lost 13 percentage points of share during 2025. Sunrun’s multiyear relationship with NRG Energy is intended to aggregate household batteries into dispatchable ERCOT capacity. This approach gives residential providers a route to revenue from grid services as well as system sales. Competition in this tier is therefore moving from stand-alone equipment performance toward storage attachment, customer financing, and fleet operation.
United States Solar Photovoltaic (PV) Industry Leaders
-
First Solar, Inc.
-
Hanwha Q CELLS USA Corp.
-
Canadian Solar Inc.
-
JinkoSolar Holding Co., Ltd.
-
Trina Solar Co., Ltd.
- *Disclaimer: Major Players sorted in no particular order
Recent Industry Developments
- December 2025: Canadian Solar formed CS PowerTech as a US manufacturing platform under 75.1% North American ownership. Its Mesquite, Texas factory reached an annual run rate above 5 GW, and the company plans to expand the facility to 10 GW by H2 2026.
- November 2025: First Solar announced a new USD 330 million, 3.7 GW manufacturing facility in Gaffney, South Carolina. The company expects the plant to begin commercial operations in H2 2026 and raise its US-compliant annual nameplate capacity to 17.7 GW.
- August 2025: Diamond Infrastructure Solutions and Third Pillar Solar agreed to develop up to 500 MW of floating solar projects on Texas reservoirs, with a potential investment above USD 700 million.
- April 2025: AES Corporation secured a USD 700 million revolving credit facility to fund 2 GW of solar and battery storage projects across 9 US states.
United States Solar Photovoltaic (PV) Market Report Scope
Solar Photovoltaic (PV) technology is a non-mechanical method that converts sunlight directly into direct current (DC) electricity using semiconductor materials like silicon through the photovoltaic effect.
The United States solar photovoltaic (PV) market is segmented by technology, deployment type, and end user. By technology, the market is segmented into monocrystalline silicon, multicrystalline silicon, thin-film technologies, including cadmium telluride (CdTe), copper indium gallium selenide (CIGS), and amorphous silicon (a-Si), and tandem/perovskite technologies. By deployment type, the market is segmented into ground-mounted systems, rooftop and building-integrated photovoltaics (BIPV), and floating PV systems. By end user, the market is segmented into residential, commercial, industrial, and utility-scale independent power producers (IPPs). For each segment, the market sizing and forecasts are provided on the basis of installed capacity (GW).
| Monocrystalline-Si |
| Multicrystalline-Si |
| Thin-film (CdTe, CIGS, a-Si) |
| Tandem/Perovskite |
| Ground-mounted |
| Rooftop/Building-Integrated (BIPV) |
| Floating PV |
| Residential |
| Commercial and Industrial |
| Utility-scale IPPs |
| By Technology | Monocrystalline-Si |
| Multicrystalline-Si | |
| Thin-film (CdTe, CIGS, a-Si) | |
| Tandem/Perovskite | |
| By Deployment Type | Ground-mounted |
| Rooftop/Building-Integrated (BIPV) | |
| Floating PV | |
| By End-User | Residential |
| Commercial and Industrial | |
| Utility-scale IPPs |
Key Questions Answered in the Report
What is the projected United States Solar Photovoltaic (PV) market size by 2032?
Capacity is projected to reach 498.32 GW by 2032, from 279.17 GW in 2027, at a 12.29% CAGR.
Which technology leads US solar deployment?
Monocrystalline-Si leads with 84.5% share in 2026, supported by established supply chains and efficiency improvements.
Why are solar-plus-storage projects expanding?
Batteries can increase solar's generation-weighted value by shifting output and providing capacity and ancillary services.
Which deployment type is growing fastest?
Floating PV is forecast to grow at a 22.3% CAGR through 2032, supported by reservoir and stormwater-pond siting opportunities.
What is the largest constraint on new solar projects?
Interconnection delays are a major limit, with median timelines above 3 years to an agreement and more than 5 years to operation in some regions.
Why do large corporate buyers matter for solar development?
Large power purchase agreements, such as Clearways nearly 1.2 GW Google portfolio, help provide contracted demand for utility-scale projects.