
United States Soft Drinks Market Size and Share
Market Overview
| Study Period | 2022 - 2032 |
|---|---|
| Base Year Market Size (2026) | USD 301.92 Billion |
| Historical Data Period | 2022 - 2025 |
| Market Size (2027) | USD 315.30 Billion |
| Market Size (2032) | USD 392.40 Billion |
| Market Concentration | High |
Major Players *Disclaimer: Major Players sorted in no particular order Image © Mordor Intelligence. Reuse requires attribution under CC BY 4.0. | |
United States Soft Drinks Market Analysis by Mordor Intelligence
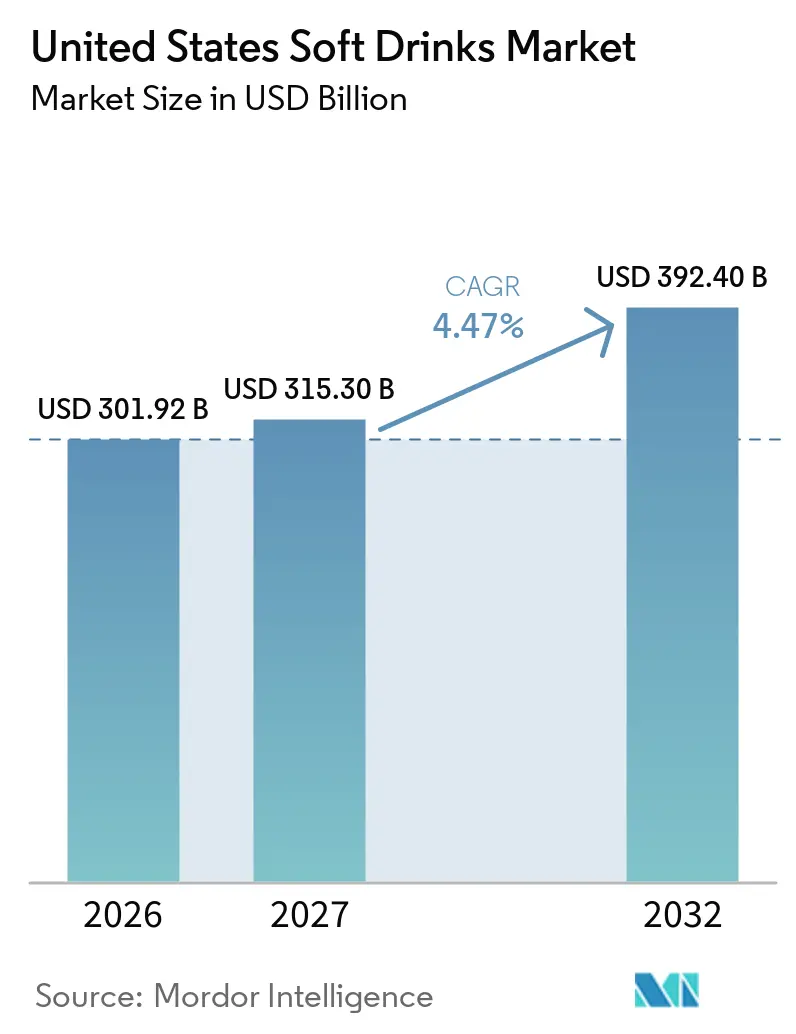
The United States soft drink market size was valued at USD 301.92 billion in 2026 and is estimated to grow from USD 315.30 billion in 2027 to reach USD 392.40 billion by 2032, at a CAGR of 4.47% during the forecast period (2027-2032). The United States soft drink market is supported by demand for beverages that combine refreshment with hydration, energy, digestive health, or recovery benefits. Established carbonated products remain important, but zero-sugar products, prebiotic sodas, energy drinks, sports drinks, and ready-to-drink coffee are drawing incremental spending. Manufacturers are also using pack sizes and price-per-ounce choices to manage higher costs for sweeteners, aluminum, and PET resin. This approach gives large companies room to protect their core ranges while buying or building brands in faster-moving categories. The United States soft drink market, therefore, offers opportunities in functional formulations, premium packaging, and formats that fit away-from-home occasions.
Key Report Takeaways
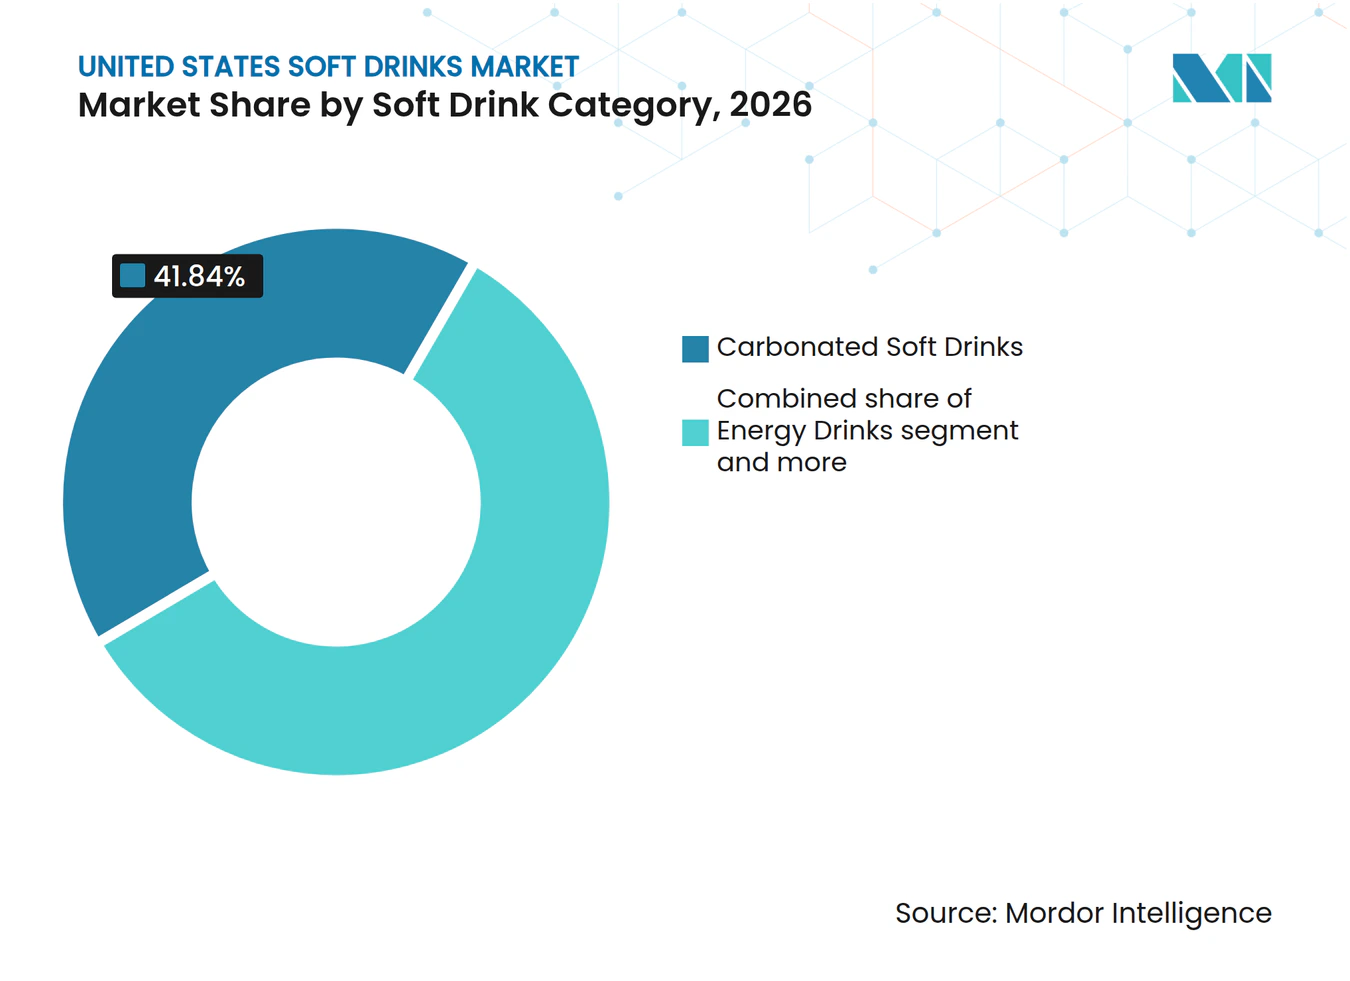
- By soft drink category, carbonated soft drinks led the United States soft drink market with a 41.84% share in 2026, while energy drinks are projected to grow at the fastest CAGR of 5.73% during 2027-2032.
- By packaging type, PET bottles led the United States soft drink market with a 56.35% share in 2026, while glass bottles are projected to grow at the fastest CAGR of 5.26% during 2027-2032.
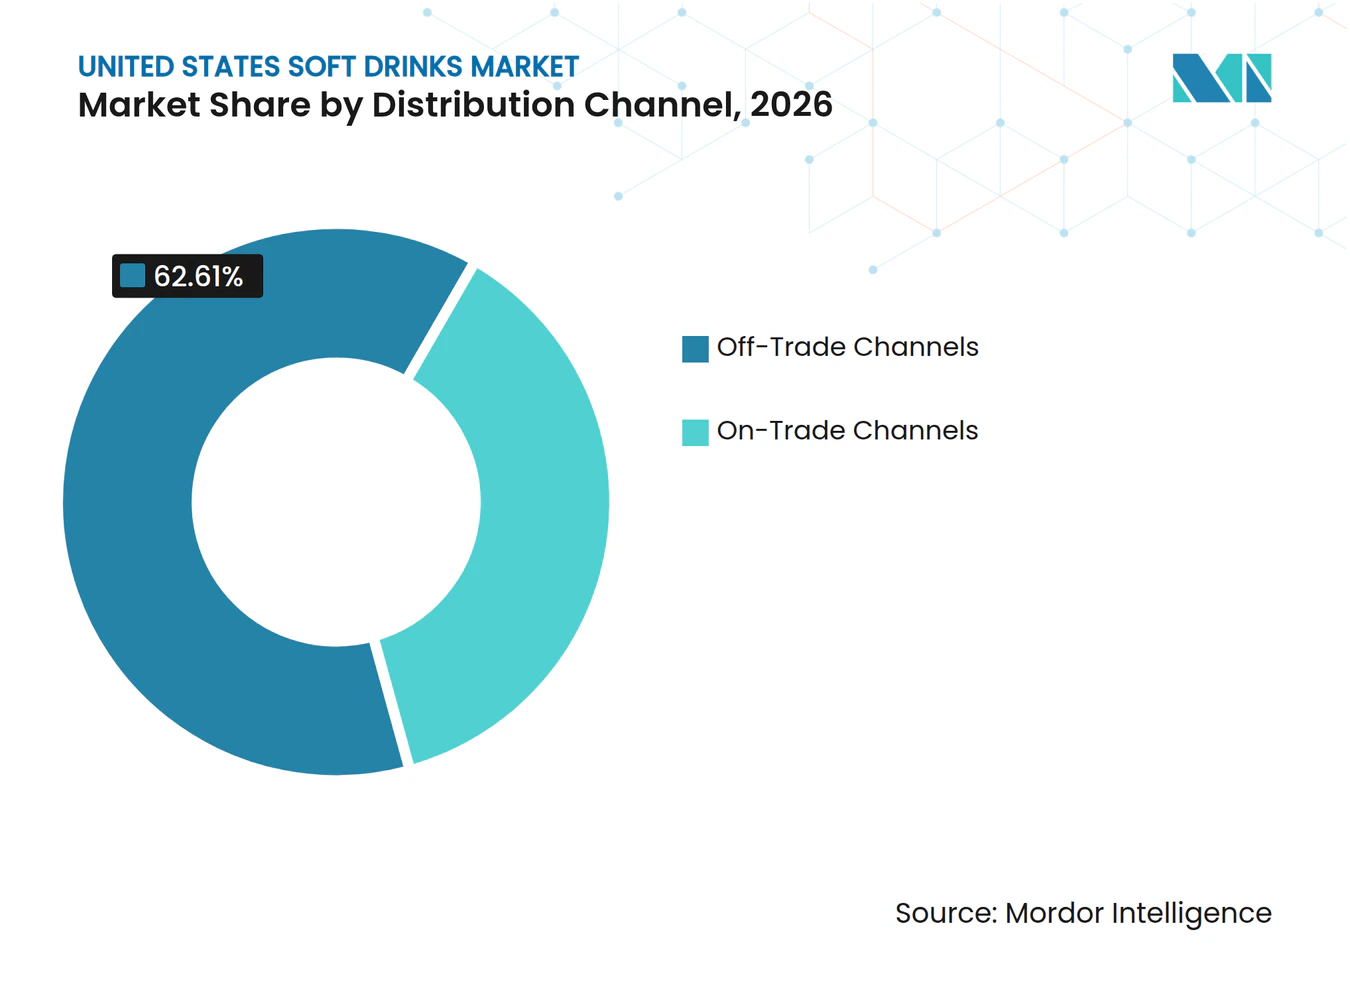
- By distribution channel, off-trade channels led the United States soft drink market with a 62.61% share in 2026, while on-trade channels are projected to grow at the fastest CAGR of 5.86% during 2027-2032.
Note: Market numbers in this report are based on Mordor Intelligence's proprietary estimation framework, which combines nine months of actuals with Q4 projections for base year 2026.
United States Soft Drinks Market Trends and Insights
Drivers Impact Analysis*
| Driver | (~) % Impact on CAGR Forecast | Geographic Relevance | Impact Timeline |
|---|---|---|---|
| Expansion of Zero-Sugar and Low-Calorie Portfolios | +1.1% | National, with above-average demand in Northeast and West Coast metropolitan areas | Short term (≤ 2 years) |
| Functionalization of Mainstream Soft Drinks | +0.9% | National, concentrated in health retail corridors and club channels | Medium term (2-4 years) |
| Premiumization of Hydration Products | +0.7% | Northeast, West Coast, and high-income suburban markets | Medium term (2-4 years) |
| Growth of Convenient Ready-to-Drink Formats | +0.6% | National, led by convenience stores and e-commerce | Short term (≤ 2 years) |
| Broadening Fitness, Recovery and Active-Lifestyle Occasions | +0.5% | National, with strongest demand in the South and West | Medium term (2-4 years) |
| Flavor Innovation Across Cola, Citrus and Fruit Beverages | +0.4% | National, with rapid limited-edition activity in the Midwest and South | Short term (≤ 2 years) |
| Source: Mordor Intelligence | |||
Expansion of Zero-Sugar and Low-Calorie Portfolios
Zero-sugar formulations are changing the volume mix within large carbonated beverage portfolios. Coca-Cola reported that Coca-Cola Zero Sugar achieved 14% global volume growth in the second quarter of 2025. The company also reported that low- and no-calorie drinks represented 30% of its portfolio volume. Products with fewer than 100 calories per 12-ounce serving represented 68% of its portfolio[1]. The United States soft drink market is also seeing a clearer division between mainstream zero-sugar colas and newer fruit-juice-sweetened prebiotic sodas. PepsiCo’s acquisition of Poppi illustrates why large manufacturers view this newer category as strategically important.
Functionalization of Mainstream Soft Drinks
Consumers increasingly expect soft drinks to offer a functional benefit alongside flavor. Prebiotics, electrolytes, and ingredients associated with energy or recovery are moving into conventional retail beverage aisles. PepsiCo completed its acquisition of Poppi in May 2025 for USD 1.95 billion, bringing a prebiotic soda platform into its portfolio. Coca-Cola launched Simply Pop in select United States markets during 2025, using its existing distribution system to enter the same space. Glanbia identifies hydration as the leading functional attribute sought by consumers, which supports wider use of electrolytes across drink categories. The United States soft drink market may require more specialized co-packing capacity as brands use ingredients that conventional carbonated beverage plants do not routinely handle.
Growth of Convenient Ready-to-Drink Formats
Ready-to-drink formats are expanding across coffee, tea, hydration, and functional soda. These products fit occasions where consumers do not want to prepare a drink or buy a larger pack. The National Coffee Association reported that 32% of Americans consumed cold brew, frozen or blended, or nitro coffee in the prior week during its Summer 2025 research[2]. That usage supports the United States soft drink market by making cold coffee a habitual choice rather than an occasional purchase. Single-serve formats can also bring higher revenue per ounce than multipacks. Manufacturers are extending distribution through gyms, sports venues, convenience stores, and direct subscriptions to capture these occasions.
Flavor Innovation Across Cola, Citrus and Fruit Beverages
Flavor launches remain a practical way to stimulate trial in established beverage categories. Keurig Dr. Pepper introduced Dr. Pepper Blackberry, 7UP Tropical Mango Peach, Snapple Peach Tea and Lemonade, and RC Cola Zero Sugar nationally in February 2025. The company cited Circana data showing that blackberry-flavored carbonated soft drink sales grew at twice the rate of the broader carbonated soft drink category in 2024. These launches pair familiar brands with flavors that can attract new buyers without changing the core product proposition. Permanent launches can build shelf continuity, while limited editions can support retailer promotions. The United States soft drink market benefits when flavor development is linked to zero-sugar and functional product platforms.
Restraints Impact Analysis*
| Restraint | (~) % Impact on CAGR Forecast | Geographic Relevance | Impact Timeline |
|---|---|---|---|
| Increasing Scrutiny of Artificial Sweeteners and Additives | -0.9% | National, with notable policy pressure in Louisiana, Texas, and California | Short term (≤ 2 years) |
| Rising Packaging, Sweetener and Co-Packing Costs | -0.8% | National, especially for PET-heavy brands and small-volume co-packers | Medium term (2-4 years) |
| Fragmented Recycling Infrastructure and Packaging Compliance | -0.6% | California, Colorado, Oregon, Maine, Minnesota, Maryland, and Washington | Medium term (2-4 years) |
| Higher Formulation Costs for Functional Ingredients | -0.5% | National, with a stronger effect on small and mid-sized functional brands | Long term (≥ 4 years) |
| Source: Mordor Intelligence | |||
Increasing Scrutiny of Artificial Sweeteners and Additives
Non-nutritive sweeteners face greater scrutiny from regulators and consumers. The FDA notes that approved sweeteners, including aspartame, have been reviewed for their intended uses. The agency also proposed front-of-package nutrition labeling in 2024 for added sugar, sodium, and saturated fat. These developments can draw consumer attention to formulations even when ingredients remain permitted. Manufacturers are responding with more products that use stevia, allulose, or other sweetening approaches. The United States soft drink market faces a more complex formulation environment as brands balance taste, cost, and label expectations. Smaller brands may find reformulation especially difficult because they have less scale in ingredient sourcing.
Fragmented Recycling Infrastructure and Packaging Compliance
Packaging compliance is becoming an increasingly important operational issue for beverage manufacturers. California requires a 25% postconsumer recycled content level for covered beverage containers beginning in 2025. California’s broader packaging producer-responsibility program also requires companies to plan for source reduction and recyclable or compostable packaging[3]. Companies that sell nationally may choose packaging specifications that meet the strictest state requirements. This can simplify operations but may increase packaging costs. The United States soft drink market is likely to reward companies that can secure recycled material and document compliance across state programs. These requirements place a larger administrative burden on smaller producers.
*Our forecasts treat driver/restraint impacts as directional, not additive. The impact forecasts reflect baseline growth, mix effects, and variable interactions.
Segment Analysis
By Soft Drink Category: Carbonated Soft Drinks Lead While Energy Drinks Grow Fastest
Carbonated soft drinks held 41.84% of the United States soft drink market share in 2026. Their scale reflects broad distribution, established consumer habits, and the continued importance of cola and fruit-flavored products. Zero-sugar extensions help carbonated brands retain consumers seeking lower-calorie options. Coca-Cola reported that Coca-Cola Zero Sugar grew 14% in global volume in the second quarter of 2025. The United States soft drink market keeps carbonated drinks at its center because they remain widely available in supermarkets, restaurants, vending machines, and convenience stores. Better-for-you innovations may help this segment remain relevant as consumer preferences shift.
Energy drinks are forecast to record a 5.73% CAGR during 2027-2032, making them the fastest-growing category. The category has attracted major acquisitions and distribution investments. Celsius completed its acquisition of Alani Nu for USD 1.8 billion in April 2025. PepsiCo completed the Poppi transaction in May 2025, reinforcing the value placed on functional beverage platforms. Sports drinks also benefit from broader use by active-lifestyle consumers. Juices and ready-to-drink tea retain demand where brands can offer clear ingredients, flavor variety, and convenient formats. Ready-to-drink coffee remains strategically relevant through cold brew and other portable formats.



By Packaging Type: PET Bottles Hold Scale While Glass Bottles Add Premium Appeal
PET bottles accounted for 56.35% of the United States soft drink market share in 2026. Their leadership reflects lightweight, resealable, and cost advantages for high-volume products. PET is particularly important for multipacks and larger formats sold through supermarkets and club stores. At the same time, recycled-content requirements are changing how manufacturers source and design plastic packaging. California’s beverage container rules require 25% postconsumer recycled content from 2025. The United States soft drink market continues to rely on PET because it supports mainstream volume and multiple consumption occasions.
Glass bottles are projected to grow at a 5.26% CAGR during 2027-2032. This growth reflects demand for premium presentation and consumer interest in packaging perceived as pure or durable. Jarritos expanded Mandarin Zero nationally in glass bottles in September 2025, using a familiar package format for a zero-calorie product. O-I Glass reported that consumers associate glass with purity and premium quality, particularly among people aged 25-44. Metal cans remain important for energy drinks and flavored sparkling water. Aseptic packs support long shelf life for juice and ready-to-drink tea. Packaging choices increasingly reflect regulatory requirements as well as cost and brand positioning.
By Distribution Channel: Off-Trade Holds the Largest Position While On-Trade Gains Momentum
Off-trade channels accounted for 62.61% of the United States soft drink market size in 2026. Supermarkets, hypermarkets, club stores, and convenience stores remain the main volume base for the category. These outlets provide broad availability for carbonated drinks, multipacks, hydration products, and energy drinks. Online retail adds another route for subscription-based functional beverage brands. Retailers are also adjusting shelf space as prebiotic soda and other better-for-you products expand. The United States soft drink market depends on off-trade distribution because it brings both frequent purchases and value-oriented pack options.
On-trade channels are projected to expand at a 5.86% CAGR during 2027-2032. Restaurants, gyms, sports venues, and entertainment sites can introduce consumers to premium sparkling water, ready-to-drink coffee, and functional beverages. These locations can earn more revenue per unit than retail because of higher serving prices. The channel also gives brands a way to test new products in specific consumption settings. PepsiCo and Coca-Cola can use established foodservice relationships to widen access to their functional ranges. The United States soft drink market gains from this channel as away-from-home occasions become more important for premium drinks.

Geography Analysis
The South and Southeast lead consumption volume in the United States soft drink market, supported by warm weather and demand across carbonated, sports, and energy drinks. The region has a dense network of convenience stores that supports single-serve purchases. Outdoor activity also supports year-round demand for hydration and isotonic formats. Keurig Dr. Pepper introduced Dr. Pepper Blackberry nationally in February 2025, building on the company’s established strength in Southern and Southwestern states. Large mainstream brands remain highly relevant because they are widely available and familiar to consumers. The region also offers a practical route for energy and sports drink brands seeking high-frequency usage.
The Northeast and West Coast offer stronger conditions for premium beverages and functional products. Higher urban density and income levels support demand for prebiotic soda, glass-packaged drinks, sparkling water, and cold brew coffee. California has particular influence because its packaging requirements can affect national product decisions. California’s packaging producer-responsibility framework encourages companies to prepare for recycling and source-reduction requirements. The United States soft drink market can use these regions to introduce higher-priced products before expanding nationally. These areas also support retail formats that specialize in health-oriented and premium beverages.
The Midwest remains a consistent volume region for the United States soft drink market. Club stores and warehouse retailers support multipack demand where price per ounce shapes purchasing decisions. Established cola and high-caffeine flavored drinks retain significant appeal in these outlets. Functional and zero-sugar products are gaining visibility in metropolitan areas, although adoption is lower than in coastal markets. This creates room for challenger brands to build trial through larger retail packs and familiar flavors. The regional pattern shows that one national portfolio needs different pricing, pack sizes, and product messages by location.
Competitive Landscape
Market Concentration
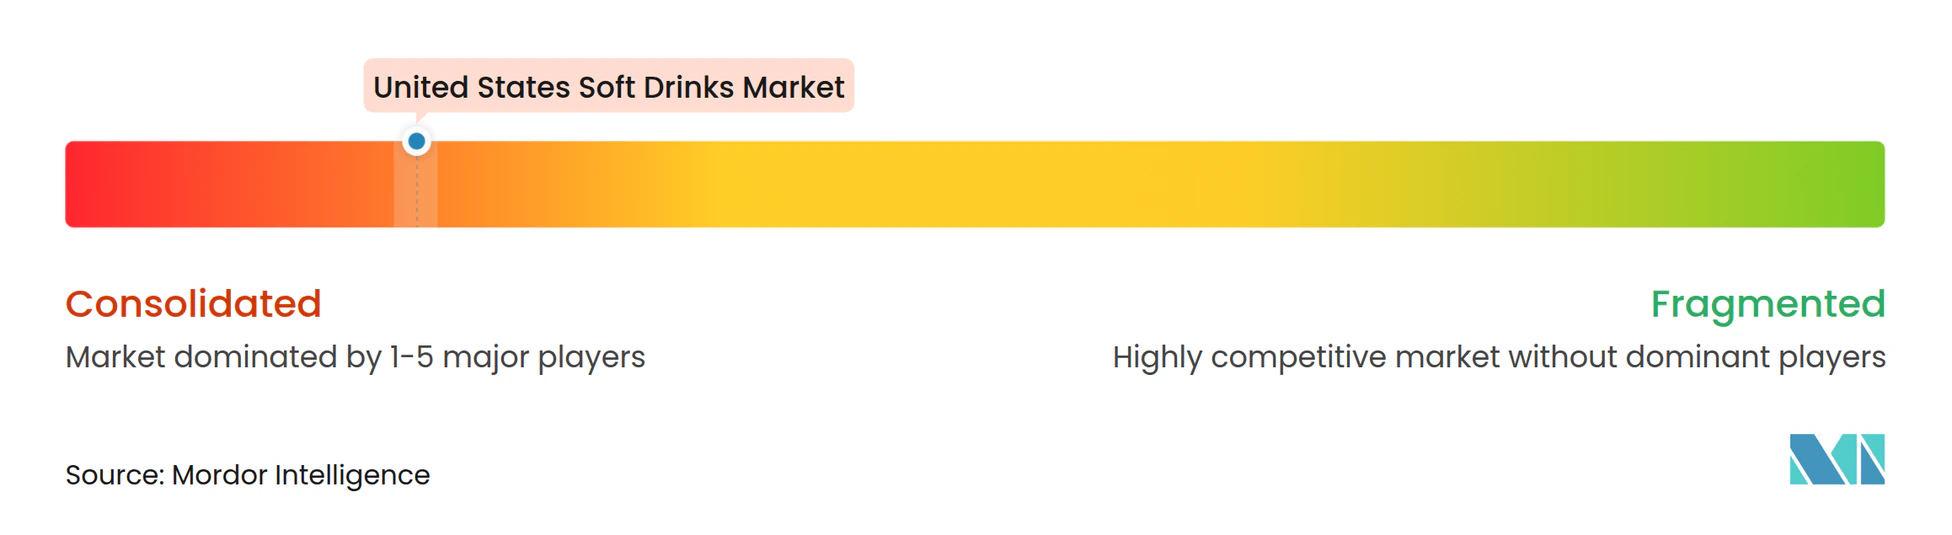
The United States soft drink market is highly consolidated, led by The Coca-Cola Company, PepsiCo, and Keurig Dr. Pepper, whose distribution networks, retailer relationships, and marketing resources make it difficult for smaller brands to compete nationally. Large companies are protecting established carbonated ranges while moving into functional and energy-adjacent products. PepsiCo completed the Poppi acquisition for USD 1.95 billion in May 2025. Celsius completed its USD 1.8 billion acquisition of Alani Nu in April 2025. These transactions show how large players use acquisitions to enter categories where emerging brands have already built consumer recognition.
Keurig Dr. Pepper has strengthened its position in energy and flavored beverages. Ghost contributed 2.9 percentage points to the company’s United States refreshment beverage volume and mix growth in the first quarter of 2025, while national launches extended brands into blackberry, tropical fruit, and zero-sugar offerings. Coca-Cola is responding through zero-sugar products and Simply Pop. Companies with strong distribution can move a new product from limited availability to wide retail coverage more quickly than independent brands.
Challenger brands still have room to compete when they offer a clear benefit, a credible flavor proposition, or access to a specific consumer group. Prebiotic soda, electrolyte hydration, and stevia-sweetened drinks remain areas where smaller companies can build recognition. However, the cost of co-packing, packaging compliance, and national distribution favors companies that can secure partners or investment, while state packaging rules add data, procurement, and administrative requirements. The United States soft drink market is therefore competitive but concentrated around established companies that can buy, distribute, or scale promising brands.
United States Soft Drinks Industry Leaders
-
The Coca-Cola Company
-
PepsiCo, Inc.
-
Keurig Dr Pepper Inc.
-
Nestlé S.A.
-
Monster Beverage Corporation
- *Disclaimer: Major Players sorted in no particular order
Recent Industry Developments
- October 2026: Keurig Dr Pepper brought back its limited-edition 7UP Shirley Temple in Regular and Zero Sugar versions across the United States. The seasonal release reflects continued innovation in nostalgic flavors, occasion-based marketing and reduced-sugar carbonated beverages.
- February 2026: PepsiCo launched Pepsi Prebiotic Cola nationwide in Original Cola and Cherry Vanilla flavors, featuring 3 grams of prebiotic fiber and 5 grams of sugar per 12-ounce can. The launch highlights the integration of functional ingredients into mainstream cola products.
- February 2026: Coca-Cola introduced Coca-Cola Cherry Float and Coca-Cola Zero Sugar Cherry Float, alongside the nationwide return of Diet Coke Cherry. The launches illustrate continued consumer interest in nostalgic flavor combinations, specialty cola variants, and zero-sugar beverages.
- February 2026: Keurig Dr. Pepper announced more than 35 beverage varieties across its refreshment portfolio, including the return of Dr. Pepper Creamy Coconut, Canada Dry Fruit Splash Strawberry, and A&W Root Beer Float. The development supports innovation in fruit-flavored carbonates, seasonal products, and zero-sugar formulations.
United States Soft Drinks Market Report Scope
Soft drinks are non-alcoholic beverages sold in ready-to-consume or prepared forms, including carbonated beverages, juices, ready-to-drink coffee and tea, energy drinks, and sports drinks. The United States Soft Drinks Market is segmented by soft drink category, packaging type, and distribution channel. By soft drink category, the market includes Carbonated Soft Drinks, Juices, RTD Coffee, RTD Tea, Energy Drinks, and Sport Drinks. Carbonated Soft Drinks are further segmented into Standard Cola, Diet Cola, Fruit Flavored Carbonates, and Other Types. Juices are further segmented into 100% Juice, Juice Drinks (up to 24% Juice), Nectars (25-99% Juice), and Juice Concentrates. RTD Coffee is further segmented into Iced Coffee, Cold Brew Coffee, and Other RTD Coffee. RTD Tea is further segmented into Iced Tea, Green Tea, Herbal Tea, and Other RTD Tea. Energy Drinks are further segmented into Traditional Energy Drinks, Sugar-free or Low-calorie Energy Drinks, Natural/Organic Energy Drinks, Energy Shots, and Other Energy Drinks. Sport Drinks are further segmented into Isotonic, Hypertonic, Hypotonic, Electrolyte-Enhanced Water, and Protein-based Sport Drinks. By packaging type, the market is segmented into PET Bottles, Glass Bottles, Metal Cans, Aseptic Packages, and Disposable Cups. By distribution channel, the market is divided into On-Trade and Off-Trade, with Off-Trade further segmented into Supermarket/Hypermarket, Convenience Stores, Specialty Stores, Online Retail, and Other Distribution Channels. The market sizing has been done in value terms in USD and volume terms in liters for all the abovementioned segments.
| Carbonated Soft Drinks | Standard Cola |
| Diet Cola | |
| Fruit Flavored Carbonates | |
| Other Types | |
| Juices | 100% Juice |
| Juice Drinks (up to 24% Juice) | |
| Nectars (25-99% Juice) | |
| Juice concentrates | |
| RTD Coffee | Iced coffee |
| Cold brew coffee | |
| Other RTD Coffee | |
| RTD Tea | Iced tea |
| Green tea | |
| Herbal tea | |
| Other RTD Tea | |
| Energy Drinks | Traditional Energy Drinks |
| Sugar-free or Low-calories Energy Drinks | |
| Natural/Organic Energy Drinks | |
| Energy Shots | |
| Other Energy Drinks | |
| Sport Drinks | Isotonic |
| Hypertonic | |
| Hypotonic | |
| Electrolyte-Enhanced Water | |
| Protein-based Sport Drinks |
| PET Bottles |
| Glass Bottles |
| Metal Can |
| Aseptic packages |
| Disposable Cups |
| On-Trade | |
| Off-Trade | Supermarket/Hypermarket |
| Convenience Stores | |
| Specialty Stores | |
| Online Retail | |
| Other Distribution Channels |
| By Soft Drink Category | Carbonated Soft Drinks | Standard Cola |
| Diet Cola | ||
| Fruit Flavored Carbonates | ||
| Other Types | ||
| Juices | 100% Juice | |
| Juice Drinks (up to 24% Juice) | ||
| Nectars (25-99% Juice) | ||
| Juice concentrates | ||
| RTD Coffee | Iced coffee | |
| Cold brew coffee | ||
| Other RTD Coffee | ||
| RTD Tea | Iced tea | |
| Green tea | ||
| Herbal tea | ||
| Other RTD Tea | ||
| Energy Drinks | Traditional Energy Drinks | |
| Sugar-free or Low-calories Energy Drinks | ||
| Natural/Organic Energy Drinks | ||
| Energy Shots | ||
| Other Energy Drinks | ||
| Sport Drinks | Isotonic | |
| Hypertonic | ||
| Hypotonic | ||
| Electrolyte-Enhanced Water | ||
| Protein-based Sport Drinks | ||
| By Packaging Type | PET Bottles | |
| Glass Bottles | ||
| Metal Can | ||
| Aseptic packages | ||
| Disposable Cups | ||
| By Distribution Channel | On-Trade | |
| Off-Trade | Supermarket/Hypermarket | |
| Convenience Stores | ||
| Specialty Stores | ||
| Online Retail | ||
| Other Distribution Channels | ||
Key Questions Answered in the Report
What is the projected value of the United States soft drink sector by 2032?
It is projected to reach USD 392.40 billion by 2032, growing at a 4.47% CAGR from 2027.
Which soft drink category holds the largest share in the United States?
Carbonated soft drinks lead with a 41.84% share in 2026.
Which beverage category is expected to grow fastest through 2031?
Energy drinks are projected to grow at a 5.73% CAGR during 2026-2031.
Which packaging format leads United States soft drink sales?
PET bottles lead with a 56.35% share in 2026 because they support lightweight, resealable, and high-volume formats.