
United States Property Insurance Market Size and Share
Market Overview
| Study Period | 2020 - 2031 |
|---|---|
| Forecast Data Period | 2026 - 2031 |
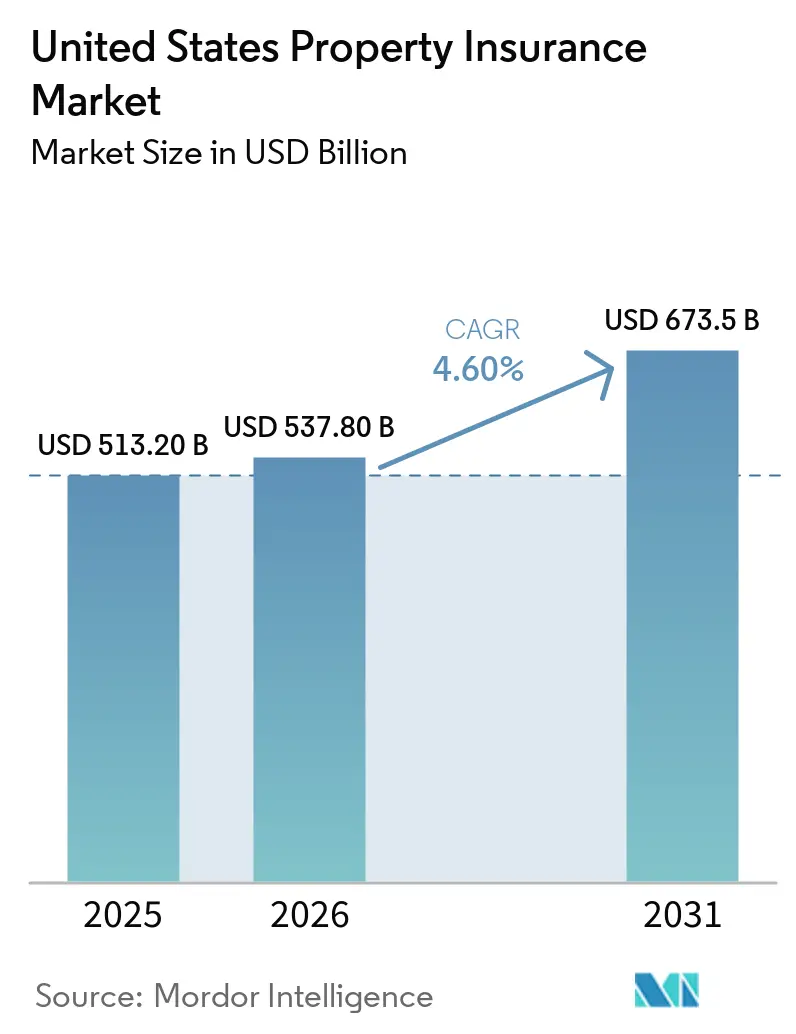
| Base Year Market Size (2025) | USD 513.20 Billion |
| Market Size (2026) | USD 537.80 Billion |
| Market Size (2031) | USD 673.5 Billion |
| Growth Rate (2026 - 2031) | 4.60 % |
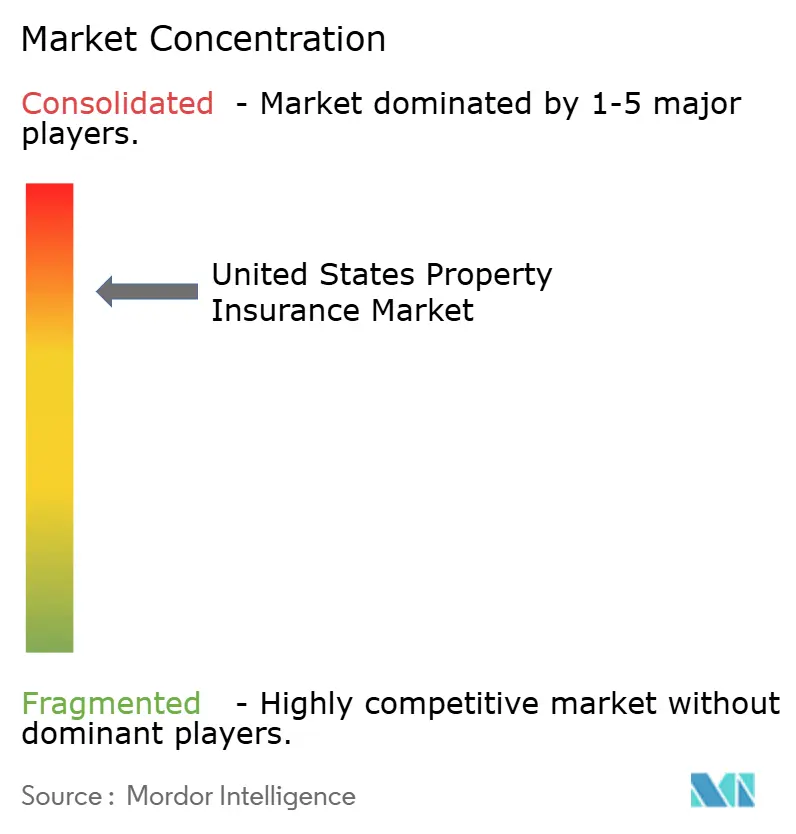
| Market Concentration | High |
Major Players *Disclaimer: Major Players sorted in no particular order Image © Mordor Intelligence. Reuse requires attribution under CC BY 4.0. | |
United States Property Insurance Market Analysis by Mordor Intelligence
The United States Property Insurance Market size is projected to expand from USD 513.20 billion in 2025 and USD 537.80 billion in 2026 to USD 673.5 billion by 2031, registering a CAGR of 4.60% between 2026 and 2031.
Direct premiums written grew 4.6% in 2025, after annual growth of 8% to 10% over the preceding 4 years, which shifted growth toward insured exposure and broader coverage rather than rate increases alone. The homeowners' multiple-peril combined ratio improved to 88.1 in 2025, its strongest result in more than 10 years, supported by the first Atlantic hurricane season without a United States landfall since 2015. The January 2025 Los Angeles wildfires still generated more than USD 22 billion in insured claims and accounted for nearly half of the United States insured catastrophe losses that year. Record reinsurance capital and lower commercial property rates are increasing competition, while catastrophe exposure continues to shape underwriting, geographic capacity, and policy terms. These conditions leave insurers focused on distribution, risk selection, coverage design, and geographic diversification within the United States property insurance market.
Key Report Takeaways
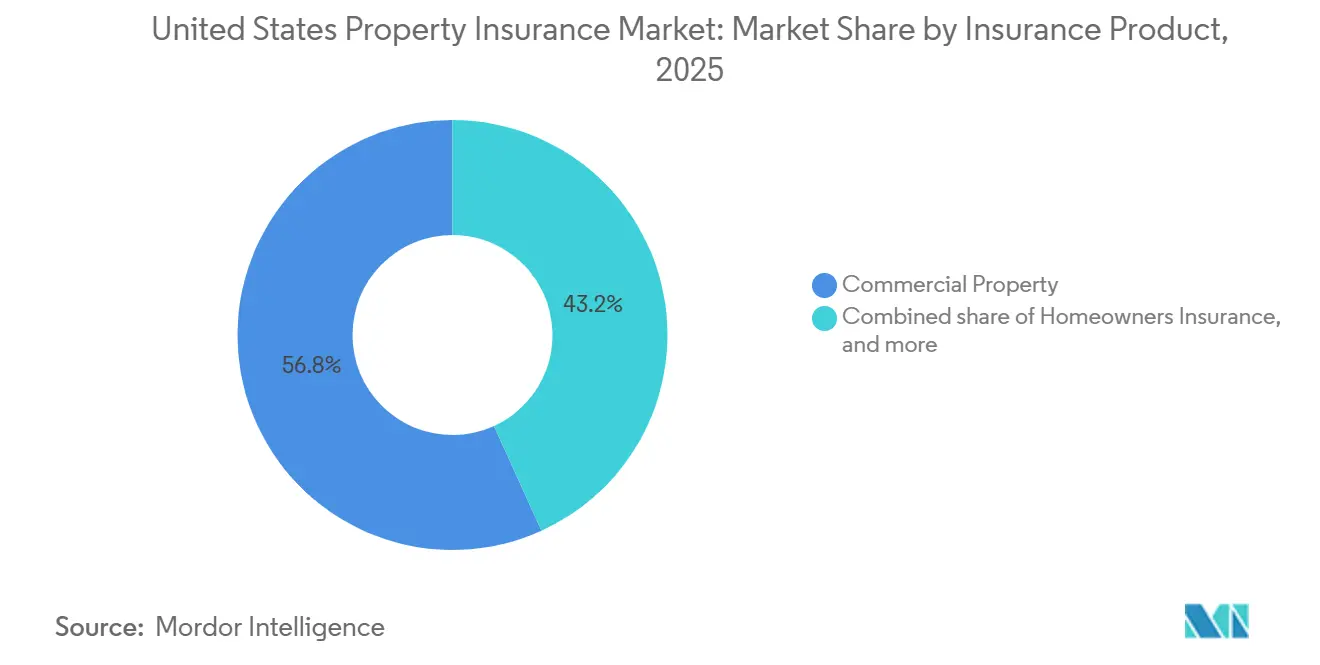
- By insurance product, commercial property captured 56.8% of the United States property insurance market share in 2025, while renters' insurance is projected to grow at 6.9% CAGR through 2031.
- By coverage type, building and structural coverage captured 60.7% of the United States property insurance market share in 2025, while business interruption and loss-of-income coverage is projected to grow at 5.9% CAGR through 2031.
- By property type, residential properties captured 44.2% of the United States property insurance market share in 2025, while industrial and manufacturing properties are projected to grow at 6% CAGR through 2031.
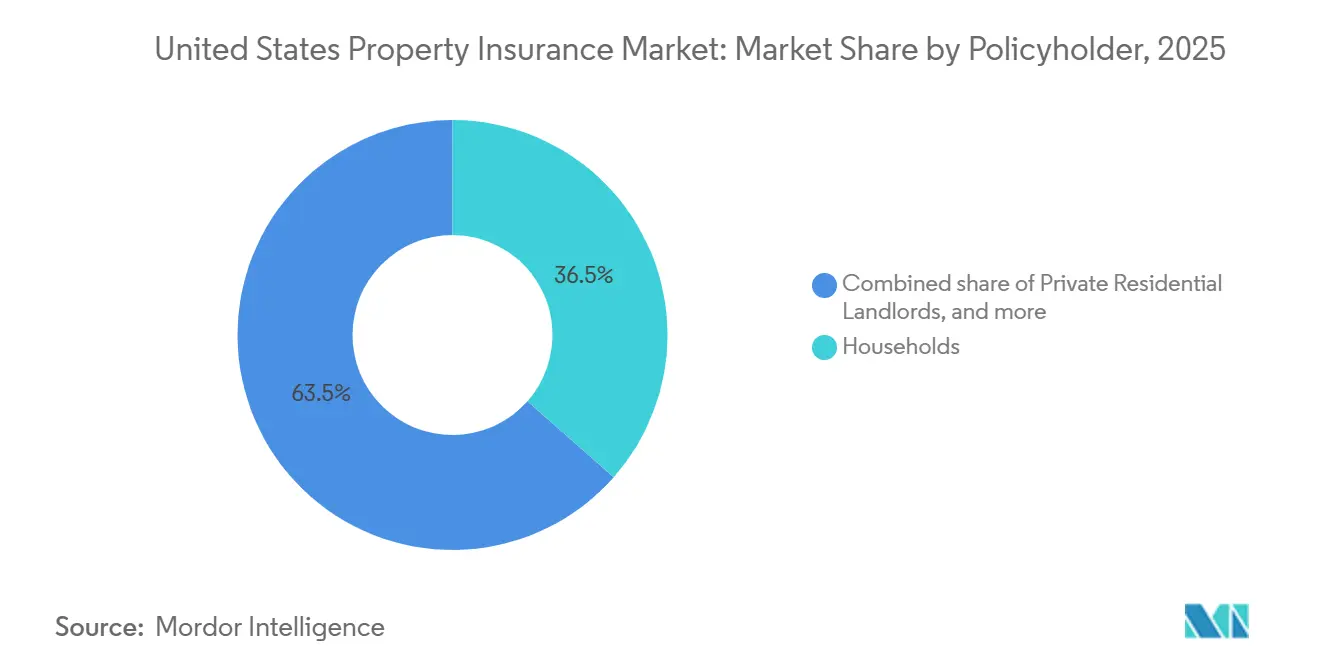
- By policyholder, households captured 36.5% of the United States property insurance market share in 2025, while professional real-estate owners are projected to grow at 6.5% CAGR through 2031.
- By distribution channel, agents and brokers captured 65.7% of the United States property insurance market share in 2025, while embedded and affinity channels are projected to grow at 10.8% CAGR through 2031.
- By geography, the South captured 37.5% of the United States property insurance market share in 2025, while the West is projected to grow at 5.6% CAGR through 2031
Note: Market size and forecast figures in this report are generated using Mordor Intelligence’s proprietary estimation framework, updated with the latest available data and insights as of January 2026.
United States Property Insurance Market Trends and Insights
Drivers Impact Analysis*
| Driver | (~) % Impact on CAGR Forecast | Geographic Relevance | Impact Timeline |
|---|---|---|---|
| Rising Property Values and Replacement-Cost-Based Insured Limits | +1.2% | National, concentrated in high-appreciation metros across the West, South, and Northeast | Short term (≤ 2 years) |
| Mortgage and Lender-Mandated Property Insurance Requirements | +0.5% | National, with early gains in high-volume mortgage markets in the South and West | Short term (≤ 2 years) |
| Growing Wildfire, Hurricane, Severe Convective Storm, and Other Secondary-Peril Exposure | +0.9% | West (wildfire), South (hurricane, flood), Midwest and South (SCS), spill-over to Northeast | Medium term (2–4 years) |
| Expansion of Private Flood and Other Previously Underserved Property Perils | +0.4% | South (FL, TX, LA), Northeast (NJ, NY), with private flood growth nationally | Medium term (2–4 years) |
| Digital Property Insurance Distribution, Underwriting, and Claims Automation | +0.6% | National, with early scale gains in high-density urban and suburban markets | Medium term (2–4 years) |
| Property Resilience Measures and Risk-Based Coverage Adoption | +0.3% | West and South initially, extending nationally as mitigation discounting scales | Long term (≥ 4 years) |
| Source: Mordor Intelligence | |||
Rising Property Values and Replacement-Cost Insured Limits
Reconstruction costs remained elevated through 2025, even as materials inflation eased from earlier levels. Higher replacement costs have continued to increase insured limits and premiums across the United States property insurance market. Stanford University found that average California homeowner premiums increased 84% between the end of 2020 and March 2026, reflecting higher asset values and reconstruction exposure[1]. The Western Zone recorded 107,600 policies per company in 2024, above its 2018 level, indicating that remaining insurers carried larger and higher-value policy books. The difference between adequate replacement-cost limits and nominal insured values continues to create demand for deeper coverage. This supports premium expansion even where policyholder counts remain stable.
Mortgage and Lender-Mandated Property Insurance Requirements
Mortgage requirements provide a stable basis for homeowners' coverage demand in the United States property insurance market. The Federal Housing Finance Agency requires hazard insurance on mortgages backed by government-sponsored enterprises, linking coverage demand to housing finance and property ownership. These requirements reduce the role of discretionary consumer spending in the purchase of standard homeowners coverage. They also create a continuing need for lenders to monitor policy limits and coverage gaps. Flood, earthquake, and excess-liability exclusions can lead borrowers to seek supplemental protection where the lender requirement does not fully address property risk. This pattern is most visible in coastal and wildfire-exposed locations with higher property values and wider protection gaps.
Growing Wildfire, Hurricane, and Severe Convective Storm Exposure
Wildfires, severe convective storms, and inland flooding accounted for 99.9% of North American insured catastrophe losses in 2025. These perils are increasing the need for risk-adequate pricing across the United States property insurance market. The National Association of Insurance Commissioners reported that severe convective storm losses reached USD 50 billion for the third consecutive year in 2025[2]. Higher losses can lead carriers to tighten terms, revise deductibles, and focus capacity on better-managed risks. The Insurance Information Institute reported that more than 35,000 wildfires burned over 3 million acres nationwide during the first half of 2026. Exposure is therefore extending beyond traditional Western concentration areas into states including Florida, Georgia, and Nebraska.
Expansion of Private Flood and Underserved Property Perils
Private flood coverage is expanding the range of risks addressed by the United States property insurance market. Private flood insurers wrote USD 1.24 billion in premiums and had 683,000 policies in force at the end of 2025. The National Flood Insurance Program residential limit of USD 250,000 can leave high-value properties underinsured in flood-prone areas. Neptune Flood surpassed 300,000 policies and USD 400 million in premium in May 2026, showing the scale that private providers can achieve through broad distribution[3]. Property-specific pricing under the Federal Emergency Management Agency’s Risk Rating 2.0 supports a more detailed assessment of flood risk. Lenders may accept qualifying private flood policies in place of National Flood Insurance Program coverage, which reduces a prior barrier to private-market adoption.
Restraints Impact Analysis*
| Restraint | (~) % Impact on CAGR Forecast | Geographic Relevance | Impact Timeline |
|---|---|---|---|
| Catastrophe Loss, Volatility, and Reinsurance-Cost Pressure | -0.9% | South (hurricane, flood), West (wildfire), National (SCS) | Short term (≤ 2 years) |
| Property Insurance Affordability and Coverage Availability Constraints | -0.7% | West (CA, CO), South (FL, TX), and high-risk ZIP codes nationally | Medium term (2–4 years) |
| Claims-Severity Inflation and Repair/Replacement-Cost Pressure | -0.6% | National, concentrated in high-labour-cost metros and wildfire-affected areas | Medium term (2–4 years) |
| State-Level Rate-Filing and Regulatory Constraints | -0.3% | CA, FL, NY, TX, and other states with rate-prior-approval regimes | Long term (≥ 4 years) |
| Source: Mordor Intelligence | |||
Catastrophe Loss Volatility and Reinsurance-Cost Pressure
Catastrophe volatility remains a central constraint on underwriting results in the United States property insurance market. Reinsurance capital reached USD 790 billion in March 2026, supporting favorable pricing for primary insurers in the current soft market cycle. Swiss Re stated that insured catastrophe losses could reach USD 148 billion in 2026 if losses follow the long-term trend. A major event can quickly reduce available capacity and change reinsurance pricing. Allstate reported property catastrophe reinsurance costs of USD 1.23 billion in 2025 and USD 308 million during the first quarter of 2026. These costs show why aggregate protection can remain material even when market capacity is ample.
Property Insurance Affordability and Coverage Availability Constraints
Coverage availability can be a greater concern than price in high-risk parts of the United States property insurance market. California’s excess and surplus homeowners share reached 7.3% in 2025, compared with a 1.1% average between 2016 and 2020. The California FAIR Plan had nearly 700,000 active policies and USD 768 billion in exposure as of June 2026. These mechanisms absorb risks that admitted insurers are unable or unwilling to write. Florida reduced Citizens Property Insurance Corporation’s policy count after legislative reforms and added new private-market capital. However, private capacity may still be constrained in locations with persistent wildfire, wind, flood, or severe-storm exposure.
*Our forecasts treat driver/restraint impacts as directional, not additive. The impact forecasts reflect baseline growth, mix effects, and variable interactions.
Segment Analysis
By Insurance Product: Commercial Coverage Leads While Renters Coverage Expands
Commercial property insurance captured 56.8% of the United States property insurance market share in 2025. Its scale reflects the breadth of commercial real estate, manufacturing, and business interruption exposures that require structured coverage. Commercial property rates declined 10% in the first quarter of 2026, while business interruption values increased 2.5% during the same period. Higher insured values partly offset rate compression for many commercial policyholders. Homeowners and landlord products remained important product categories during 2025. Homeowners' direct premiums written reached USD 188.69 billion, supported by replacement-cost inflation.
Renters insurance is forecast to expand at a 6.9% CAGR through 2031, the strongest product growth rate in the United States property insurance market. The United States had an estimated 44 million renter-occupied households, but only 55% held coverage. This gap creates room for insurers to expand adoption through property managers and digital channels. Chubb completed a renters program rollout to 44 states in May 2026, targeting multi-family operators and managed rental portfolios through embedded, institutional, and digital retail distribution. Embedded distribution can place coverage within lease-signing workflows. That approach can simplify acquisition for renters and property managers.
By Coverage Type: Building Coverage Remains the Core Layer
Building and structural coverage held 60.7% of the United States property insurance market size in 2025. It is the foundational property layer across most personal and commercial policies. Contents and business personal property coverage formed the next coverage tier. Its demand in the United States property insurance market moves with inventory values and the amount of equipment held by insured businesses. Policyholders continue to review their coverage limits as replacement costs and business asset values change. This keeps building, and content protection is central to the United States property insurance market.
Business interruption and loss-of-income coverage is forecast to grow at a 5.9% CAGR through 2031. Supply-chain disruption has encouraged commercial buyers to examine income protection and contingent business interruption limits. A softer commercial pricing environment can allow buyers to redirect savings toward broader protection. Business interruption premiums declined at the start of 2026, creating an opportunity for buyers to consider higher limits. Cyber-linked supply-chain disruptions and active-assailant events are also broadening the risks discussed in commercial coverage planning. The resulting demand is based on coverage scope as well as the value of physical property.
By Property Type: Residential Property Provides the Volume Base
Residential properties accounted for 44.2% of the United States property insurance market size in 2025. Owner-occupied homes and rental housing provide the largest volume base for property insurance policies. Commercial properties followed because office, retail, and multi-family assets require coverage across varied risk profiles. Public and institutional properties remained a smaller but stable category. Agricultural buildings also represented a specialized property category linked to farm activity and asset investment. Each category requires underwriting that reflects the property’s construction, location, and use.
Industrial and manufacturing properties are projected to grow at a 6% CAGR through 2031. Manufacturing nearshoring and investment in distribution, data-center, and clean-energy assets are increasing the insured value of industrial facilities. The Infrastructure Investment and Jobs Act and the Inflation Reduction Act supported domestic industrial capital formation. Fire protection standards and underwriting requirements remain important for industrial placements. Insurers are applying geospatial information and property attributes to improve risk assessment for complex facilities. These practices support more specific pricing for the growing industrial property base.
By Policyholder: Households Lead While Professional Owners Grow Faster
Households captured 36.5% of the United States property insurance market size in 2025, making them the largest policyholder group. Mortgage requirements and established homeownership distribution support their importance in the United States property insurance market. Private landlords and small and medium-sized enterprise occupiers represent the middle portion of the policyholder base. Independent agents placed 87.7% of commercial lines premiums in 2025, demonstrating the continuing role of intermediaries for commercial placements. Large enterprises may self-insure frequency losses or use captive structures for selected layers. This can narrow the addressable premium for standard insurance products.
Professional real-estate owners are forecast to grow at a 6.5% CAGR through 2031. This group includes real estate investment trusts, institutional landlords, and commercial property developers. Build-to-rent communities, logistics facilities, and data-center campuses require high-limit and tailored protection. Their risk profiles can include more standardized property data and formal mitigation practices. The public sector and state-owned enterprise group remain affected by budget cycles and alternative risk pools. Professional owners, therefore, provide a growth area for insurers able to price larger and more complex property portfolios.
By Distribution Channel: Agents and Brokers Retain a Leading Role
Agents and brokers held 65.7% of the United States property insurance market size in 2025. Their role reflects the complexity of commercial property placement and the need for advice in catastrophe-prone personal lines. The independent agency channel placed 62% of all United States property and casualty premiums in 2025, compared with 61.5% in 2024. It also placed 87.7% of commercial lines premiums. Direct and insurer-owned channels remain relevant for standardized personal risks. Bancassurance channels add a smaller flow through mortgage and deposit relationships.
Embedded and affinity channels are projected to grow at a 10.8% CAGR through 2031. These channels can offer insurance when a consumer completes a lease, joins a platform, or enters another related workflow. Great American launched an embedded renters insurance program in 2026 for distribution through property-management software and affinity groups. The program used application programming interface integration to support conversion at the point of lease. This model can reduce friction in high-volume renters insurance placement. It also increases competition for acquisition within the United States property insurance market.
Geography Analysis
The South held 37.5% of the United States property insurance market share in 2025. The region has high concentrations of property values, population, and catastrophe exposure along the Gulf and Atlantic coasts. Florida domestic property insurers posted a combined ratio of 76.8 in 2025, following the state’s legislative reforms. Citizens Property Insurance Corporation reduced its policy count from 1.4 million in 2023 to 278,000 by July 2026. More than 20 new property and casualty insurers entered Florida after the 2022 and 2023 reforms, with more than USD 850 million in capital. Texas combines Gulf Coast hurricane, North Texas hail and severe convective storm, Hill Country wildfire, and statewide winter-freeze exposures.
The West is forecast to grow at a 5.6% CAGR through 2031, the highest regional rate. More than 2.5 million properties across 10 western states faced moderate-or-higher wildfire risk in 2026, representing nearly USD 1.4 trillion in reconstruction cost value. California’s Sustainable Insurance Strategy is changing the basis for capacity and rate filings. By mid-2026, 6 of the state’s 10 largest home insurance groups had committed to the strategy. Travelers expanded California homeowners' availability in April 2026 and offered mitigation discounts for ember-resistant vents, Class A roofing, and defensible space. California homeowner premiums increased 84% from the end of 2020 to March 2026.
The Northeast and Midwest make up the remaining United States property insurance market size. Both regions in the United States property insurance market face severe convective storms and severe winter weather exposure. The Northeast holds high-value commercial and residential assets in metropolitan corridors. New Jersey and New York have the highest National Flood Insurance Program participation among non-Gulf states. Midwest small commercial property clients experienced double-digit premium increases in the first quarter of 2026, linked to persistent severe convective storms. Agricultural building coverage in the Midwest remains a specialized line where parametric structures are gaining attention. State guarantee funds, National Association of Insurance Commissioners solvency oversight, and independent agencies continue to support local distribution across both regions.
Competitive Landscape
The United States property insurance market is consolidated. The top 10 homeowners' insurers accounted for 55.2% of direct premiums written in 2025. State Farm held 18.69% of homeowners' direct premiums written in 2025, while Allstate Insurance Group held 9.42% and United Services Automobile Association (USAA) held 7.02%. State Farm secured USD 1.5 billion in multi-year catastrophe reinsurance through Merna Re Enterprise II Series 2026-1, which provides coverage through July 2029. The transaction supports its management of multi-peril aggregate losses. Carrier strategies are therefore combining underwriting controls with reinsurance protection.
Digital and embedded models are increasing competition in the United States property insurance market, particularly for renters' insurance. Chubb’s renters program reached 44 states in May 2026 and focuses on institutional housing, managed single-family rental portfolios, and financial institutions. Great American also launched an embedded renters program for property-management software and affinity distribution in 2026. These moves bring coverage closer to the property-management process. Insurers are also using aerial imagery and detailed property information to support parcel-level assessment. EagleView launched its Horizon geospatial intelligence engine in April 2026 for property assessment, loss evaluation, and underwriting workflows. This technology can strengthen underwriting consistency across varied property conditions.
Opportunity remains in catastrophe deductibles, private flood, and hard-to-place aging industrial or multi-family properties. The private flood sector wrote USD 1.24 billion in 2025, while its policy limits and terms can differ from National Flood Insurance Program coverage. Commercial property rates fell 13% in the second quarter of 2026 after an average 10% decline in the first quarter. Buyers can use this period to revisit limits and sub-limits that were reduced during earlier rate increases. National Association of Insurance Commissioners requirements on catastrophe-model transparency continue to shape documentation and pricing approaches. The United States property insurance market remains competitive, where carriers can balance coverage availability, technical pricing, and claims performance.
United States Property Insurance Industry Leaders
-
State Farm Mutual Automobile Insurance Company
-
Allstate Corporation
-
United Services Automobile Association
-
Liberty Mutual Holding Company Inc.
-
Farmers Group, Inc.
- *Disclaimer: Major Players sorted in no particular order
Recent Industry Developments
- June 2026: Neural Earth launched Prometheus, a decision intelligence platform for property and casualty insurers delivering real-time parcel-level geospatial intelligence, including satellite imagery, environmental sensors, and AI models, to support underwriting and risk management decisions from individual properties through national portfolios.
- May 2026: Neptune Flood, the largest United States private flood insurer, surpassed 300,000 policies in force and USD 400 million in total premium, marking a milestone for the private market’s capacity to complement and partially substitute National Flood Insurance Program coverage.
- April 2026: EagleView launched EagleView Horizon, an agentic geospatial intelligence engine using more than 25 years of aerial imagery across nearly every United States property, enabling agent-to-agent AI integration for property assessment, insurance loss evaluation, and underwriting workflows.
- April 2026: Travelers Companies expanded California homeowners insurance availability under the Sustainable Insurance Strategy framework, offering mitigation discounts for ember-resistant vents, Class A roofing, and defensible space.
United States Property Insurance Market Report Scope
| Homeowners Insurance |
| Renters Insurance |
| Landlord Insurance |
| Commercial Property Insurance |
| Building / Structural Property Coverage |
| Contents / Business Personal Property Coverage |
| Business Interruption / Loss of Income Coverage |
| Residential Properties |
| Commercial Properties |
| Industrial / Manufacturing |
| Public and Institutional |
| Agricultural Buildings |
| Households (Owner-Occupiers and Tenants) |
| Private Residential Landlords |
| Small and Medium-Sized Enterprise (SME) Occupiers |
| Large Enterprise Occupiers |
| Professional Real-Estate Owners |
| Public Sector / SOE |
| Agents & Brokers |
| Direct / Insurer-Owned Channels |
| Bancassurance & Other Financial Institutions Channels |
| Embedded / Affinity |
| Northeast |
| Midwest |
| South |
| West |
| By Insurance Product | Homeowners Insurance |
| Renters Insurance | |
| Landlord Insurance | |
| Commercial Property Insurance | |
| By Coverage Type | Building / Structural Property Coverage |
| Contents / Business Personal Property Coverage | |
| Business Interruption / Loss of Income Coverage | |
| By Property Type | Residential Properties |
| Commercial Properties | |
| Industrial / Manufacturing | |
| Public and Institutional | |
| Agricultural Buildings | |
| By Policyholder | Households (Owner-Occupiers and Tenants) |
| Private Residential Landlords | |
| Small and Medium-Sized Enterprise (SME) Occupiers | |
| Large Enterprise Occupiers | |
| Professional Real-Estate Owners | |
| Public Sector / SOE | |
| By Distribution Channel | Agents & Brokers |
| Direct / Insurer-Owned Channels | |
| Bancassurance & Other Financial Institutions Channels | |
| Embedded / Affinity | |
| By Geography | Northeast |
| Midwest | |
| South | |
| West |
Key Questions Answered in the Report
What is the forecast growth rate for United States property insurance?
The sector is forecast to grow at a 4.6% CAGR from 2026 to 2031, reaching USD 673.5 billion by 2031.
Which product is growing fastest through 2031?
Renters insurance is projected to grow at a 6.9% CAGR, supported by coverage gaps among renter-occupied households.
What is driving United States property insurance growth?
Higher replacement costs, mortgage-related insurance requirements, catastrophe exposure, and private flood coverage are supporting premium demand.
Which region has the largest share of property insurance premiums?
The South held 37.5% of premiums in 2025, supported by population, property values, and catastrophe exposure.
Which region is forecast to grow fastest?
The West is forecast to expand at a 5.6% CAGR through 2031 as wildfire risk is repriced.
Who leads homeowners insurance by direct premiums written?
State Farm led with 18.69% in 2025, followed by Allstate at 9.42% and USAA at 7.02%.