
United States K-12 Edtech Market Size and Share
Market Overview
| Study Period | 2022 - 2032 |
|---|---|
| Forecast Data Period | 2027 - 2032 |
| Base Year Market Size (2026) | USD 31.24 Billion |
| Market Size (2027) | USD 34.12 Billion |
| Market Size (2032) | USD 53.08 Billion |
| Growth Rate (2027 - 2032) | 9.24 % |
| Market Concentration | Low |
Major Players *Disclaimer: Major Players sorted in no particular order Image © Mordor Intelligence. Reuse requires attribution under CC BY 4.0. | |
United States K-12 Edtech Market Analysis by Mordor Intelligence
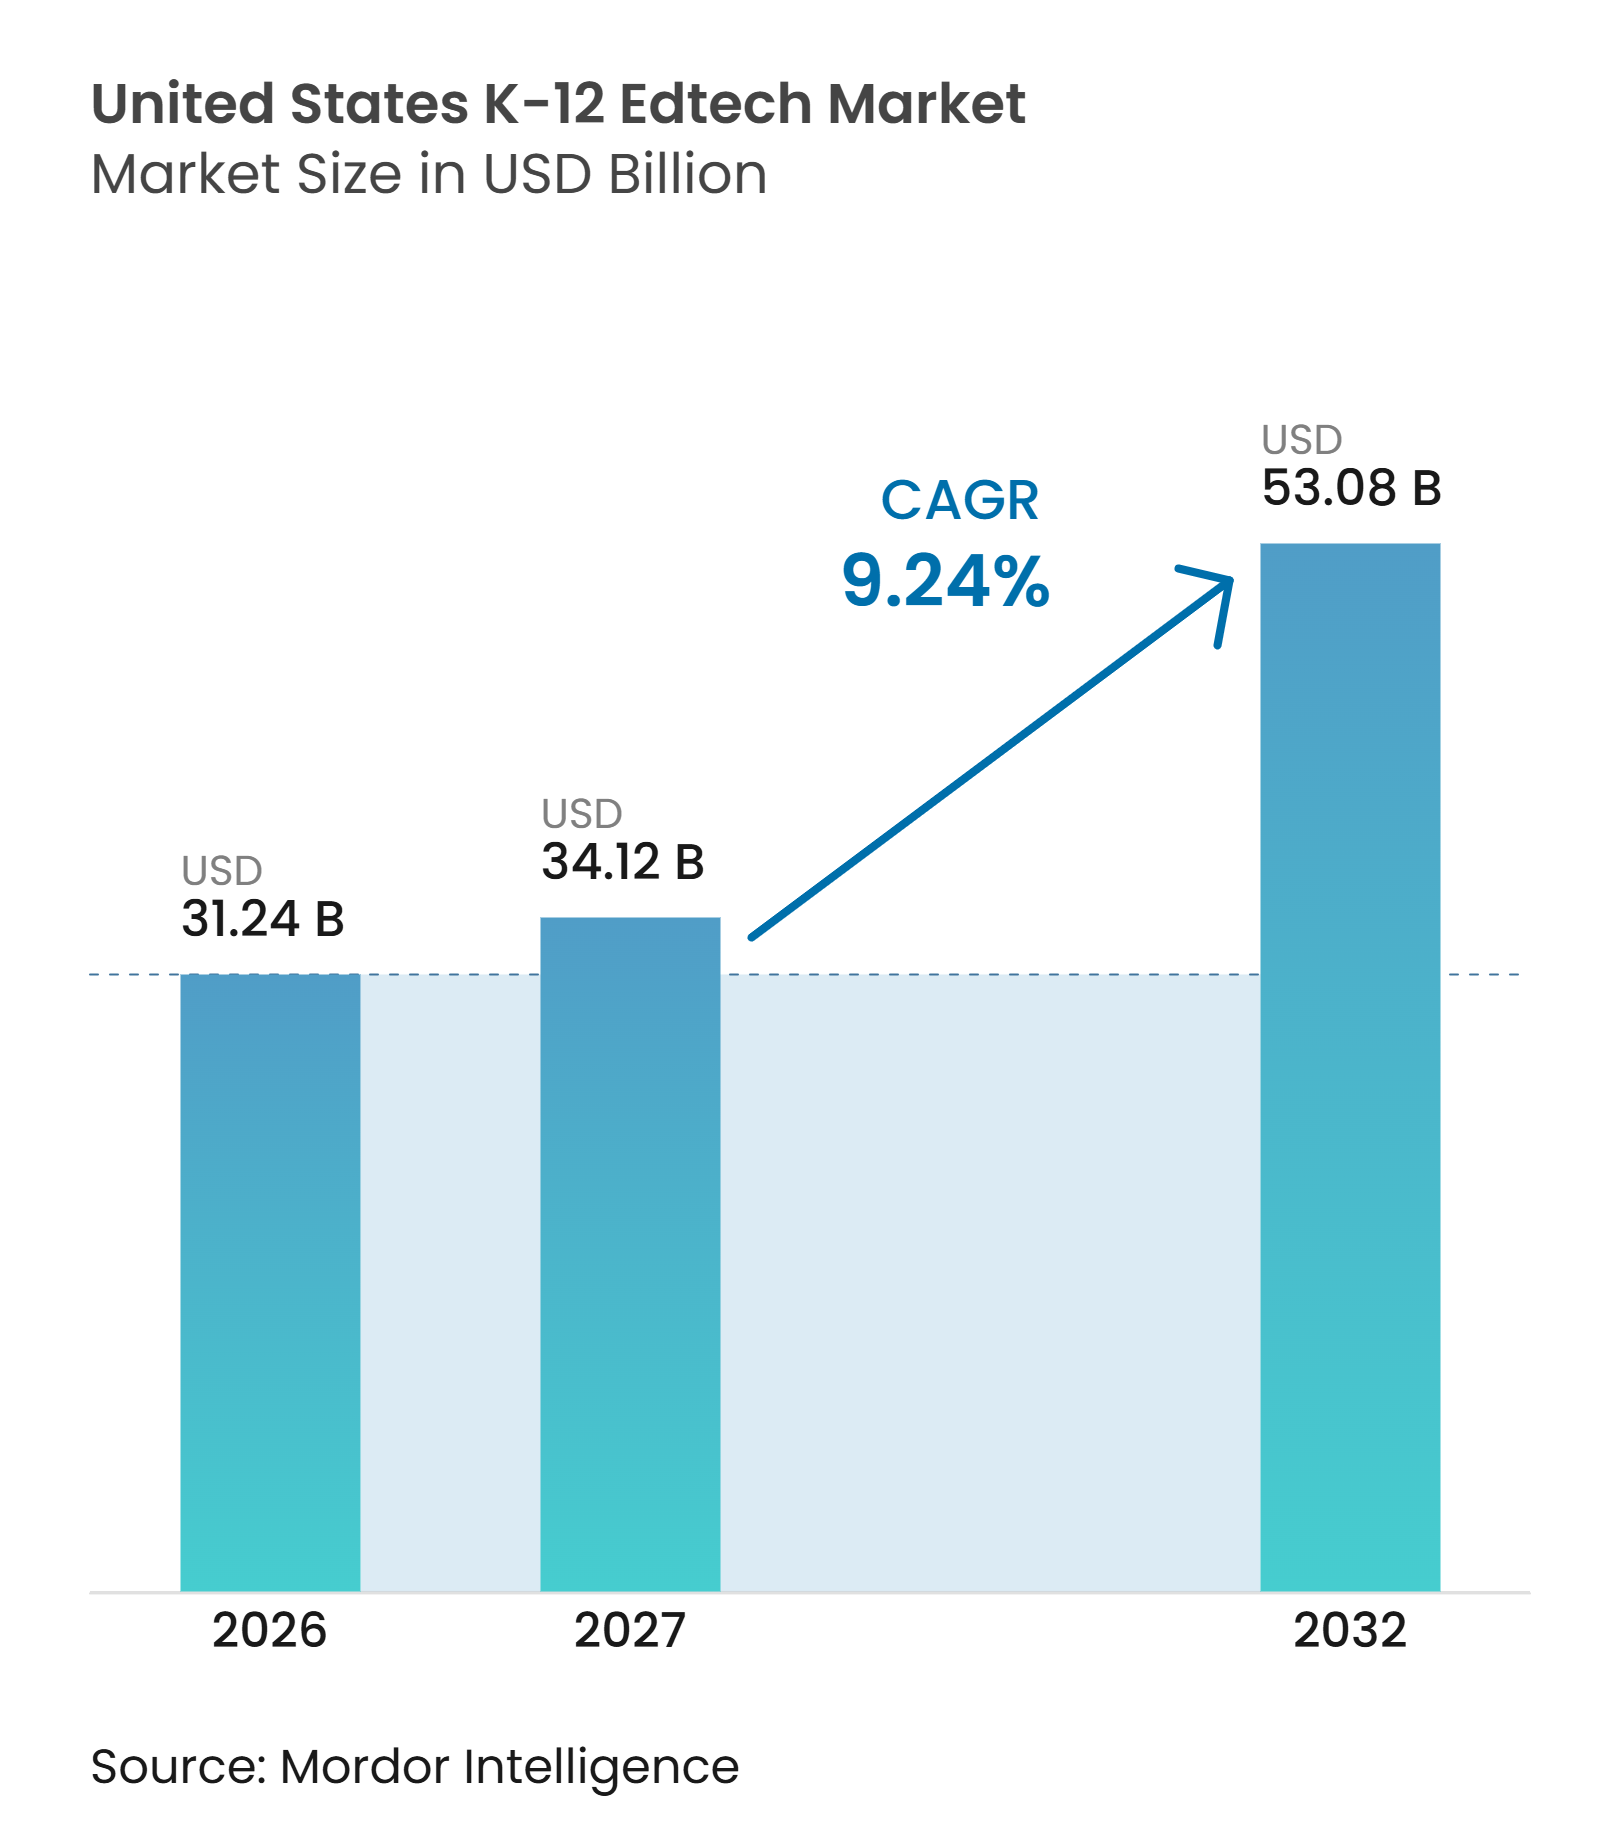
The United States K-12 EdTech market size was valued at USD 31.24 billion in 2026 and is estimated to grow from USD 34.12 billion in 2027 to reach USD 53.08 billion by 2032, at a CAGR of 9.24% during the forecast period (2027-2032). The United States K-12 EdTech market is shifting from emergency purchases to planned procurement that aligns technology spending with instructional outcomes, governance, and operational requirements. State literacy mandates, AI policy development, and the expiration of ESSER funding are reshaping district priorities. Hardware remains important as districts replace devices purchased between 2020 and 2022, while recurring software subscriptions are increasingly embedded in district workflows. The market also faces greater scrutiny of evidence, student data protection, cybersecurity, and interoperability, favoring suppliers that meet district-wide requirements. These conditions create opportunities for integrated platforms but require vendors to demonstrate value within constrained operating budgets.
Key Report Takeaways
- By type, hardware accounted for 39.90% of the United States K-12 EdTech market share in 2026, while software is projected to grow at a 10.90% CAGR through 2032.
- By deployment model, cloud accounted for 65.60% of the United States K-12 EdTech market share in 2026 and is projected to grow at a 12.10% CAGR through 2032.
- By learning mode, in-person technology-enabled learning accounted for 38.70% of the United States K-12 EdTech market share in 2026, while blended and hybrid learning is projected to grow at a 12.50% CAGR through 2032.
- By end-user, business users accounted for 76.60% of the United States K-12 EdTech market share in 2026, while consumer use is projected to grow at a 10.11% CAGR through 2032.
- By geography, the South accounted for 37.30% of the United States K-12 EdTech market share in 2026 and is projected to grow at a 9.71% CAGR through 2032.
Note: Market numbers in this report are based on Mordor Intelligence's proprietary estimation framework, which combines nine months of actuals with Q4 projections for base year 2026.
Market Trends and Insights
Drivers Impact Analysis of United States K-12 Edtech Market*
| Driver | (~) % Impact on CAGR Forecast | Geographic Relevance | Impact Timeline |
|---|---|---|---|
| State-Level Literacy, Mathematics, and Assessment Mandates | +1.8% | National, with high intensity in California, Ohio, Oklahoma, and New Jersey | Medium term (2-4 years) |
| ESSA Evidence Requirements and Accountability-Linked Software Adoption | +1.0% | National, concentrated in Title I districts across the Southeast and Midwest | Medium term (2-4 years) |
| District-Wide AI Adoption for Productivity and Student Support | +2.2% | National, with early gains in Texas, Florida, New York, and large urban districts | Short term (≤ 2 years) |
| Replacement of Pandemic-Era Point Tools With Integrated Platforms | +1.5% | National, strongest in districts with extensive 2020-2022 point-tool procurement | Short term (≤ 2 years) |
| Statewide Data Modernization and Interoperability Procurement | +0.9% | National, with Texas, Michigan, and Delaware as early Ed-Fi adopters | Medium term (2-4 years) |
| AI Governance and Evaluation as a New Software Spend Category | +0.6% | National, emerging fastest in states with AI legislation | Medium term (2-4 years) |
| Source: Mordor Intelligence | |||
State-Level Literacy, Mathematics, and Assessment Mandates
State literacy legislation is driving repeat demand for assessment, intervention, and progress-monitoring tools in the United States K-12 EdTech market. Oklahoma expanded literacy support through the Strong Readers Act and the Amira platform in 2025, translating a statewide policy priority into accessible district-level technology support[1]. For the 2025-2026 school year, Georgia selected Amira Learning as its free, state-approved universal reading screener, reducing district procurement barriers for a required use case. ESSA evidence requirements reinforce this trend because Title I buyers require documented justification when selecting and renewing software. Vendors with strong evidence portfolios can meet accountability requirements more effectively, while suppliers without appropriate evidence face more challenging procurement reviews. These mandates also make literacy, mathematics, and assessment budgets less dependent on short-term discretionary funding than some other technology categories.
District-Wide AI Adoption for Productivity and Student Support
Generative AI has shifted from educator-led experimentation to formal district infrastructure across the United States K-12 EdTech market. In 2025, Consortium for School Networking (CoSN) reported that 80% of surveyed districts were implementing generative AI initiatives, while 94% of EdTech leaders expected AI to positively affect education[2]. Districts generally govern AI through defined use cases rather than prohibit it, as productivity gains and student support remain central to adoption decisions. Miami-Dade County deployed a customized Google Gemini environment for 105,000 high school students in 2025, demonstrating how large districts can implement AI as shared learning infrastructure. The United States K-12 EdTech market is therefore experiencing increased demand for AI governance, professional development, managed AI environments, and classroom applications. This shift supports recurring contracts, as district-level controls extend beyond individual software selections and require ongoing maintenance.
Replacement of Pandemic-Era Point Tools with Integrated Platforms
The United States K-12 EdTech market has consolidated many tools purchased during the pandemic into fewer integrated systems. District technology teams manage application access, data flows, cybersecurity, and training, making disconnected point solutions harder to sustain amid tighter budgets. In August 2025, Renaissance and Savvas integrated Star Assessments with Savvas Realize, linking assessment results with instructional content for shared district customers. In June 2025, McGraw Hill and Pearson agreed to connect Pearson’s assessment capabilities with McGraw Hill’s K-12 programs[3]. These partnerships indicate that workflow integration has become a competitive requirement rather than an optional feature. Integrated platforms can reduce administrative complexity and support more consistent data use; however, districts must still assess vendor fit, implementation requirements, and contractual data protection provisions.
Statewide Data Modernization and Interoperability Procurement
Statewide data modernization supports the United States K-12 EdTech market by making interoperability an explicit procurement requirement. In 2025, 1EdTech and the Ed-Fi Alliance aligned OneRoster with the Ed-Fi Data Standard, enabling districts to use richer rostering and enrollment data without replacing existing systems. Michigan’s MiDataHub initiative reported an annual statewide ROI of USD 36.5 million and nearly USD 700,000 in annual school staff-time savings, demonstrating the operational value of interoperable data systems. Texas has used Ed-Fi-based approaches to support education data management and vendor integration. AI governance creates an additional software requirement, as districts need approved tools, policies, evaluation processes, and student-data safeguards. As state-level guidance evolves, suppliers offering documented interoperability capabilities and governance controls are better positioned to participate in statewide and district-wide procurements.
Restraints Impact Analysis of United States K-12 Edtech Market*
| Restraint | (~) % Impact on CAGR Forecast | Geographic Relevance | Impact Timeline |
|---|---|---|---|
| ESSER Funding Cliff and Recurring-Budget Affordability | -2.1% | National, most acute in Alabama, Delaware, Iowa, Kansas, and Nebraska | Short term (≤ 2 years) |
| State-by-State Privacy, Accessibility, and AI Policy Fragmentation | -0.8% | National, amplified in Ohio, Tennessee, California, and Texas | Medium term (2-4 years) |
| Application Sprawl and Interoperability Debt | -0.6% | National, with higher burden in large urban districts managing 2,000+ tools | Medium term (2-4 years) |
| Cybersecurity Insurance, Incident Disclosure, and Vendor-Risk Burden | -0.5% | National, concentrated in underfunded rural and suburban districts | Long term (≥ 4 years) |
| Source: Mordor Intelligence | |||
ESSER Funding Cliff, Recurring-Budget Affordability, and Application Sprawl
The expiration of Elementary and Secondary School Emergency Relief (ESSER) funding is pressuring subscription renewals and device replacement plans across the United States K-12 EdTech market. State Educational Technology Directors Association (SETDA) reported that only 27% of state education agencies had plans to sustain digital access initiatives previously supported by federal programs[4]. Districts are shifting technology purchases to recurring state and local operating budgets, increasing the importance of local fiscal capacity for sustained spending. Tool sprawl further constrains budgets, as each additional application increases costs for administration, training, integrations, security reviews, and support. CoSN found that many district technology administrators fund cybersecurity through general funds rather than dedicated security budgets. Districts with weaker local revenue bases are more likely to rationalize their technology portfolios, while suppliers must demonstrate direct operational or instructional value to retain contracts.
State Policy Fragmentation, Cybersecurity, and Vendor-Risk Burden
State-level privacy, accessibility, and AI regulations are increasing compliance requirements in the United States K-12 EdTech market. The Education Commission of the States reported that at least 28 states and Washington, D.C., had issued K-12 AI guidance by 2025, requiring vendors to address jurisdiction-specific requirements. Tennessee requires school districts to publish AI-use policies, while Ohio requires public school districts to establish comprehensive AI policies by July 2026. These requirements operate alongside the Family Educational Rights and Privacy Act (FERPA), the Children's Online Privacy Protection Act (COPPA), state student data regulations, and accessibility standards, increasing the cost of selling across multiple states. Cybersecurity adds a further burden, as district buyers assess vendor risk, incident disclosure procedures, and contractual controls before allowing platforms to process student information. Smaller vendors may face longer sales cycles if they cannot provide privacy, security, accessibility, and AI governance documentation.
*Our forecasts treat driver/restraint impacts as directional, not additive. The impact forecasts reflect baseline growth, mix effects, and variable interactions.
Student & Learner Behavior Analysis
The United States public K-12 schools enrolled 49.27 million students in the 2024-2025 academic year, down approximately 246,000 students year over year. NCES projected enrollment to decline by 5% to 46.9 million by 2031. Demographic shifts and changing school preferences contributed to declining enrollment, increasing pressure on districts to justify technology costs across smaller student populations. However, state-level trends varied, and the national decline did not uniformly reduce demand. Vendors offering scalable licenses, flexible pricing, and demonstrable per-student value may be better positioned as districts adapt to changing enrollment levels.
The United States public-school expenditure was estimated at USD 17,840 per student in the 2024–2025 academic year, ranging from USD 32,370 in New York to USD 11,578 in Idaho, according to the National Education Association’s (NEA’s) 2026 Rankings and Estimates. This nearly threefold difference highlighted substantial variation in districts’ purchasing capacity. Higher-spending school systems could accommodate more comprehensive platforms, while lower-spending districts faced greater affordability constraints. These differences created opportunities for tiered pricing and modular subscription models.
Education Performance Intelligence
During the 2024-2025 school year, the United States public school system averaged 15.1 students per teacher. State ratios ranged from 22.3 in Arizona and 22.2 in Nevada to 10.3 in Vermont and 10.8 in New York, according to the National Education Association. Higher ratios may increase the relevance of tools that support differentiated instruction and classroom workload management, although they do not independently determine EdTech demand. Consortium for School Networking (CoSN) reported in 2025 that 94% of district technology leaders viewed AI positively, with productivity identified as its main potential benefit. This creates opportunities for teacher-support tools in areas with constrained staffing, while lower-ratio states may prioritize targeted instruction over workload reduction.
The United States had 99,073 public schools across 19,183 operating public school districts during the 2024-2025 school year, indicating a large but fragmented institutional customer base (National Center for Education Statistics (NCES)). California enrolled approximately 5.81 million students across 10,303 schools, while Texas enrolled approximately 5.5 million students. Both states represent important markets for scalable K-12 platforms. Texas’s more than 1,200 school districts create opportunities for large-system contracts and smaller district-level deployments. This structure increases the importance of state-level procurement frameworks, local implementation partners, and scalable deployment models for EdTech vendors.
United States K-12 Edtech Market Segment Analysis
By Type:
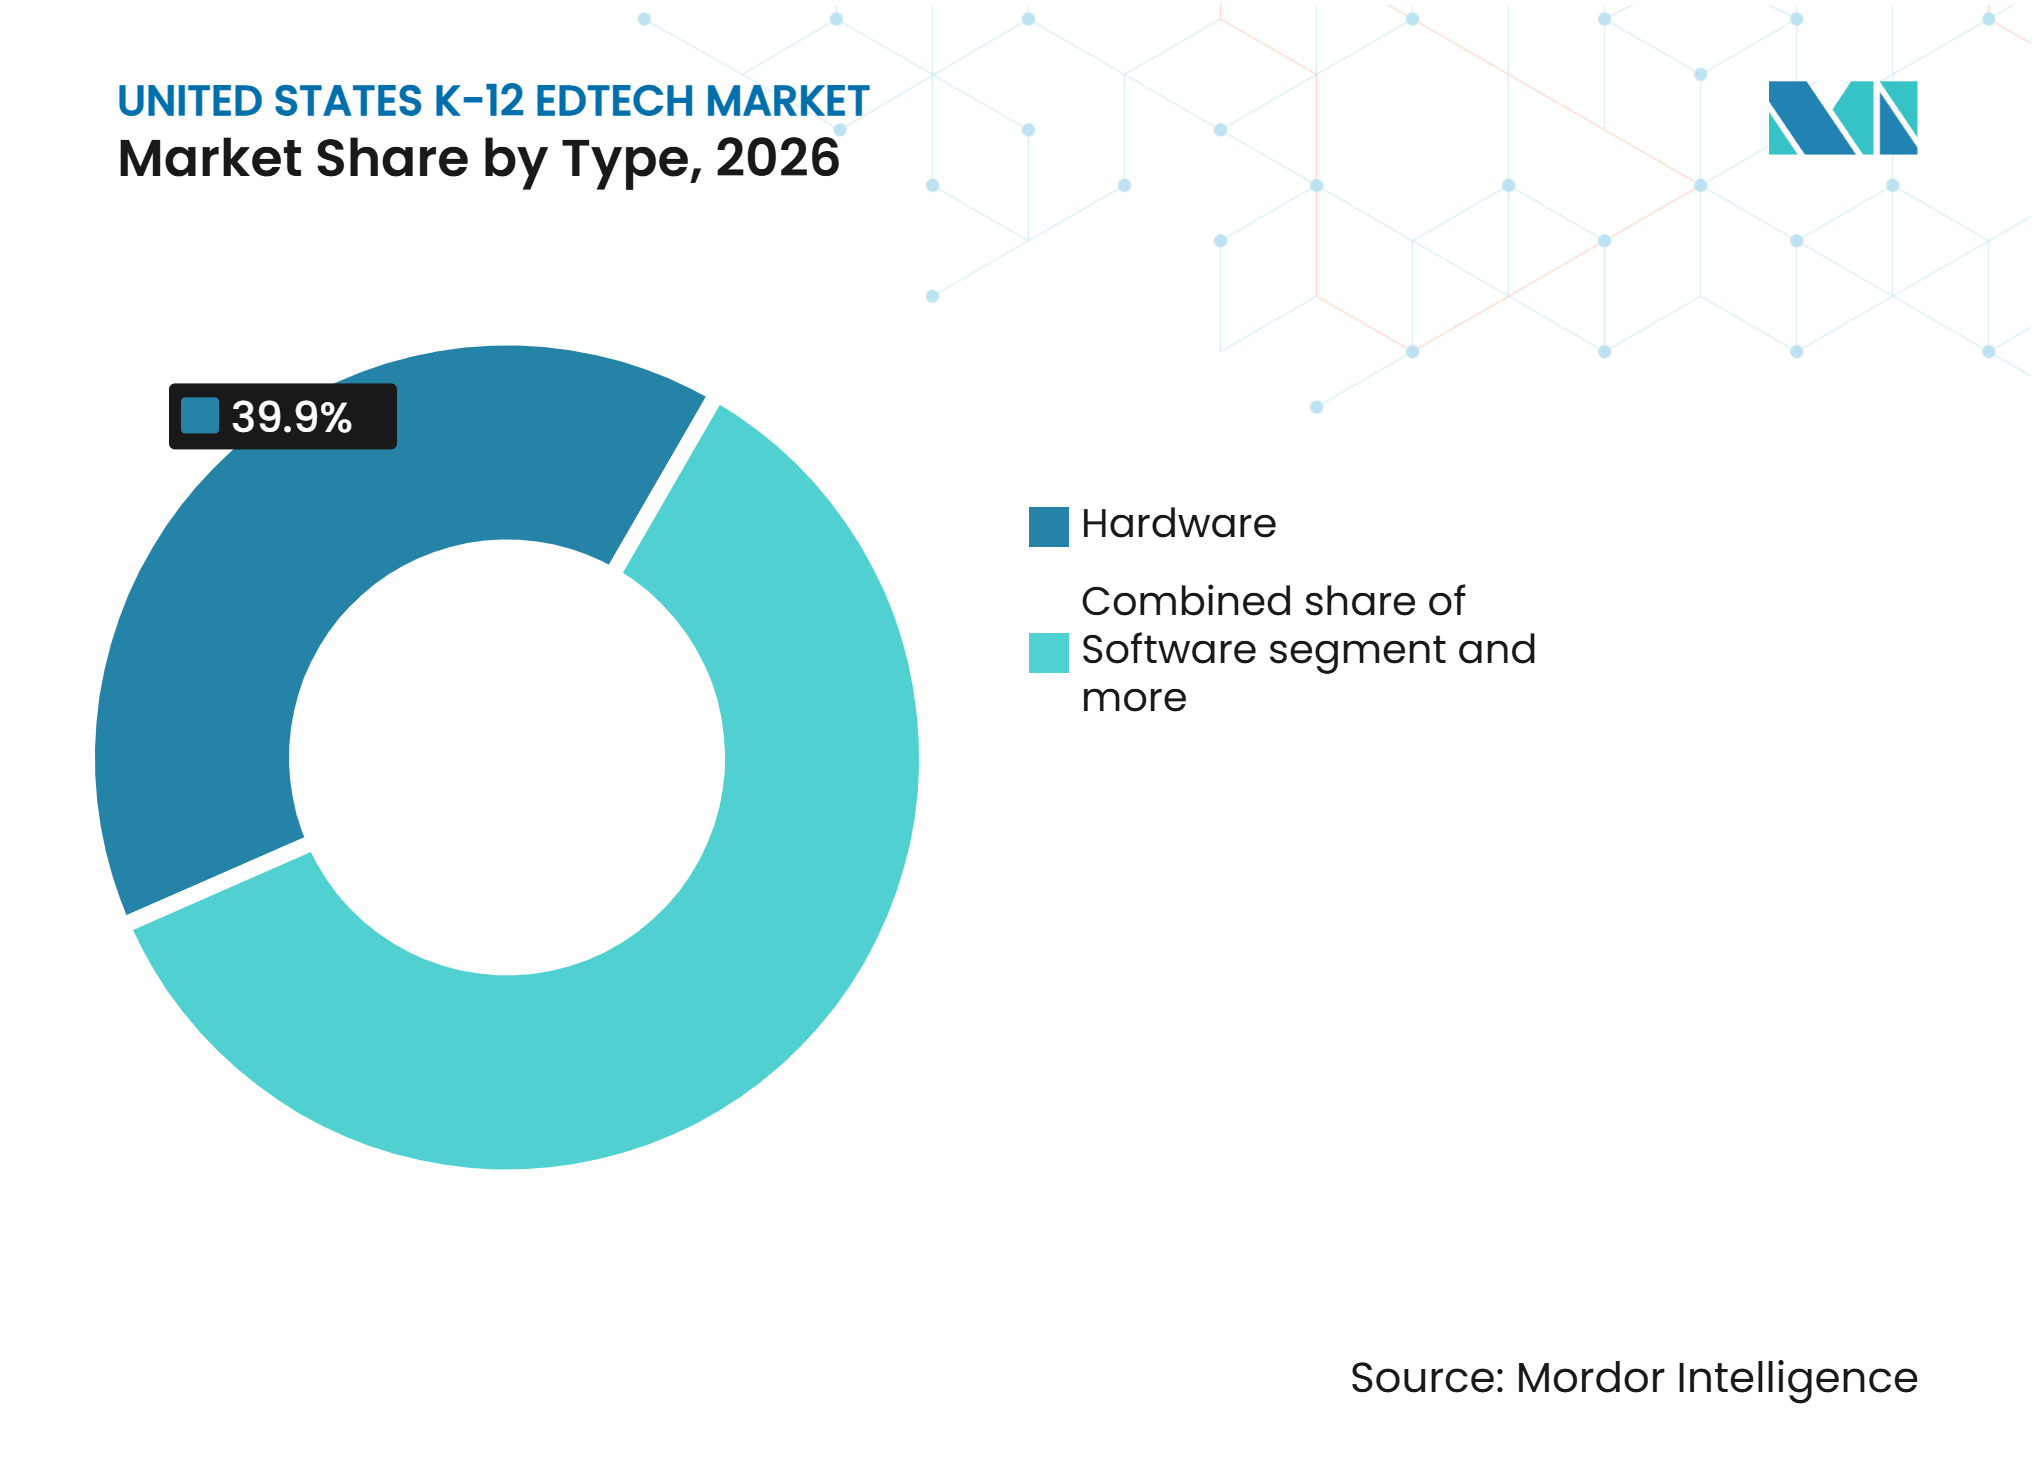
Device Refresh Sustains Hardware Lead, Software Builds FasterHardware accounted for 39.90% of the United States K-12 EdTech market in 2026, while software is projected to grow at a 10.90% CAGR through 2032. Replacement demand for Chromebooks and tablets purchased between 2020 and 2022 supports hardware sales. National Center for Education Statistics (NCES) reported 49.3 million students in United States public schools in 2024-2025, sustaining demand for devices and related support. As emergency funding expires, districts increasingly rely on recurring state and local budgets for laptop and tablet purchases. State literacy policies are also driving curriculum adoption cycles. McGraw Hill introduced Emerge! K-5 English Language Arts (ELA) for district pilots and classroom adoption, supporting demand for science-of-literacy-aligned curricula. Curriculum Associates introduced Magnetic Literacy for the 2026-2027 school year.
Subscription-based Student Information System (SIS), Learning Management System (LMS), assessment, and AI productivity tools support software growth in the United States K-12 EdTech market. Software integrates with instructional and administrative workflows and provides recurring revenue, unlike periodic hardware refreshes. Device purchases are capital-intensive and may be delayed by budget constraints. Curriculum purchases follow state approval calendars and adoption cycles, creating concentrated purchasing windows. Embedding AI capabilities in existing teacher and administrator tools can support software adoption. Suppliers that connect hardware, content, and software through data standards and shared workflows can reduce buyer management burdens.



By Deployment Model:
Cloud Leads and Accelerates as Districts Rationalize InfrastructureCloud accounted for 65.60% of the United States K-12 EdTech segment in 2026 and is forecast to expand at a 12.10% CAGR through 2032. Cloud systems support remote access, centralized updates, and interoperability standards increasingly required in district procurement documents. OneRoster, Learning Tools Interoperability, and Ed-Fi help districts connect data and applications across instructional environments. The 1EdTech and Ed-Fi Alliance collaboration improves data exchange without requiring districts to replace existing infrastructure. Michigan’s MiDataHub experience shows that statewide interoperability can reduce staff time and support return on investment. Cloud adoption also supports consistent management of district-wide AI services, updates, and governance controls.
On-premises systems remain relevant for districts with security preferences, legacy technology, or connectivity constraints. Rural and lower-density areas continue to face home bandwidth limitations, restricting the use of high-bandwidth cloud services and AI applications. Cloud vendors must provide clear data residency, privacy, uptime, and incident-response commitments. Managed cloud services can reduce local administrative work but do not remove district accountability for data governance. Procurement teams evaluate integration quality and compliance evidence alongside feature sets, favoring providers that support interoperability and responsible data management.
By Learning Mode:
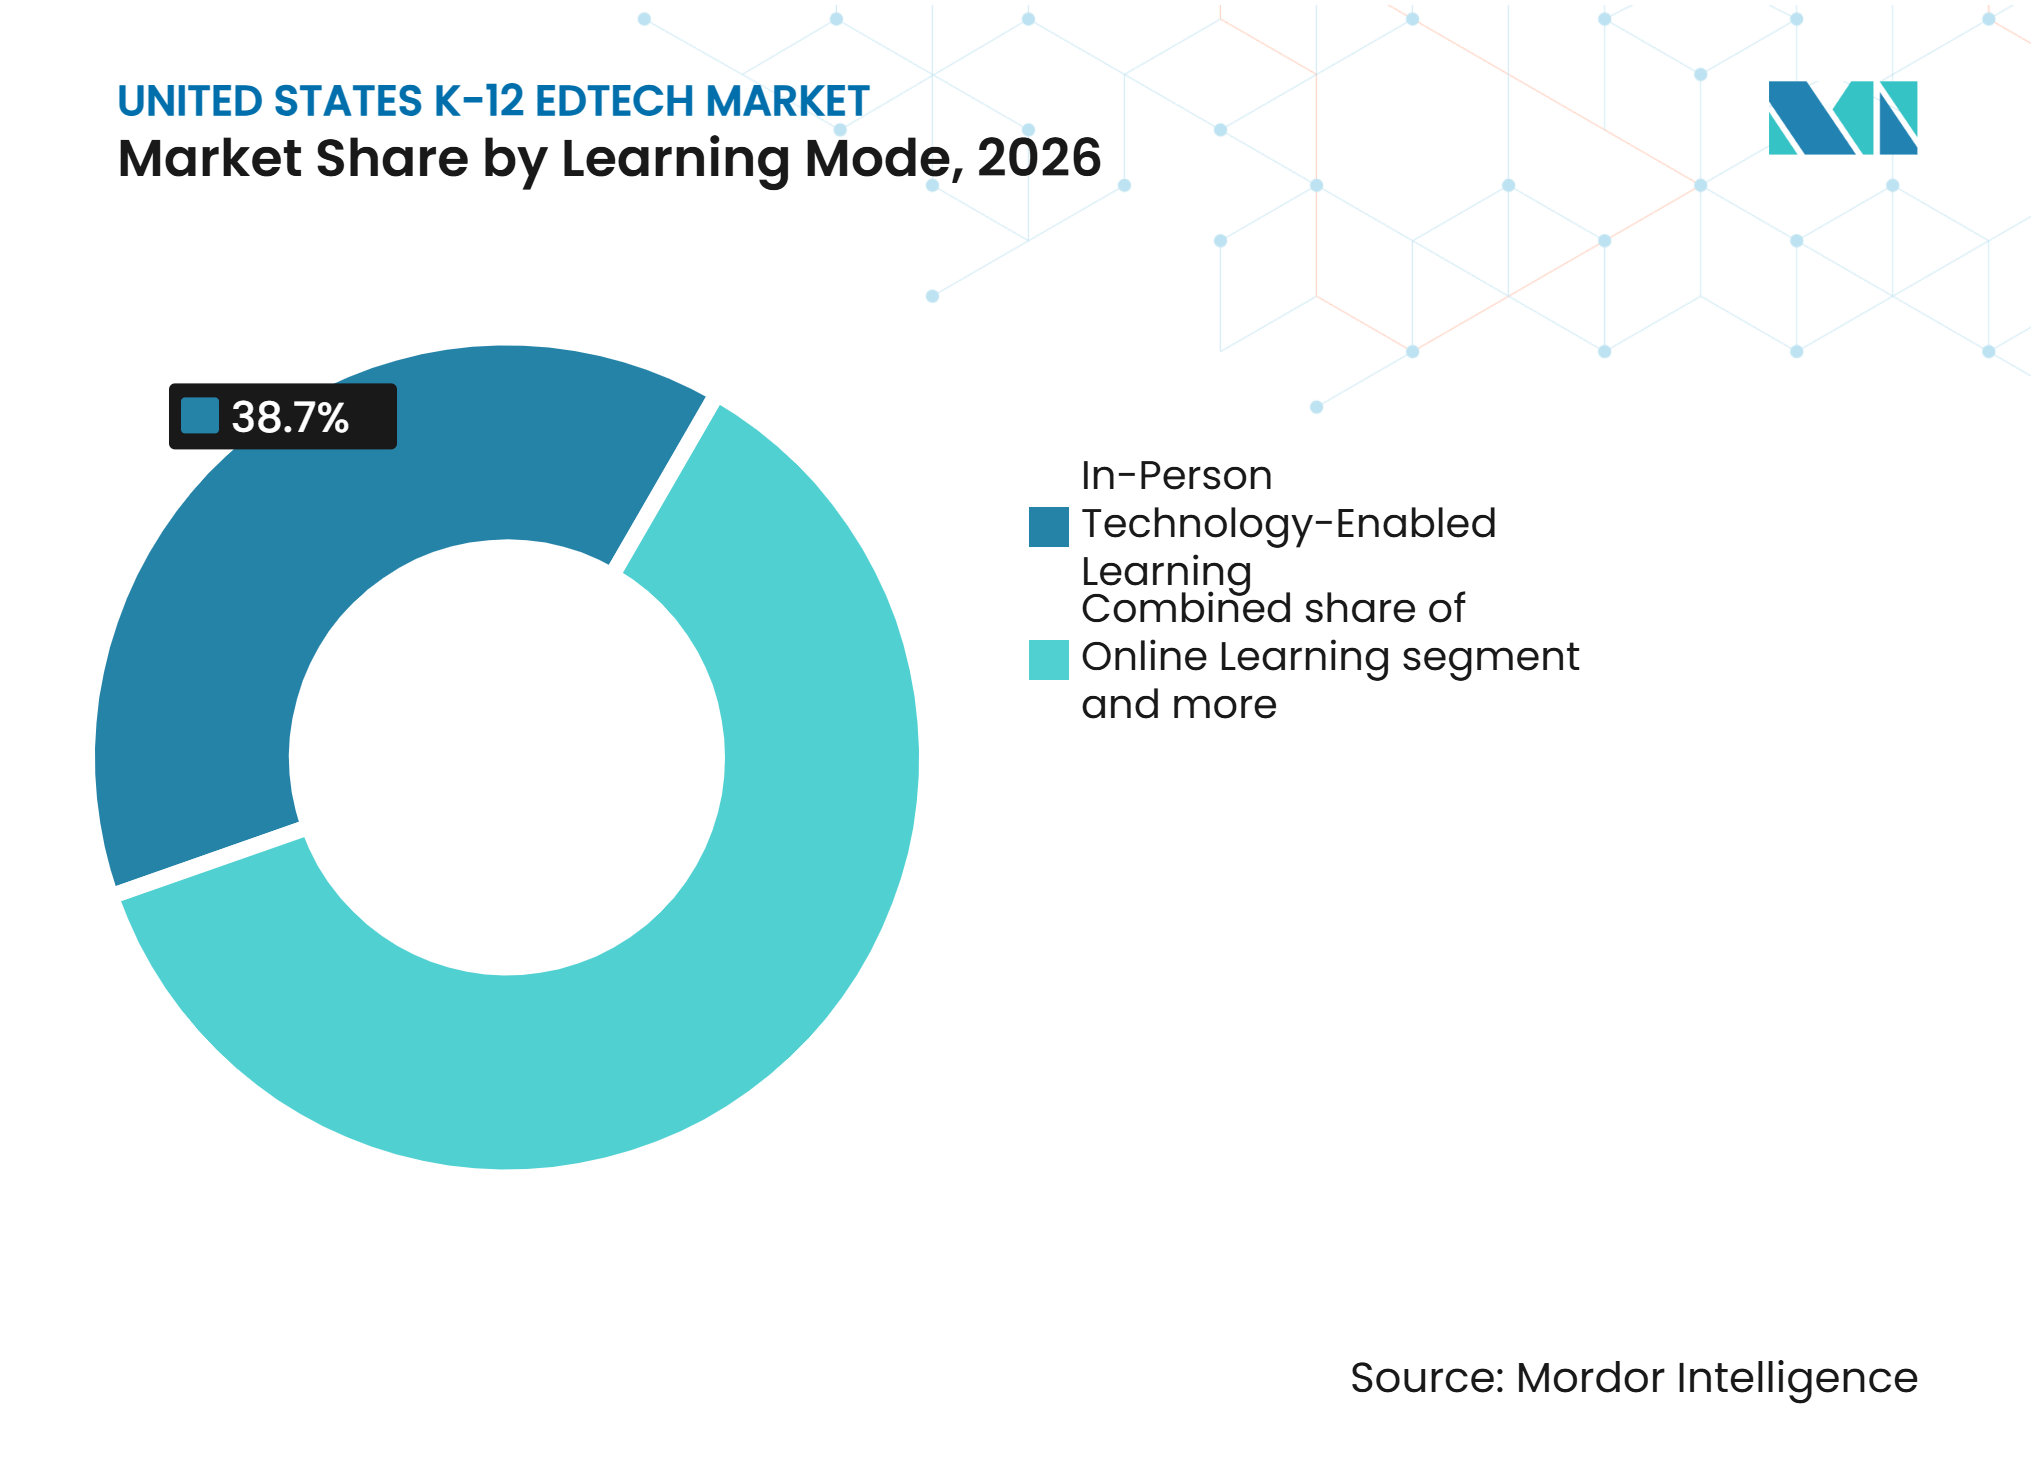
In-Person Technology-Enabled Leads, Blended and Hybrid Grow FastestIn-person technology-enabled learning accounted for 38.70% of the United States K-12 EdTech segment share in 2026. Blended and hybrid learning is projected to grow at a CAGR of 12.50% through 2032. Face-to-face instruction remains a primary delivery model in the United States K-12 education system, supported by the widespread presence of public elementary and secondary schools. Google made Gemini in Classroom available across all Google Workspace for Education editions in June 2025, giving teachers access to more than 30 AI-powered tools. This integration allows teachers to use technology for lesson planning, differentiated grouping, and instructional support without changing school attendance structures.
Blended and hybrid learning is expanding as districts formalize practices adopted during the pandemic. Virtual options, charter school growth, and supplemental digital platforms support districts and families seeking flexibility. Online and self-paced formats serve students requiring alternative schedules or instructional approaches. Demand for flexible content, assessment, communication, and data tools supports the United States K-12 EdTech market size for blended and hybrid learning. Districts must manage attendance, accessibility, and student support across delivery models. Suppliers serving in-person and digital environments can support integrated instructional systems.

By End-User:
District Procurement Dominates, Consumer Use AcceleratesBusiness users, including school districts and institutions, accounted for 76.60% of the United States K-12 EdTech segment in 2026. The consumer segment is projected to grow at a 10.11% CAGR through 2032. Centralized district procurement extends approval cycles but supports multiyear contracts when systems meet instructional, privacy, and governance standards. Every Student Succeeds Act (ESSA) requirements and state vetting processes reinforce district purchasing decisions. Before approving applications at scale, buyers require evidence of effectiveness, integration capabilities, accessibility support, and student data protection. These requirements can delay supplier entry but strengthen renewal conditions for established providers. The business segment remains the core revenue base across SIS, LMS, assessment, curriculum, device, and administrative software categories, reflecting the importance of public-school procurement.
Consumer adoption is expanding through tutoring platforms, homework support tools, AI learning assistants, and supplemental content subscriptions. Teacher-facing AI productivity tools are attracting private investment and may provide a pathway to district contracts. Lower access to school-approved AI tools in lower-income and rural areas highlights an equity challenge. Family-facing communication tools can support institutional adoption when they align with school workflows and multilingual engagement. Consumer adoption can increase supplier visibility among families and teachers before district-level sales. However, uneven household spending capacity does not eliminate the need for equitable school-based access.
Geography Analysis
The South held 37.30% of the United States K-12 EdTech segment in 2026 and is forecast to grow at a 9.71% CAGR through 2032. Texas enrolled 5.54 million students in public schools in 2024-2025, an increase of 13,019 students year over year, sustaining demand for district-level education technology. Houston Independent School District (ISD) launched its AI-focused Future 2 model at nine campuses in 2026-2027 and planned to expand it to 25 campuses in 2027-2028. In May 2026, the Texas Education Exchange partnered with PowerSchool to improve secure data sharing and interoperability across K-12 systems. Meanwhile, Georgia selected Amira Learning as its free, state-approved K-3 universal reading screener for 2025-2026, supporting early literacy assessment without additional district screening costs.
New York’s FY 2024 public-school expenditure was USD 31,918 per pupil, excluding technology subscriptions. A national 4.4% federal public-school revenue decline increased pressure to demonstrate value from recurring technology purchases. New Jersey mandated universal K-3 literacy screening in 2025-2026; Newark approved Amira Learning in June 2025. California enrolled 5.81 million TK-12 students in 2024-2025; AB 1454 strengthened evidence-based literacy, teacher preparation, and instructional-materials support. In the Midwest, Ohio required district AI-use policies by July 1, 2026, and Michigan’s MiDataHub supports statewide interoperability, while rural and underserved connectivity remains important. Procurement should consider effectiveness, accessibility, privacy, and educator involvement.
Competitive Landscape
Market Concentration
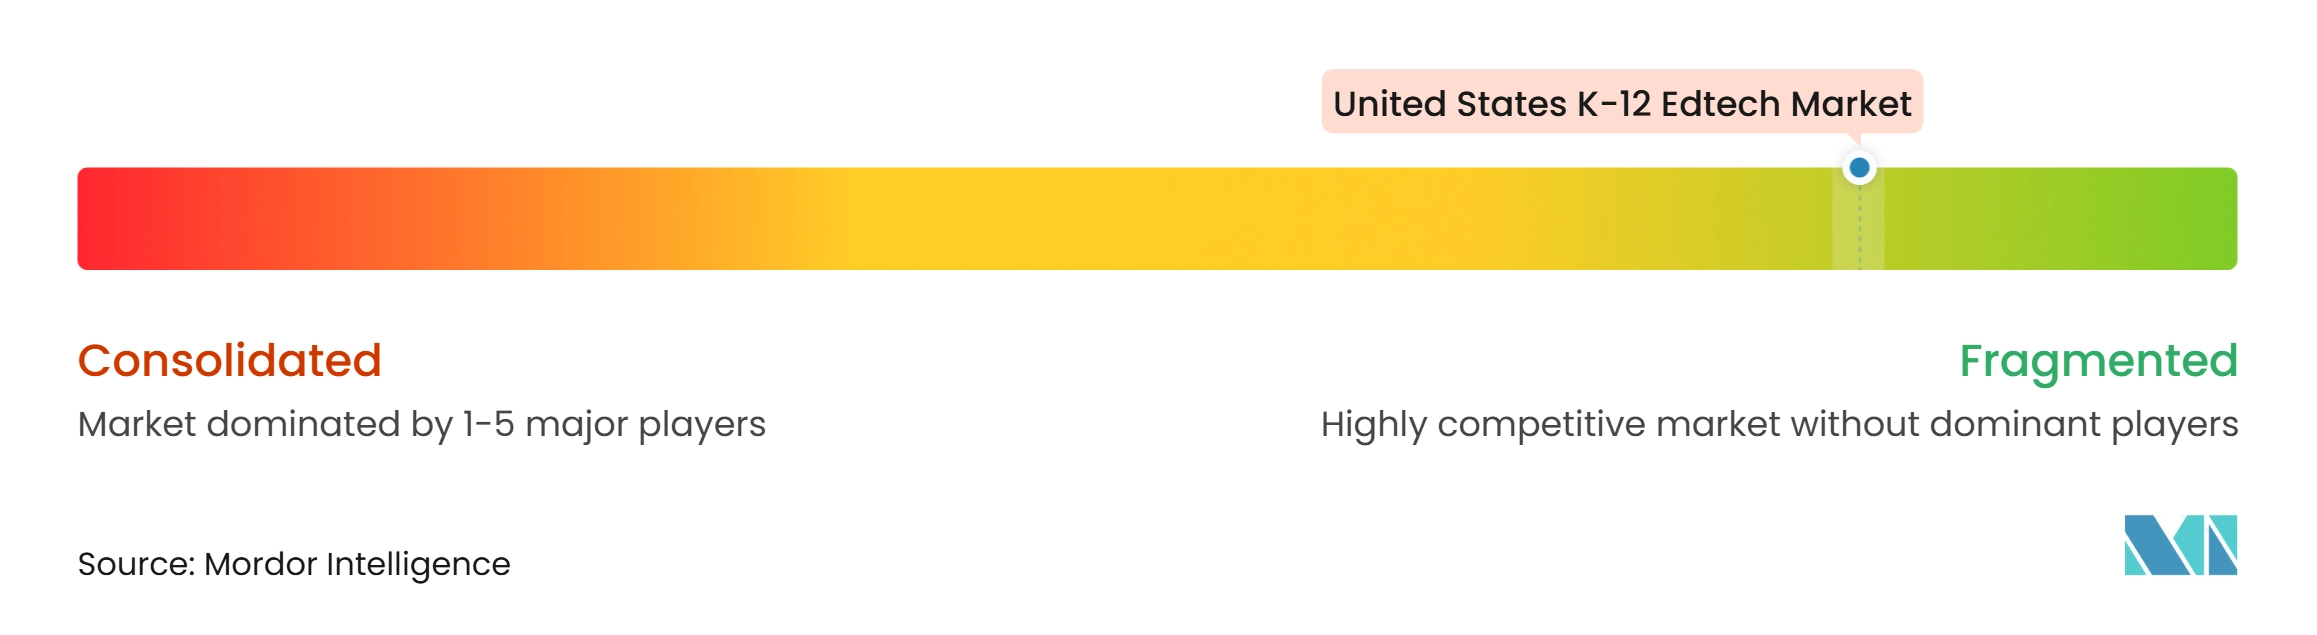
The United States K-12 EdTech market is highly fragmented. PowerSchool, Google, Instructure, Microsoft, and Renaissance collectively account for less than 30% of spending across hardware, software, curriculum, and consumer categories. They serve distinct district workflows, including student information systems, productivity applications, learning management, and assessment. However, district spending remains distributed across numerous products and procurement categories. Private equity acquisitions reshaped ownership in the K-12 education technology market in 2024. Bain Capital completed its USD 5.6 billion acquisition of PowerSchool, while KKR and Dragoneer completed their approximately USD 4.8 billion acquisition of Instructure, taking both companies private. Product integration also intensified competition. In August 2025, Renaissance and Savvas partnered to connect assessment data with curriculum resources, while McGraw Hill and Pearson agreed to integrate Pearson’s interim assessment capabilities into McGraw Hill’s K-12 curriculum. In April 2026, Instructure introduced three Canvas tiers (Core, Plus, and Next) to structure access to the platform and AI capabilities. It also reported that more than 30,000 educators had used its IgniteAI Agent during early adoption. Separately, Seesaw acquired Little Thinking Minds in April 2025 to expand its Arabic-language literacy content and assessment capabilities. These developments highlight competition in integrated instructional workflows, AI-enabled functionality, and multilingual content, while interoperability, implementation costs, data protection, and vendor-consolidation risks remain key considerations for education buyers. AI governance and evaluation also create opportunities for providers supporting procurement audits and compliance documentation. Accessible, multilingual products can address needs not fully served by English-first content.
United States K-12 Edtech Industry Leaders
-
PowerSchool Group LLC
-
Google LLC
-
Instructure, Inc.
-
Microsoft Corporation
-
Renaissance Learning, Inc.
- *Disclaimer: Major Players sorted in no particular order
United States K-12 Edtech Market Companies Covered in this Report
- PowerSchool Group LLC
- Google LLC
- Instructure, Inc.
- Microsoft Corporation
- Renaissance Learning, Inc.
- Curriculum Associates, LLC
- Infinite Campus, Inc.
- Savvas Learning Company LLC
- McGraw Hill Education, Inc.
- Pearson plc
- Imagine Learning, LLC
- Discovery Education, Inc.
- HMH Education Company
- Instructure's Canvas LMS
- D2L Corporation
- Kahoot! ASA
- IXL Learning, Inc.
- Seesaw Learning, Inc.
- ClassDojo, Inc.
- GoGuardian
Recent Industry Developments in United States K-12 Edtech Market
- April 2026: Instructure introduced three Canvas tiers (Core, Plus, and Next), enabling existing customers to transition without migration. More than 30,000 educators used its IgniteAI Agent, indicating early adoption of AI-assisted teaching workflows.
- September 2025: Curriculum Associates launched Magnetic Literacy, a Grades K-6 core reading curriculum integrating foundational skills, knowledge-building, writing, oral language, and critical thinking. Available for adoption for 2026-2027, it expands the company beyond assessment and supplemental instruction into core English Language Arts (ELA), competing with established curriculum providers.
- August 2025: Renaissance and Savvas partnered to integrate Star Assessments on Renaissance Next with core curriculum resources on Savvas Realize, enabling teachers to access assessment data, instructional groupings, and aligned resources for lesson planning and differentiated instruction.
- July 2025: GoGuardian expanded Pear Deck Learning with free AI features for all teachers, spanning lesson planning, classroom instruction, real-time insights, and assessment. The platform’s existing reach was reported to be 8.4 million students.
United States K-12 Edtech Market Report Scope
The United States K-12 EdTech market report analyzes educational technology solutions across hardware, software, content, deployment model, learning mode, end user, and region. It examines key drivers, including state-level literacy and mathematics mandates, ESSA accountability requirements, district-wide AI adoption, integrated learning platforms, and education data modernization, alongside restraints such as reduced ESSER funding, privacy and accessibility regulations, application fragmentation, and cybersecurity risks. The report evaluates education spending, infrastructure development, student–teacher ratios, student enrollment, technology adoption, competitive forces, market size and forecasts, market concentration, strategic developments, market shares, and leading company profiles. It also assesses opportunities in AI governance platforms, multilingual learning solutions, family engagement tools, and integrated digital education systems. Forecasts are provided in USD across all segments and regions.
Segmentation Overview
Key Questions Answered in the Report
What is the forecast for United States K-12 EdTech spending?
The United States K-12 EdTech market was valued at USD 31.24 billion in 2026 and is projected to reach USD 53.08 billion by 2032, growing at a 9.24% CAGR from 2027 to 2032.
Which K-12 EdTech product category is growing fastest in the United States?
Software is projected to grow at a 10.90% CAGR through 2032, ahead of Hardware and Content.
Why are school districts consolidating education technology platforms?
Districts are reducing application sprawl, integration work, cybersecurity exposure, and administrative burden as recurring budgets become tighter.
What is driving AI adoption in United States schools?
Schools are using AI for teacher productivity and student support, with 80% of districts surveyed reporting generative AI initiatives underway or planned in 2025.
Which United States region leads K-12 EdTech adoption?
The South accounted for a 37.30% share in 2026 and is forecast to grow at a 9.71% CAGR through 2032, supported by enrollment growth and state programs.
What are the main risks for K-12 EdTech providers?
The key risks are the end of ESSER support, varying privacy and AI rules, application sprawl, cybersecurity obligations, and uneven district funding capacity.