
Market Overview
| Study Period | 2021 - 2031 |
|---|---|
| Forecast Data Period | 2026 - 2031 |
| Historical Data Period | 2021 - 2024 |
| Market Size (2026) | USD 6.89 Billion |
| Market Size (2031) | USD 8.84 Billion |
| Growth Rate (2026 - 2031) | 5.11 % |
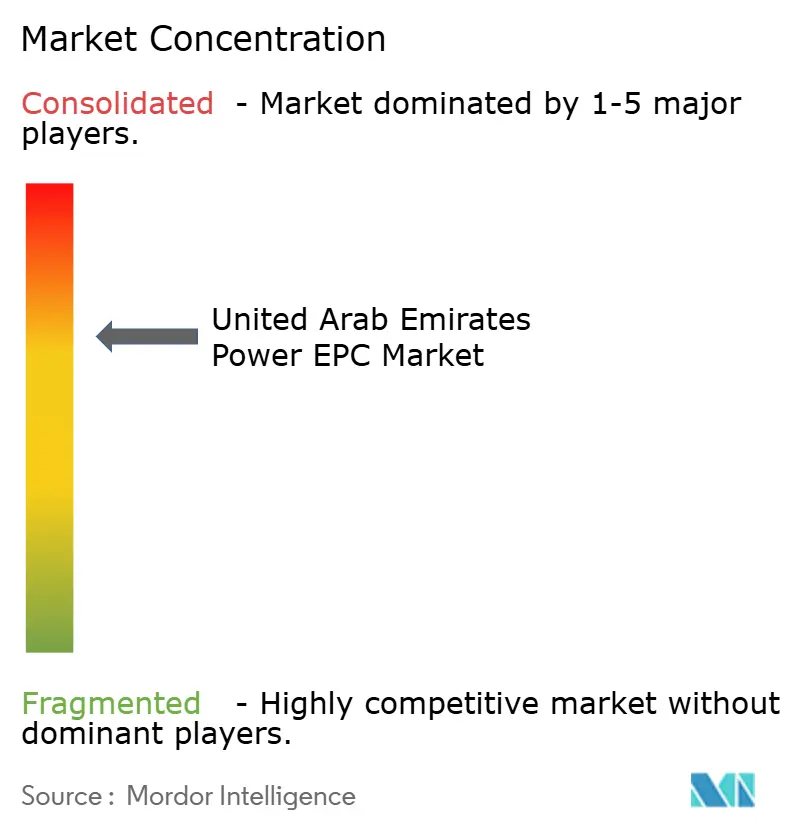
| Market Concentration | Medium |
Major Players *Disclaimer: Major Players sorted in no particular order Image © Mordor Intelligence. Reuse requires attribution under CC BY 4.0. | |
United Arab Emirates Power EPC Market Analysis by Mordor Intelligence
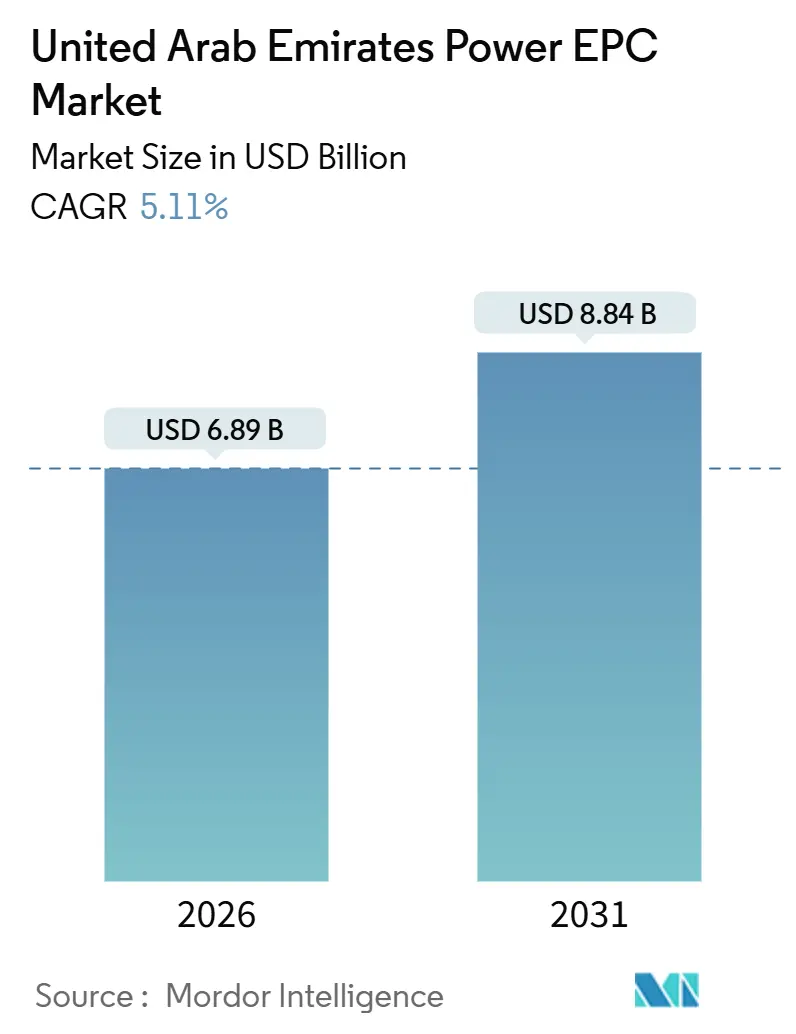
The United Arab Emirates Power EPC Market size is estimated at USD 6.89 billion in 2026, and is expected to reach USD 8.84 billion by 2031, at a CAGR of 5.11% during the forecast period (2026-2031).
Growth is rooted in the completion of the Barakah nuclear program, a deep pipeline of utility-scale solar parks, and steady spending on grid modernization. Capital is flowing toward bundled green-hydrogen schemes, digital-twin-enabled performance contracts, and new public-private-partnership tenders that lower financing costs for sponsors. At the same time, elevated steel and copper prices, as well as an acute shortage of high-voltage specialists, are squeezing contractor margins and lengthening build schedules. International EPCs that pair technology leadership with in-country value creation continue to win the largest bids as local developers prioritize bankability, schedule certainty, and lifecycle performance guarantees.
Key Report Takeaways
- The United Arab Emirates power EPC market is segmented into power generation EPC and power transmission and distribution (T&D) EPC. Power generation EPC accounted for 55.4% of the market in 2025, and is projected to grow at a 5.43% CAGR through 2031.
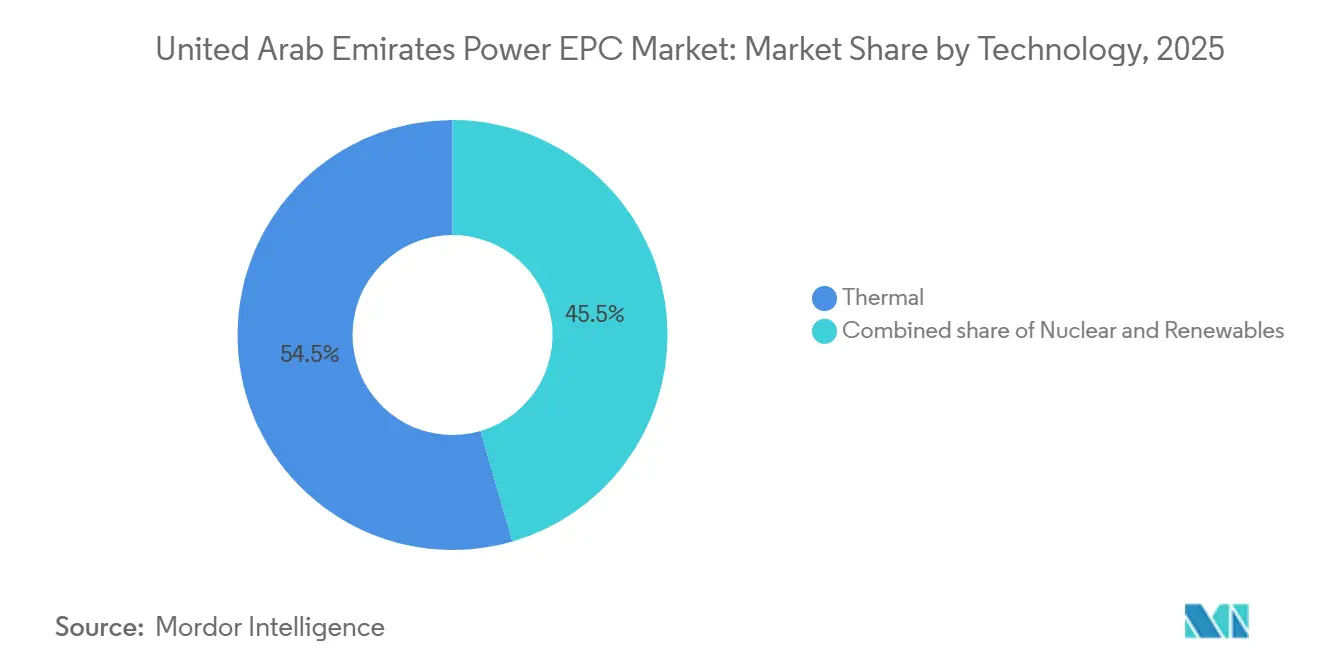
- By technology, thermal generation accounted for 54.5% of the United Arab Emirates' power generation EPC market share in 2025, whereas renewables are growing fastest at a 6.8% CAGR through 2031.
- By capacity band, projects above 500 MW captured 68.7% of the United Arab Emirates power generation EPC market size in 2025; assets up to 100 MW are expanding at a 6.3% CAGR through 2031.
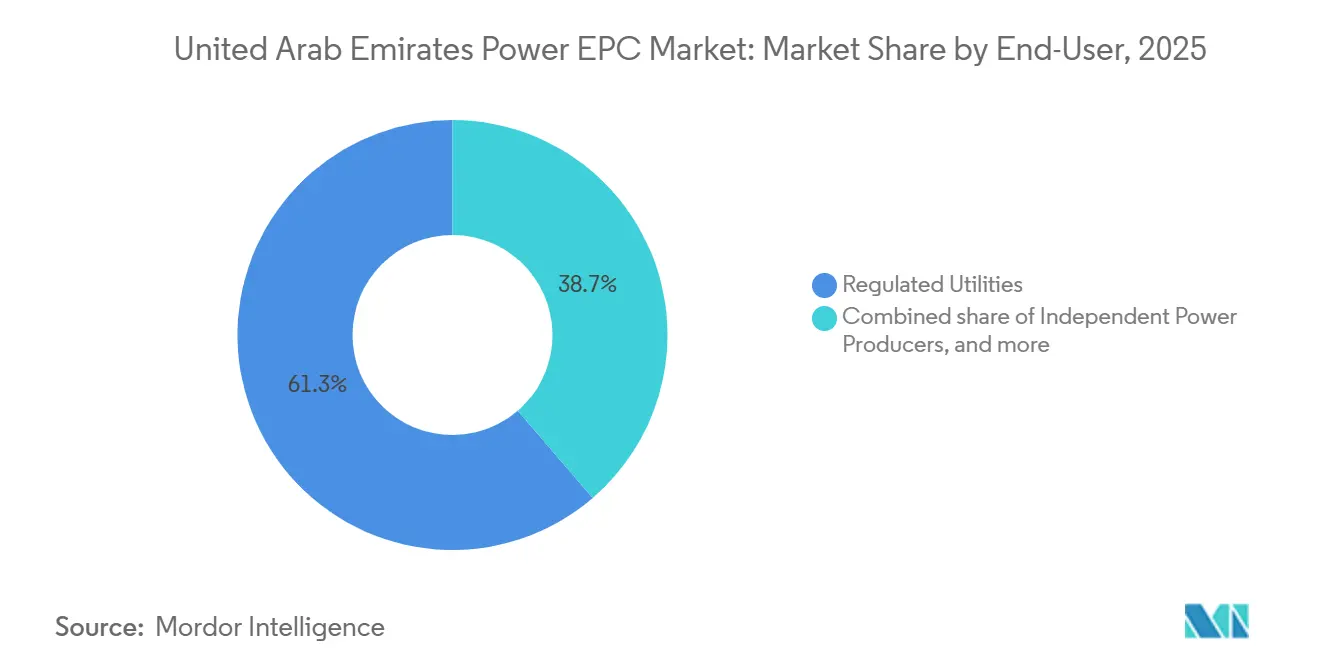
- By end-user, regulated utilities held a 61.3% share of the United Arab Emirates power generation EPC market size in 2025, yet independent power producers record the highest projected CAGR at 6.1% through 2031.
Note: Market size and forecast figures in this report are generated using Mordor Intelligence’s proprietary estimation framework, updated with the latest available data and insights as of January 2026.
United Arab Emirates Power EPC Market Trends and Insights
Drivers Impact Analysis*
| Driver | (~) % Impact on CAGR Forecast | Geographic Relevance | Impact Timeline |
|---|---|---|---|
| Rapid renewable-energy build-out (Clean Energy Strategy 2030) | +1.4% | National, concentrated in Abu Dhabi and Dubai | Medium term (2-4 years) |
| Accelerated T&D upgrades to integrate Barakah nuclear & RES | +1.1% | National, with emphasis on Abu Dhabi transmission corridors | Short term (≤ 2 years) |
| Liberalised PPP / IPP framework attracting EPC capital | +0.9% | National, early gains in Dubai and Northern Emirates | Medium term (2-4 years) |
| Rising electricity demand from industrial clusters | +0.7% | Abu Dhabi (Khalifa Industrial Zone), Dubai (Jebel Ali) | Long term (≥ 4 years) |
| Green-hydrogen mega-projects creating bundled EPC scope | +0.6% | Abu Dhabi (Ruwais, Taweelah), potential Northern Emirates | Long term (≥ 4 years) |
| Digital-twin adoption for performance-guarantee contracts | +0.4% | National, pilot deployments in Abu Dhabi and Dubai | Medium term (2-4 years) |
| Source: Mordor Intelligence | |||
Rapid Renewable-Energy Build-Out (Clean Energy Strategy 2030)
The UAE plans to install 19.8 GW of clean capacity by 2030, channeling AED 150-200 billion into solar and storage projects (moei.gov.ae). Masdar, EDF, and KOWEPO reached financial close on the 1.5 GW Al Ajban Solar Park in September 2024, with commercial operation slated for 3Q 2026.[1]Masdar, “Al Ajban Solar Financial Close,” masdar.ae One month later, Masdar and ENGIE secured the 1.5 GW Khazna Solar plant that combines bifacial modules with single-axis trackers to maximize land productivity.[2]ENGIE, “Khazna Solar Award,” engie.com The 2 GW Al Dhafra PV park entered full service in 2024 at a record USD 0.0135 per kWh, setting a global benchmark for utility-scale solar economics. Large project volumes are forcing contractors to localize: Larsen & Toubro established a module-assembly line in Jebel Ali Free Zone to supply Phase 6 of Mohammed bin Rashid Al Maktoum Solar Park, awarded in January 2024.
Accelerated T&D Upgrades to Integrate Barakah Nuclear & RES
Barakah’s 5.6 GW fleet and rapid solar additions stress lines designed for synchronous thermal units. TRANSCO operates over 16,000 circuit-kilometers and is investing in bidirectional flows, dynamic frequency support, and new HVDC links.[3]Abu Dhabi Transmission & Despatch Company, “Network Expansion Plan,” transco.ae TAQA earmarked AED 36 billion in April 2025, including more than USD 2 billion for substations, automation, and storage to reinforce Abu Dhabi’s grid. DEWA rolled out 200,000 smart meters by mid-2025, cutting peak demand by 3.2% through real-time load management. Abu Dhabi’s Department of Energy added advanced metering at 400,000 customer sites, giving planners granular insights for network expansion. These investments open EPC scope in battery storage, protection upgrades, and grid-forming inverters dominated by Hitachi Energy and Siemens Energy.
Liberalised PPP / IPP Framework Attracting EPC Capital
EWEC’s 2024 procurement reforms uncoupled generation ownership from utility balance sheets, letting private sponsors bid for 20- to 30-year PPAs without holding regulated assets. In April 2025, TAQA and EWEC signed a 24-year agreement for a 1 GW open-cycle gas plant at Al Dhafra, with Samsung C&T and Trojan Construction winning the USD 1.35 billion EPC contract. Ansaldo Energia supplies four turbines for commissioning in May 2027. Bids received in September 2025 for the 2.5 GW Taweelah C combined-cycle project include carbon-capture readiness, foreshadowing future CCUS mandates. The ALTÉRRA climate fund pledged USD 30 billion and targets mobilizing USD 250 billion by 2030 to co-invest in IPP projects, further easing capital access.
Green-Hydrogen Mega-Projects Creating Bundled EPC Scope
ADNOC aims to produce 1 million t per year of green hydrogen by 2030, bundling renewable power, desalination, and electrolyzer procurement into single EPC packages. Masdar and Hassan Allam Utilities launched pilot electrolysis units in Taweelah in 2024 that yield 25 kg daily. Petrofac won a USD 700 million ADNOC contract in April 2025 that adds CCUS, underscoring the multidisciplinary nature of next-generation executions. The program favors diversified EPCs able to integrate power, process, and automation, giving Bechtel and Samsung C&T an edge. Growing demand for large electrolyzers and ammonia conversion units is spurring R&D alliances between Siemens Energy and Mitsubishi Power.
Restraints Impact Analysis*
| Restraint | (~) % Impact on CAGR Forecast | Geographic Relevance | Impact Timeline |
|---|---|---|---|
| Commodity-price volatility inflating project CAPEX | -0.8% | National, affecting all project types | Short term (≤ 2 years) |
| Carbon-pricing / grid-code uncertainty delaying FIDs | -0.5% | National, acute in Abu Dhabi thermal and CCUS projects | Medium term (2-4 years) |
| Shortage of HV & RES-skilled labour inflating timelines | -0.6% | National, acute in Abu Dhabi and Northern Emirates | Medium term (2-4 years) |
| Cooling-water scarcity constraining thermal EPC sites | -0.3% | Coastal thermal plants, primarily Abu Dhabi and Fujairah | Long term (≥ 4 years) |
| Source: Mordor Intelligence | |||
Commodity-Price Volatility Inflating Project CAPEX
Steel and copper prices jumped in 2024 on global logistics bottlenecks, adding 12-18% to EPC capital budgets and pushing two medium-scale gas plants past the final investment decision stage. Lead times for transformers stretched to 18-24 months, squeezing construction schedules and raising interest during construction. Developers now insert price-adjustment clauses tied to commodity indices, which shift risk to utilities that, in turn, request tougher delivery guarantees. Introduction of carbon pricing in 2024 compounds the issue, because unclear allowances discourage international lenders wary of stranded-asset scenarios.[4]Financial Times, “Carbon Pricing Uncertainty Clouds Middle East Power Deals,” ft.com Most contractors hedge only part of their metals exposure, leaving residual cost risk that erodes bid competitiveness.
Shortage of HV and Renewable-Skills Labour Lengthening Timelines
Rapid grid expansions outstrip the supply of engineers trained in high-voltage protection, inverter control, and battery storage. Commissioning has slipped by 3-6 months on complex connections such as Barakah’s synchronizations and large solar parks. Emiratization programs with Siemens Energy and GE Vernova will produce skilled graduates within three years, but near-term gaps force contractors to import talent from Europe and Asia at an 8-12% cost premium. Northern Emirates utilities feel the crunch most because they lack training academies and compete with Abu Dhabi and Dubai for scarce expertise. Project owners increasingly score bids on workforce localization plans, rewarding firms that invest in local training even at higher upfront costs.
*Our forecasts treat driver/restraint impacts as directional, not additive. The impact forecasts reflect baseline growth, mix effects, and variable interactions.
Segment Analysis
By Technology: Thermal Dominance Yields to Renewable Momentum
Thermal assets commanded 54.5% of the United Arab Emirates' power generation EPC market share in 2025, reflecting decades of gas-fired capacity additions. Renewables post the highest 6.8% CAGR through 2031, buoyed by record-low solar tariffs and sovereign decarbonization mandates. The United Arab Emirates' power EPC market size tied to solar construction alone is projected to exceed USD 3 billion by 2031. Gigawatt-scale solar plants like the 2 GW Al Dhafra facility prove that economies of scale lower delivered costs, in turn stimulating fresh IPP tenders.
Thermal EPC remains vital for grid stability. The 1 GW Al Dhafra open-cycle project, awarded in 2025, includes fast-start turbines from Ansaldo Energia and illustrates how peaking assets complement intermittent solar. Future gas plants must be carbon-capture-ready, evident in the 2.5 GW Taweelah C solicitation. Parallel growth of storage pushes contractors to master hybrid layouts that combine power electronics, civil works, and digital control. Firms that integrate turbines, batteries, and advanced analytics under one roof enjoy margin resilience despite commodity cost headwinds.



By Capacity Band: Utility-Scale Projects Anchor Market, DER Gains Traction
Projects above 500 MW represented 68.7% of the United Arab Emirates power generation EPC market size in 2025, underpinned by sovereign-backed solar parks and combined-cycle plants with 20- to 30-year PPAs. The record USD 0.0135 per kWh tariff at Al Dhafra demonstrates how mega-scale lowers finance and procurement costs. Mid-sized 100-499 MW developments cater to industrial complexes and Northern Emirates utilities that prefer modular expansions.
Assets up to 100 MW log the fastest 6.3% CAGR as free zones and commercial campuses deploy rooftop PV, microgrids, and battery storage under Shams Dubai net metering. Advanced metering at 400,000 Abu Dhabi sites enables behind-the-meter solar to interact with the wider grid without compromising reliability. Digital-twin pilots that cut energy use by 30% in healthcare facilities underscore the commercial case for small-scale smart microgrids. Specialist EPCs that offer plug-and-play designs, rapid delivery, and remote O&M support are winning a growing slice of distributed contracts.
By End-User: Regulated Utilities Retain Control, IPPs Accelerate
Regulated utilities held a 61.3% share of the United Arab Emirates power generation EPC market size in 2025, capitalizing on balance-sheet strength to dictate technical standards and secure long-term fuel supply. DEWA alone generated 45.14 TWh in the first three quarters of 2024 and has 16.779 GW installed. TAQA’s AED 36 billion capex plan further cements utility dominance in Abu Dhabi.
Independent power producers expand at a 6.1% CAGR, driven by the post-2024 PPP framework that allows 100% private ownership of generation. Financial close on the 1.5 GW Al Ajban park and award of the 1.5 GW Khazna project highlight investor appetite for long-dated, dollar-linked offtakes. Industrial captive power remains stable as energy-intensive tenants at Khalifa Industrial Zone and Jebel Ali Free Zone hedge tariff risk with on-site generation. The evolving mix challenges EPCs to tailor commercial models: utilities seek the lowest-cost delivery, while IPPs value turnkey O&M and performance guarantees that underpin financing.
Geography Analysis
Abu Dhabi contributes about 58% of the United Arab Emirates' power EPC market value in 2025, anchored by Barakah's 5.6 GW nuclear fleet that now covers up to 25% of national demand. The emirate's AED 36 billion TAQA program allocates USD 2 billion to substations, storage, and AI-enabled dispatch tools, ensuring a strong pipeline for grid EPC work. Al Dhafra's 2 GW solar plant and the 1.5 GW Khazna award reaffirm Abu Dhabi as the nation's renewables hub. Hydrogen ambitions intensify activity: ADNOC's 1 million-ton green-hydrogen target bundles power, electrolysis, and desalination scopes into multibillion-dollar awards.
Dubai holds roughly 32% of the 2025 market value on the back of DEWA's aggressive solar build-out and early smart-meter adoption. Mohammed bin Rashid Al Maktoum Solar Park aims for 5 GW by 2030, with the 1.8 GW Phase 6 under execution by Larsen & Toubro. A network of 200,000 smart meters and the Shams Dubai rooftop program, which counts more than 8,000 participants, underpin rising DER investments.
The Northern Emirates capture the remaining 10% share, featuring incremental upgrades and selective industrial power projects. Fujairah F3's 2,400 MW plant demonstrates appetite for efficient gas technology, yet limited sovereign backing slows large solar investments. Planned GCC interconnection upgrades will, however, lift EPC demand for cross-border lines and flexible substations.
Regulatory Landscape
The UAE power regulatory environment is shaped by federal rules alongside emirate-level regulators and utilities, with licensing, technical codes, and connection approvals handled through a split oversight structure. At the federal level, the Ministry of Energy and Infrastructure (MoEI) sets sector policy, and Federal Decree-Law No. (17) of 2022 establishes a nationwide framework for connecting renewable energy production units to the electrical grid. In Abu Dhabi, the Department of Energy (DoE) regulates the sector under Law No. (2) of 1998 (as amended), with compliance managed through technical codes such as the Metering and Data Exchange Code (MDEC), which governs metering, data, and settlement requirements that affect grid modernization EPC scopes.
In practice, project execution is conditioned by utility-specific requirements and emirate-level bodies, creating different compliance pathways for EPC contractors working across Abu Dhabi, Dubai, and the Northern Emirates. Dubai places utility planning and connection requirements with DEWA, including the Power Supply Guidelines for Major Projects (updated July 2025), which require developers to align master plans and phasing with 400/132 kV and 132/11 kV substation planning. RSB Dubai acts as a key licensing body for electricity generation and water desalination, and it also accredits energy auditors and ESCOs under the UAE ESCO market regulation policy (2023), which strengthens documented compliance and certified processes in bid qualification and energization timelines.
Competitive Landscape
The United Arab Emirates' power EPC market is moderately concentrated, with project development dominated by TAQA, DEWA, and EWEC, while global EPC majors compete on technology and execution. Samsung C&T's USD 1.35 billion Al Dhafra win illustrates the advantage of partnering with local civil players to meet in-country value thresholds. Larsen & Toubro's module plant in Jebel Ali signals rising localization expectations in solar procurement. Siemens Energy, GE Vernova, and Mitsubishi Power leverage turbine upgrades, hybrid solutions, and service agreements to defend installed bases.
White-space opportunities lie in bundled hydrogen facilities and CCUS-ready gas plants. EWEC's Taweelah C tender, the first to require carbon-capture integration, favors firms with process-plant credentials and automation depth. Chinese EPCs, led by China Energy Engineering, bid aggressively on solar packages by coupling low-cost modules with vendor financing, increasing pressure on traditional Western incumbents.
Digital capability is an emerging tiebreaker. Schneider Electric-Microsoft digital twins now feature in performance-guarantee clauses, shifting value from construction to data-driven O&M. Compliance with ISO 9001 and IEC 61215 standards is mandatory in DEWA and EWEC tenders, which bars smaller regional firms lacking certified supply chains and reinforces incumbency for well-capitalized multinationals.
United Arab Emirates Power EPC Industry Leaders
Dubai Electricity & Water Authority (DEWA)
Abu Dhabi National Energy Co. (TAQA)
ACWA Power
Emirates Water & Electricity Co. (EWEC)
Siemens Energy AG
- *Disclaimer: Major Players sorted in no particular order

Market Opportunities and Future Outlook
Utility-scale solar and grid flexibility packages represent a clear opportunity as the UAE steps up renewable integration under the updated UAE Energy Strategy 2050 (July 2023) and the capacity targets referenced in national planning. The resulting EPC demand increasingly bundles PV with substations, and often extends into storage and digital controls, with bankability supported by long-tenor offtake structures in Abu Dhabi and Dubai. A specific market signal is the May 2026 Masdar and EWEC Collaboration Framework Agreement to accelerate deployment of more than 30 GW of solar PV and 8 GW of battery storage by 2035, expanding addressable EPC scope across site civil works, grid interconnection, protection systems, and battery integration.
A second whitespace is integrated power and utilities infrastructure tied to industrial clusters and decarbonization-linked schemes, where power generation EPC, T&D EPC, and process utilities increasingly intersect. Long-term utility service models for industrial zones (electricity, steam, cooling, and water services) broaden multi-discipline EPC demand and reward contractors that can coordinate power systems, automation, and balance-of-plant utilities under unified delivery and performance frameworks. Separately, Abu Dhabi procurement that embeds carbon-capture readiness in new gas assets, including Taweelah C, broadens EPC scope beyond conventional CCGT into plot planning, tie-in readiness, controls, and future integration pathways, while also increasing code compliance, commissioning capability, and lifecycle service requirements.
Recent Industry Developments
- June 2026: Emirates Water and Electricity Company (EWEC) announced partners to develop the Taweelah C Independent Power Producer project, awarding it to a consortium led by TAQA with Aljomaih Energy and Water Company and Sembcorp Industries. The 2.6 GW combined-cycle gas turbine plant is designed to facilitate future carbon capture, expanding EPC scope in high-efficiency generation, grid connection, and CCUS readiness. The award reinforces the role of IPP procurement in Abu Dhabi and keeps large, complex thermal EPC packages active alongside utility-scale solar additions.
- December 2025: DEWA awarded an AED 289 million contract to strengthen Dubai's water transmission network, including installation of 32 km of glass-reinforced epoxy pipelines connected to the Hassyan water plant. The contract adds to critical infrastructure work around major generation and water facilities, supporting reliability upgrades that run in parallel with power-network expansion. It also signals continued capital deployment into utility backbone assets that shape contractor workload planning and resource allocation across power-and-water-linked EPC.
- January 2024: Larsen & Toubro was selected as the turnkey EPC contractor for a 1,800 MWac solar photovoltaic plant in Dubai. The project supports the continued build-out of the Mohammed bin Rashid Al Maktoum Solar Park and sustains demand for utility-scale solar EPC capabilities, including large civil packages, electrical balance of system, and grid interconnection. It also reflects the increasing emphasis on delivery certainty and localization readiness for winning large renewable tenders in the UAE.


Research Methodology Framework and Report Scope
Market Definition and Coverage
For this report, the UAE power EPC market is defined as the revenue earned from engineering, procurement, and construction work delivered for power generation projects and power transmission and distribution projects inside the United Arab Emirates.
Scope exclusions: Routine operations and maintenance-only services, equipment-only supply with no EPC responsibility, and non-power civil construction are excluded from sizing.
Segmentation Overview
- Power Generation EPC
- By Technology
- Thermal
- Nuclear
- Renewables
- By Capacity Band
- Up to 100 MW (DER, micro-grid)
- 100 to 499 MW
- Above 500 MW
- By End-User
- Regulated Utilities
- Independent Power Producers
- Industrial Captive Power
- Public Sector and SOE
- By Technology
- Power Transmission and Distribution (T&D) EPC
Data Sources, Market Sizing, and Validation
Desk Research
Desk work was used to build a clean view of the project pipeline and to ground assumptions on typical EPC spend levels for different power asset types. Public and official sources such as the UAE Ministry of Energy and Infrastructure, the Federal Competitiveness and Statistics Centre, the UAE Ministry of Finance budget disclosures (where relevant), the International Renewable Energy Agency, the International Energy Agency, and the World Bank energy indicators were used to track capacity additions, demand direction, and generation mix shifts that can trigger EPC awards.
We also reviewed tender notices and award disclosures on utility and authority websites, company annual reports and filings, investor presentations, and reputable press coverage to validate timelines and contract values. For cross-checking, we referred to paid subscriptions that provide company financials and intelligence, news and financials screening, and global contracts and tenders context, mainly to confirm award status and reduce double counting between packages. The desk research sources listed here are illustrative only, and many other public references were reviewed to collect data points, validate assumptions, and clarify gaps.
Primary Interviews and Surveys
Primary work focused on interviews and structured surveys with EPC contractors, project developers, owners, and specialized subcontractors who see pricing and scope changes in real time. For the UAE, discussions also covered utility procurement patterns, contracting models, and how grid expansion work is packaged, which then helped adjust project lists and convert them into realistic revenue timing.
Distribution of primary research fieldwork respondents
| Company type | Respondent position |
|---|---|
| Top tier: 34% | CXOs: 13% |
| Mid tier: 44% | Functional/Unit leaders: 35% |
| Smaller Players: 22% | Managers: 52% |
Market-Sizing & Forecasting
Sizing was built using a top-down approach where the UAE power project pipeline is reconstructed from capacity additions and network expansion signals, and then converted into EPC revenue using typical spend per MW and spend per grid package across the construction timeline. To keep the model practical, a small set of repeatable inputs was used, and then totals were corroborated with selective bottom-up checks such as sampled contract values, contractor revenue exposure to UAE power work, and channel checks on award timing.
Key inputs that shaped the model included announced and awarded generation capacity (MW), the technology mix across thermal, nuclear, and renewables, substation and transmission expansion activity, typical project duration by asset type, and indicative EPC price movement linked to equipment and commodity cost direction. Where project values were not disclosed, gaps were handled through proxy pricing based on comparable UAE projects and confirmed ranges from primary respondents, and then totals were adjusted to avoid double counting between generation packages and network packages.
Forecasting relied on scenario analysis supported by a light multivariate view of electricity demand growth, policy-led renewable targets, and grid reinforcement needs, which were pressure-tested through primary feedback. When views differed, conservative and aggressive cases were kept, and the published forecast reflects the central case after assumptions were reconciled with observed award pipelines.
Data Validation & Update Cycle
Validation was done through multiple checks so the final numbers stay consistent with real market signals. Model outputs were compared against independent indicators such as commissioning schedules, tender-to-award conversion patterns, and large project news flow, and then large variances were traced back to either scope mapping, timing shifts, or pricing assumptions.
Before sign-off, the work is reviewed in steps, first at the assumption level and then at the final market total level, so outliers are questioned and corrected early. If a major new award, cancellation, or commissioning delay is detected, respondents are re-contacted to confirm the change and its impact on revenue timing. The report is refreshed annually, with interim updates when material events occur, and a final pre-delivery pass is completed so clients receive the latest view.
Mordor Intelligence's United Arab Emirates Power Epc Market Size Compared With Other Published Estimates
Published market values for UAE power EPC can look far apart because different studies do not count the same work packages, and they also time revenues differently across multi-year construction cycles. Currency timing, what is treated as EPC versus related services, and how project delays are handled can each shift the total meaningfully.
In this market, the biggest gap drivers are usually whether transmission and distribution EPC is included alongside generation EPC, and whether refurbishment or maintenance-like scopes are mixed into the number. Differences also come from how announced projects are converted into awards, and whether aggressive or conservative assumptions are used for award probability and execution timing.
Benchmark comparison
| Source | Market Size | Gaps in Research Methodology |
|---|---|---|
| Mordor Intelligence | USD 6.89 B (2026) | |
| Industry Publisher A | USD 7.23 B (2026) | This estimate appears to include a wider set of services around EPC delivery, which can lift the same-year value when commissioning and adjacent services are bundled into the market total. |
| Research House B | USD 1.50 B (2024) | This number aligns more closely with a generation-side EPC-only view and a different base year, which reduces comparability when transmission and distribution EPC and later-cycle awards are included in other approaches. |
The table shows that scope and timing choices can quickly widen the spread, even before forecasting assumptions are considered. In Mordor Intelligence's model, generation EPC and T&D EPC are counted only when tied to identified UAE project packages with clear award and execution signals, and O&M-only revenue is kept out unless it is embedded inside an awarded EPC contract. With those rules applied consistently, the market total stays traceable to project drivers and can be rechecked when awards shift or schedules slip.


Key Questions Answered in the Report
How large is the United Arab Emirates power EPC market today?
It stood at USD 6.89 billion in 2026 and is expected to reach USD 8.84 billion by 2031, reflecting a 5.11% CAGR.
Which segment grows fastest within UAE EPC spending?
Renewable-energy EPC, primarily utility-scale solar plus storage, expands at a 6.8% CAGR through 2031.
Why are digital twins becoming important in UAE power projects?
Owners use real-time models to guarantee performance, reduce energy use, and cut maintenance downtime, which lowers lifecycle cost and strengthens PPA bankability.
What role do independent power producers play after PPP reforms?
IPPs enjoy streamlined tenders and long-term PPAs, driving a 6.1% CAGR and broadening investor participation.
How does commodity-price volatility influence project timelines?
Surging steel and copper prices add up to 18% to capex and extend equipment lead times, forcing sponsors to renegotiate schedules and risk allocation.
Where are green-hydrogen EPC opportunities emerging?
Abu Dhabi clusters such as Ruwais and Taweelah require integrated renewable power, electrolysis, and desalination, packaged as single mega-contracts for delivery before 2030.
Page last updated on:





