
Market Overview
| Study Period | 2021 - 2031 |
|---|---|
| Forecast Data Period | 2026 - 2031 |
| Base Year Market Size (2025) | USD 14.22 Billion |
| Market Size (2026) | USD 14.94 Billion |
| Market Size (2031) | USD 19.11 Billion |
| Growth Rate (2026 - 2031) | 5.05 % |
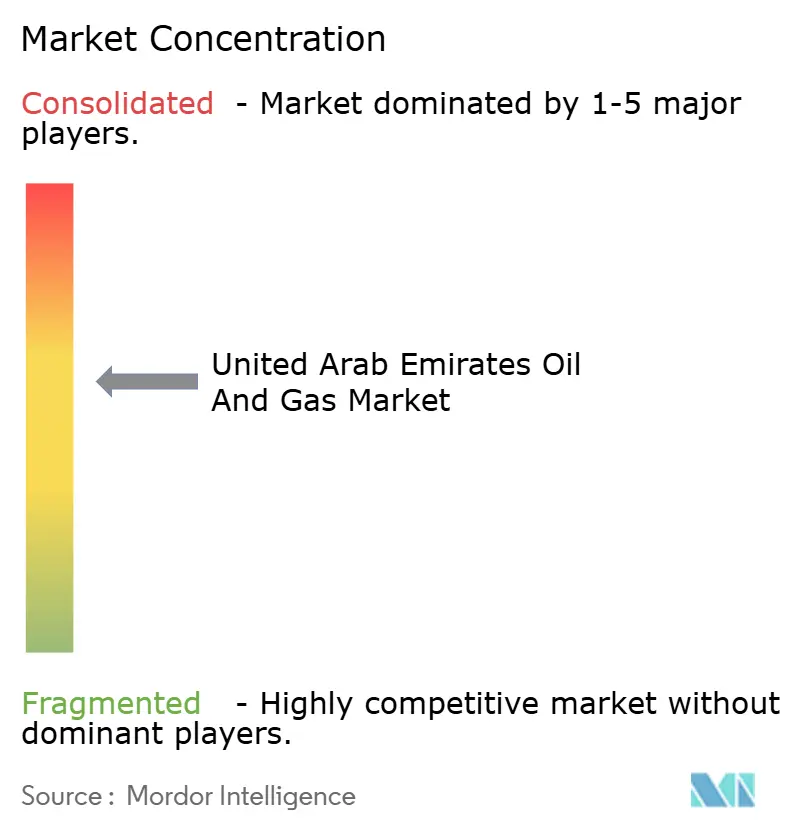
| Market Concentration | Medium |
Major Players *Disclaimer: Major Players sorted in no particular order Image © Mordor Intelligence. Reuse requires attribution under CC BY 4.0. | |
United Arab Emirates Oil And Gas Market Analysis by Mordor Intelligence
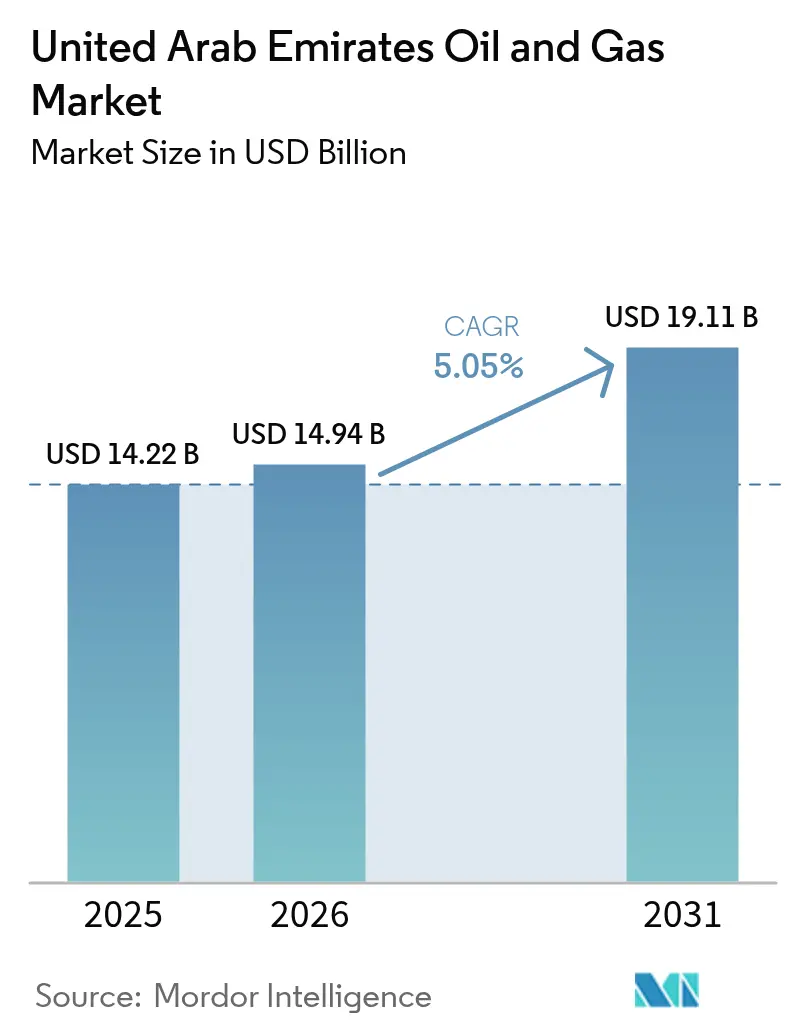
The United Arab Emirates Oil And Gas Market size is expected to grow from USD 14.22 billion in 2025 to USD 14.94 billion in 2026 and is forecast to reach USD 19.11 billion by 2031 at 5.05% CAGR over 2026-2031.
This solid expansion reflects ADNOC’s USD 150 billion upstream investment plan, steady foreign direct investment inflows, and early-mover gains in carbon capture and blue hydrogen. Supply-side growth is anchored in offshore capacity additions, while demand resilience comes from regional bunkering, petrochemical feedstock requirements, and export-linked gas sales. Concise policy frameworks, including the 2024 UAE Climate Law, lower investment risk, and help the UAE oil and gas market retain its role as a strategic Gulf energy hub.[1]“UAE | MENA | World Oil Online,” World Oil, worldoil.com
Key Report Takeaways
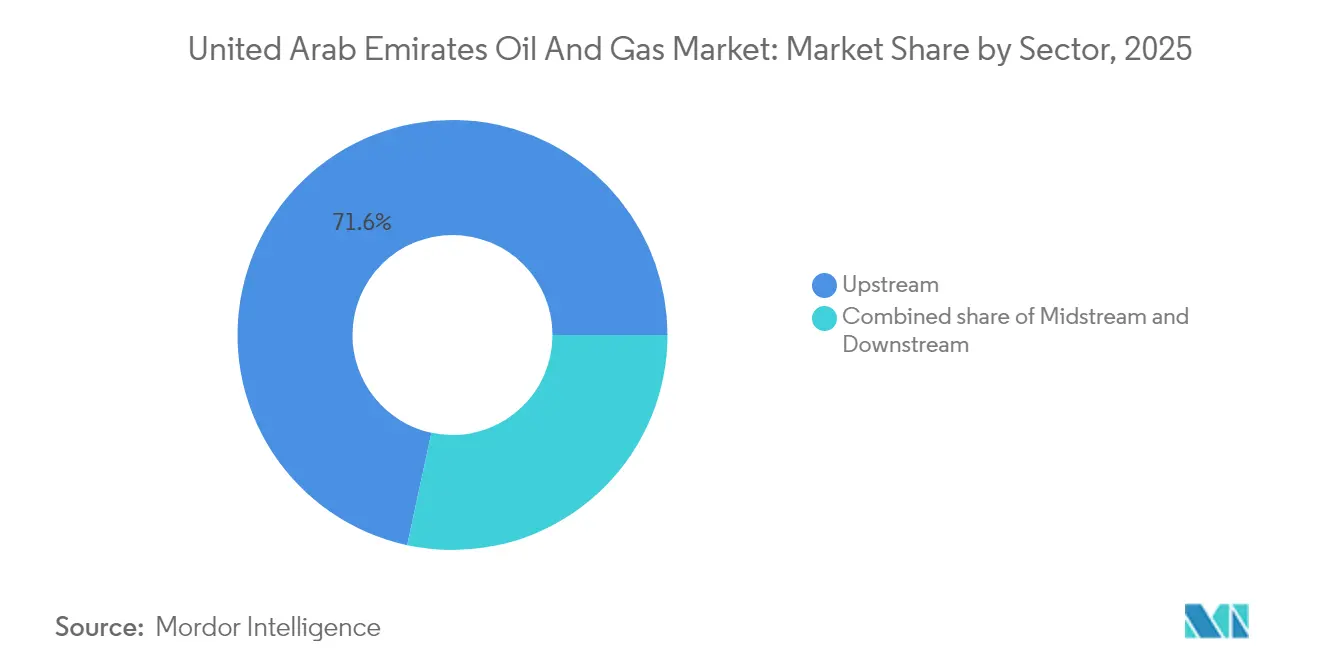
- By sector, the upstream segment held 71.62% of the UAE oil and gas market share in 2025 and is projected to grow at a 5.52% CAGR through 2031, supported by the Hail & Ghasha and Lower Zakum programs.
- By location, onshore assets accounted for 68.92% of the UAE oil and gas market size in 2025, whereas offshore projects are advancing at a faster 6.28% CAGR to 2031, lifted by deepwater sour-gas developments.
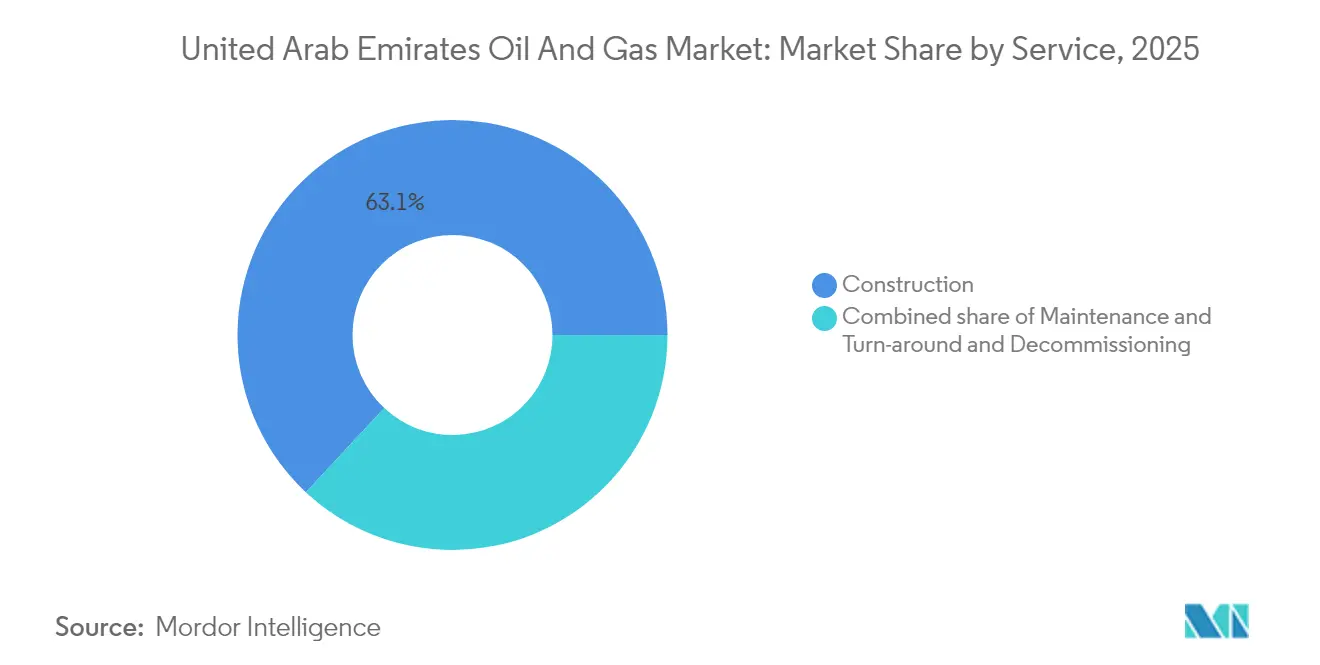
- By service, construction dominated with a 63.05% revenue share in 2025; decommissioning is the fastest-expanding service, rising at a 7.08% CAGR as aging offshore fields approach late life.
Note: Market size and forecast figures in this report are generated using Mordor Intelligence’s proprietary estimation framework, updated with the latest available data and insights as of 2026.
United Arab Emirates Oil And Gas Market Trends and Insights
Drivers Impact Analysis*
| Driver | (~) % Impact on CAGR Forecast | Geographic Relevance | Impact Timeline |
|---|---|---|---|
| Upstream capacity-expansion push | +1.8% | Abu Dhabi core, spillover to Dubai | Medium term (2-4 years) |
| FDI-friendly petroleum investment reforms | +1.2% | Global, with early gains in North America & EU | Long term (≥ 4 years) |
| Accelerated sour-gas & unconventional programs | +1.5% | ADNOC concessions, offshore focus | Medium term (2-4 years) |
| LNG bunkering corridor build-out | +0.9% | Regional maritime routes, APAC export markets | Long term (≥ 4 years) |
| Carbon-capture & blue-ammonia export ambition | +0.7% | Global hydrogen markets, EU compliance | Long term (≥ 4 years) |
| AI-driven subsurface optimization | +0.6% | UAE domestic, technology transfer potential | Short term (≤ 2 years) |
| Source: Mordor Intelligence | |||
Upstream Capacity-Expansion Push
ADNOC is spending USD 150 billion through 2027 to lift nameplate oil capacity to 5 million bpd, prioritizing high-return offshore reservoirs such as Hail & Ghasha, which targets 1.5 billion scf/d of sour gas and integrates full-chain carbon capture.[2]“OMV Exits Ghasha Gas Project off UAE with Lukoil Stake Sale,” AOG Digital, aogdigital.com Field digitalization spans over 30 reservoirs and has reduced well-planning time by 25%, underscoring how the UAE oil and gas market leverages technology to enhance recovery factors. Phased brownfield upgrades at Habshan, Asab, and Das Island complement greenfield additions, striking a balance between cost efficiency and rapid capacity deployment.
FDI-Friendly Petroleum Investment Reforms
The removal of foreign-ownership caps has prompted ExxonMobil to increase its stake in Upper Zakum and enabled EOG Resources to secure Unconventional Onshore Block 3 in 2025. The open equity pathway spurs technology inflows, notably high-pressure pumping for tight reservoirs and predictive maintenance platforms. These capabilities reinforce the UAE's oil and gas market as an attractive destination for capital, even as global investors intensify ESG scrutiny.
Accelerated Sour-Gas & Unconventional Programs
The Shah expansion lifts output to 1.45 billion scf/d, while methane-to-graphene pilots at Habshan turn would-be flared streams into high-margin materials.[3]Adi Imsirovic, “Oil Exchanges: Evolving Markets and Strategic Implications,” Energy Intelligence, energyintel.com Captured CO₂ is back-injected, aligning with the federal 10 million tpy target for 2030. Tight oil pilots, supported by AI-enabled rigs, further diversify reserves and cushion the UAE oil and gas market from OPEC+ quota swings.
LNG Bunkering Corridor Build-Out
Ruwais LNG will be the first low-carbon export facility in the MENA region, utilizing electric motors powered by clean grids to reduce plant emissions by 30%. A 15-year 1 million tpy supply pact with IndianOil secures offtake and catalyzes an Emirati-Indian bunkering chain. Fujairah’s berth upgrades and Das Island compression trains add flexibility, ensuring the UAE oil and gas market captures shipping decarbonization premiums.
Restraints Impact Analysis*
| Restraint | (~) % Impact on CAGR Forecast | Geographic Relevance | Impact Timeline |
|---|---|---|---|
| Grid-parity solar curbing liquid-fuel demand | -0.8% | UAE domestic power generation | Medium term (2-4 years) |
| Volatile OPEC+ quota allocations | -1.1% | Global oil markets, regional coordination | Short term (≤ 2 years) |
| Tier-1 service-company talent flight | -0.4% | Regional competition with Saudi Arabia | Medium term (2-4 years) |
| Rising ESG-linked capital cost | -0.6% | International capital markets | Long term (≥ 4 years) |
| Source: Mordor Intelligence | |||
Grid-Parity Solar Curbing Liquid-Fuel Demand
The UAE Energy Strategy 2050 aims to triple renewable capacity and reduce carbon emissions by 70%, thereby tempering domestic hydrocarbon demand growth as solar and hydrogen energy expand. Dubai’s Clean Energy Strategy aims for a 75% clean energy share by 2050; Abu Dhabi added 1 GW of solar capacity in 2024, representing a 74.7% increase over 2023. The National Hydrogen Strategy aims to produce 15 million tonnes per year of hydrogen by 2050, potentially displacing gas in power and industry. Still, ADNOC is pivoting: it co-invests in blue ammonia and green hydrogen, leveraging existing export infrastructure and reservoir knowledge. Thus, the restraint simultaneously unlocks diversification opportunities for companies entrenched in the UAE oil and gas market.[4]Jennifer Aguinaldo, “Adnoc and Ewec sign $10bn gas supply deal,” MEED, meed.com
Volatile OPEC+ Quota Allocations
The UAE’s 2024 allotment increased by 200 kbpd to 3.2 million bpd, yet quotas still fluctuate due to diplomatic bargaining. Newly added ICE Futures Abu Dhabi contracts hedge revenue volatility, but investment pacing remains sensitive to coalition discipline.
*Our forecasts treat driver/restraint impacts as directional, not additive. The impact forecasts reflect baseline growth, mix effects, and variable interactions.
Segment Analysis
By Sector: Upstream Dominance Powers Growth
In 2025, the upstream segment generated 71.62% of total revenue, underscoring the close tie between the UAE's oil and gas market size and crude output and gas processing. A 5.52% CAGR is expected through 2031 as Lower Zakum, Upper Zakum, and Hail & Ghasha expand plateau rates and improve recovery factors. Capital intensity is counterbalanced by rising drilling efficiency; AI-enabled rigs have lowered the cost per foot drilled by 12%. Midstream value capture is climbing, too, as the USD 5 billion Rich Gas Development project augments pipeline and compression capacity, raising ADNOC Gas EBITDA targets by 40% for 2023-2029.
Despite a smaller contribution, downstream integration strengthens national resilience. Borouge's expansion to 6.6 million tonnes per annum (tpa) of polyolefins by 2028 secures feedstock flexibility, and ENOC's Jebel Ali upgrade increases clean-fuel yield. These moves anchor petrochemical diversification and hedge crude price cycles, keeping the UAE oil and gas market positioned for multi-chain competitiveness.



By Location: Offshore Velocity Outpaces Onshore Dominance
Onshore assets supplied 68.92% of 2025 volume, benefiting from legacy gathering networks and lower lifting costs. Recent unconventional awards to EOG Resources inject shale expertise that can lift onshore gas throughput and align with UAE oil and gas market share objectives for self-sufficiency.
Offshore, however, is the growth pacesetter with a 6.28% CAGR outlook through 2031. Artificial islands at Hail & Ghasha reduce rig mobilization costs, and subsea compression at Das Island adds 840 million scf/d of gas for LNG export. NMDC Energy’s USD 2.5 billion contract on Lower Zakum underscores local EPC depth and highlights how cutting-edge marine logistics propel the UAE oil and gas market into deeper waters.
By Service: Construction Leads as Decommissioning Gains Traction
Construction services captured 63.05% of 2025 spending, reflecting the rollouts of megaprojects such as Project Volta’s USD 1 billion cogeneration facility, which powers TA’ZIZ derivatives complexes. The segment’s growth continues as integrated complexes bundle utilities, pipelines, and digital layers into single EPC scopes.
Maintenance and turnaround sustain asset uptime, with EnerMech clinching multi-year crane contracts and applying drone inspections to cut downtime by 15%. Decommissioning, although still niche, is expanding at a 7.08% CAGR through 2031. Saipem’s win on early platform removals sets precedents for end-of-life regulations, positioning the UAE oil and gas market for responsible asset retirement aligned with global ESG norms.
Geography Analysis
Abu Dhabi dominates hydrocarbon production, accounting for 95% of the UAE's oil reserves and 92% of its gas reserves. Investments exceeding USD 30 billion through 2031 will boost its capacity to 5 million bpd and solidify the emirate as the operational hub of the UAE's oil and gas market. Clustered processing hubs at Habshan, Asab, and Das Island streamline logistics and help lower unit costs despite rising water cuts in mature reservoirs.
Dubai complements upstream heft with trading and storage. ICE Futures Abu Dhabi provides transparent Murban benchmarks, while Fujairah’s expanded tanks capitalize on geographical proximity to critical shipping lanes. The city’s free-zone rules attract traders who arbitrage crude grades, fuels, and LNG, resulting in additional liquidity for the UAE's oil and gas market.
Northern Emirates supply specialized services. Sharjah’s gas hub balances domestic demand swings, and Ras Al Khaimah’s industrial zones host fabrication yards serving regional decommissioning. Federal environmental statutes harmonize standards across emirates, simplifying compliance for operators that span multiple jurisdictions within the UAE oil and gas market.
Regulatory Landscape
The UAE oil and gas regulatory framework combines federal environmental governance with emirate-level resource control. At the federal level, the Ministry of Energy and Infrastructure (MOEI) oversees sector mandates related to energy supply and coordination, while environmental compliance for oil and gas operations is anchored in Federal Law No. 24 of 1999 for the Protection and Development of the Environment, covering requirements around environmental safety, waste management, and limits on combustion emissions.
At the emirate level, Abu Dhabi oversight is led through entities such as the Supreme Council for Financial and Economic Affairs (SCFEA) for concession awards and sector direction, while other emirates use their own councils (for example, the Sharjah Energy Council). In practice, upstream entry commonly routes through ADNOC-led concession and field entry structures, with ADNOC also enforcing group-wide compliance and code-of-conduct standards across majority-owned subsidiaries, which in turn shapes contractor behavior and audit expectations across the value chain.
Competitive Landscape
ADNOC anchors the value chain, controlling upstream concessions and funneling capital into midstream and downstream expansions. The company's pending USD 19 billion Santos acquisition signals intent to grow beyond domestic borders and diversify revenue streams. Digital twins, CCUS rollouts, and blue-hydrogen pilots demonstrate how state leadership guides the UAE's oil and gas market toward low-carbon profitability.
International oil majors, ExxonMobil, BP, TotalEnergies, Shell, and Chevron, compete for acreage, lured by transparent concession terms and low sovereign risk. Their advanced subsea systems, ultra-sour materials, and high-pressure fracturing fleets raise technical ceilings, accelerating the time to first oil in partnership projects.
Service players are split between global giants and local specialists. Schlumberger, Halliburton, and Baker Hughes supply formation evaluation, fracturing, and turbomachinery, while NMDC Energy, Target Engineering, and Petrofac leverage In-Country Value requirements to capture EPC scope. Decommissioning, CCUS retrofits, and LNG bunkering present new opportunities, promising additional revenue streams and increased competitiveness in the UAE oil and gas market.
United Arab Emirates Oil And Gas Industry Leaders
Abu Dhabi National Oil Company (ADNOC)
Exxon Mobil Corporation
TotalEnergies SE
BP PLC
Shell PLC
- *Disclaimer: Major Players sorted in no particular order

Market Opportunities and Future Outlook
Large, multi-year contract pipelines and major gas-concession awards create room for EPC, local manufacturing, and advanced oilfield services tied to In-Country Value requirements. In May 2026, ADNOC announced a plan to award AED 200 billion (USD 55 billion) in project contracts over 2026-2028, a volume that widens addressable work for fabrication, rotating equipment, digital systems integration, and long-lead packages across upstream, midstream, and downstream buildouts. The TA'ZIZ ecosystem in Al Ruwais Industrial City also supports additional demand for utilities, pipelines, and feedstock-linked infrastructure as industrial chemicals investments scale.
Gas self-sufficiency and export-linked gas development remain key opportunity corridors, supported by new offshore and onshore programs. In January 2026, ADNOC announced a final investment decision for the SARB Deep Gas Development (200 million scf/d), and in June 2026 SCFEA awarded the Bab Gas Cap concession to an ADNOC-led consortium with international partners, anchoring a large-scale development program around gas processing and associated infrastructure. On monetization, long-term LNG offtake agreements for Ruwais LNG, including a 15-year 1 million tpy arrangement previously signed with IndianOil and a 15-year 1 million tpy agreement signed with Japans INPEX in July 2026, strengthen the commercial case for LNG logistics, bunkering-related services, and emissions-reduction solutions embedded in new-build facilities.
Recent Industry Developments
- July 2026: ADNOC signed a 15-year sales and purchase agreement with Japans INPEX to supply 1 million tonnes per annum of LNG from the Ruwais LNG project. The deal strengthens long-term offtake coverage for a new export asset and supports investment visibility across liquefaction, storage, and shipping services. It also reinforces the UAE role in linking upstream gas developments with contracted LNG exports.
- June 2026: Abu Dhabis Supreme Council for Financial and Economic Affairs (SCFEA) awarded the Bab Gas Cap concession to an ADNOC-led consortium, with TotalEnergies and BP among the partners. The project scale, cited at 1.5 billion standard cubic feet per day, drives demand for sour-gas capable processing, compression, and specialist drilling and completion services. Bringing additional international partners into a flagship gas development also deepens technology transfer and procurement opportunities across the domestic supply chain.
- September 2025: ADNOC initiated a USD 19 billion bid for Santos, supported by plans for over USD 10 billion in debt financing. The move signaled a push to diversify earnings beyond the domestic base and expand international gas exposure, complementing the UAEs LNG and gas strategy. It also highlighted a willingness to use large-scale M&A alongside organic megaprojects to reposition the portfolio.


Research Methodology Framework and Report Scope
Market Definition and Coverage
For this study, the United Arab Emirates oil and gas market is sized in value terms based on spending linked to upstream, midstream, and downstream activities across onshore and offshore assets, including major project and operating service needs.
Scope exclusions: We exclude renewable energy, power generation equipment, and non-hydrocarbon chemicals that are not tied to oil and gas production, processing, transportation, or refining demand.
Segmentation Overview
- By Sector
- Upstream
- Midstream
- Downstream
- By Location
- Onshore
- Offshore
- By Service
- Construction
- Maintenance and Turn-around
- Decommissioning
Data Sources, Market Sizing, and Validation
Desk Research
Desk research is used to map the industry structure and anchor our assumptions to publicly visible signals. We typically refer to official production and capacity statistics from sources such as OPEC, the International Energy Agency, the US EIA, and UN Comtrade for trade flows, followed by policy and licensing references from UAE government portals and energy regulators.
We also review company annual reports, investor presentations, project announcements, and reputable press coverage to build a clean timeline of capacity additions, brownfield expansions, and maintenance cycles. Where available, a paid subscription that tracks company financials and a shipment-level import and export database are used to cross-check equipment and material movement patterns that align with project timing. The desk sources listed here are illustrative, and other public references are used to collect, validate, and clarify inputs during the work.
Primary Interviews and Surveys
Primary interviews and structured surveys are used to pressure-test what desk sources cannot show clearly, such as the split between new build and maintenance work and how contract values translate into annualized market value. We speak with a mix of operators, EPC and service firms, logistics and trading participants, and industry advisers across major UAE activity hubs, then revisit specific assumptions when responses show large variance.
Distribution of primary research fieldwork respondents
| Company type | Respondent position |
|---|---|
| Top tier: 27% | CXOs: 12% |
| Mid tier: 56% | Functional/Unit leaders: 30% |
| Smaller Players: 17% | Managers: 58% |
Market-Sizing & Forecasting
Sizing starts with a top-down rebuild of the UAE activity pool by linking hydrocarbon production outlook and processing and refining throughput to expected spend across upstream, midstream, and downstream. Those totals are then checked using selective bottom-up approximations, where sampled project awards, typical cost ranges for maintenance and turnarounds, and a limited roll-up of supplier and contractor revenue exposure are used to adjust the final number.
Key inputs used in the model include crude oil and gas production levels, planned capacity additions and de-bottlenecking schedules, refinery and gas processing utilization, the cadence of shutdowns and turnarounds, and a practical view of onshore versus offshore cost intensity. When a bottom-up data point is missing for a niche activity, we fill the gap by applying peer project benchmarks and then validating the implied spend with interview feedback.
For forecasting, scenario analysis is used so the base case can reflect project timing risk and price-driven investment behavior without overfitting the model. Assumptions on project start dates, utilization, and service intensity are updated using primary feedback, and then the forecast is translated into annual market values in USD with consistent currency timing.
Data Validation & Update Cycle
Outputs are triangulated against independent signals such as production and capacity statistics, public project pipelines, and observed import and export movements for relevant equipment and materials, then any large deviations are investigated. A variance log is maintained so unusual jumps can be traced back to a specific input, and those inputs are rechecked before sign-off.
The model and narrative go through multi-step analyst reviews, and we re-contact sources when a major assumption shifts or when new projects are awarded or delayed. Reports are refreshed annually, with interim updates when material events occur, and a final pre-delivery pass is completed so clients receive the latest view.
Mordor Intelligence's United Arab Emirates Oil and Gas Market Sizing Compared With Other Published Estimates
Published market values for UAE oil and gas often do not match because each source measures a different economic thing, and the scope is not always stated clearly. Some numbers follow sector revenue, while others track project and operating spend, and the time window for currency conversion can also change the result.
The biggest gap drivers in this market are whether upstream, midstream, and downstream are all counted together, and whether service categories like construction, maintenance and turn-around, and decommissioning are included as part of the market value. Another driver is the use of volume style metrics or headline industry revenue to infer value, which can inflate totals when it is not filtered down to spend occurring inside the UAE in a given year. This step is applied near the end of the sizing flow at Mordor Intelligence.
Benchmark comparison
| Source | Market Size | Gaps in Research Methodology |
|---|---|---|
| Mordor Intelligence | USD 14.22 B (2025) | |
| Global Consultancy A | USD 174.50 B (2024) | This figure appears to reflect a broader sector revenue view and includes product categories like petrol and petrochemicals, which can behave like output value rather than annualized UAE spend for oil and gas activities. |
| Regional Consultancy B | USD 450.00 B (2030) | This value is a long-range target year estimate that is sensitive to aggressive investment and price assumptions, and it is not directly comparable to a near-term base year market size without normalizing the forecast window and scope. |
Overall, the spread is mainly explained by what is being counted and for which year it is being reported. By keeping the scope tied to UAE onshore and offshore activity spend across upstream, midstream, and downstream, and then checking it against project timing and operating cycles, the estimate stays easier to reconcile and repeat year to year.


Key Questions Answered in the Report
How large is the UAE oil and gas market in 2026?
The UAE oil and gas market size stands at USD 14.94 billion in 2026 and is on track for steady expansion, reaching USD 19.11 billion by 2031.
What CAGR is expected for UAE hydrocarbon revenues to 2031?
Market revenues are projected to grow at a 5.05% CAGR over 2026-2031, reflecting robust upstream and LNG investments.
Which segment leads current revenue in the UAE?
Upstream operations dominate with a 71.62% share in 2025, driven by Lower Zakum and Hail & Ghasha expansions.
Which location is growing fastest in UAE production?
Offshore fields are advancing at a 6.28% CAGR to 2031 as deepwater sour-gas projects come onstream.
What new export avenues are emerging?
Low-carbon LNG and blue ammonia, supported by integrated CCUS, expand export options beyond crude oil.
How concentrated is supplier power?
With ADNOC plus four majors controlling 60-65% of turnover, the market shows moderate concentration at score 6.
Page last updated on:


 Your data is secure and never sold or shared.


