Market Overview
| Study Period | 2021 - 2031 |
|---|---|
| Forecast Data Period | 2026 - 2031 |
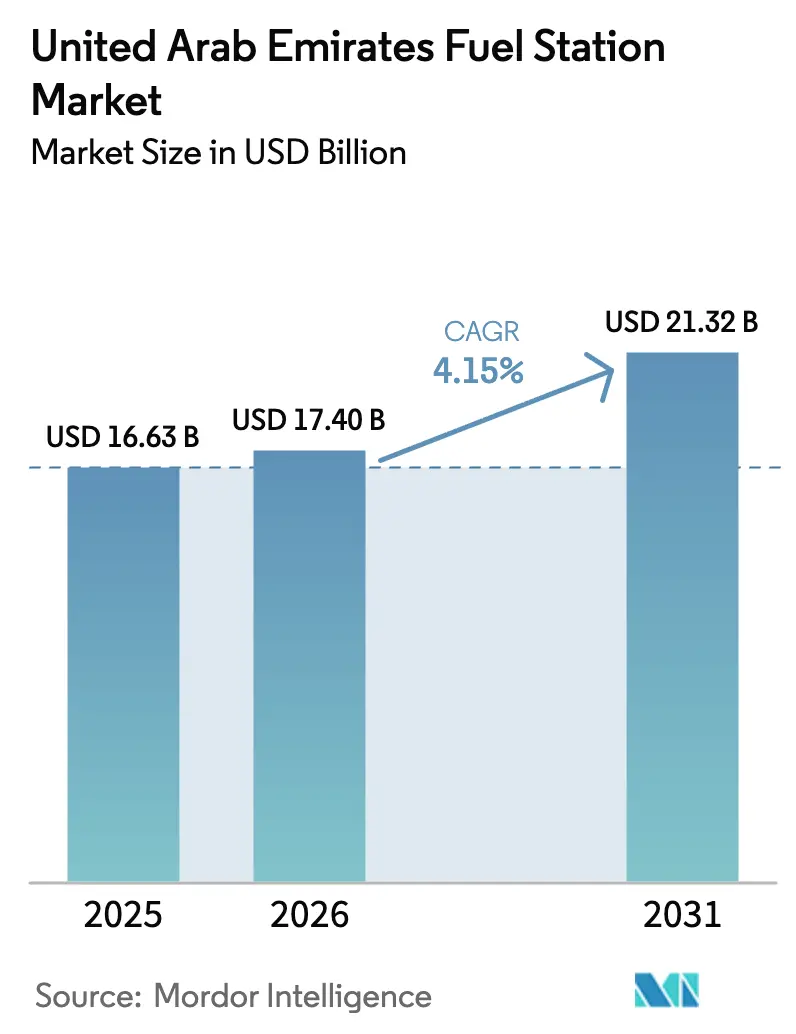
| Base Year Market Size (2025) | USD 16.63 Billion |
| Market Size (2026) | USD 17.40 Billion |
| Market Size (2031) | USD 21.32 Billion |
| Growth Rate (2026 - 2031) | 4.15% CAGR |
| Market Concentration | High |
Major Players *Disclaimer: Major Players sorted in no particular order Image © Mordor Intelligence. Reuse requires attribution under CC BY 4.0. | |
United Arab Emirates Fuel Station Market Analysis by Mordor Intelligence
The United Arab Emirates Fuel Station Market size is expected to increase from USD 16.63 billion in 2025 to USD 17.40 billion in 2026 and reach USD 21.32 billion by 2031, growing at a CAGR of 4.15% over 2026-2031.
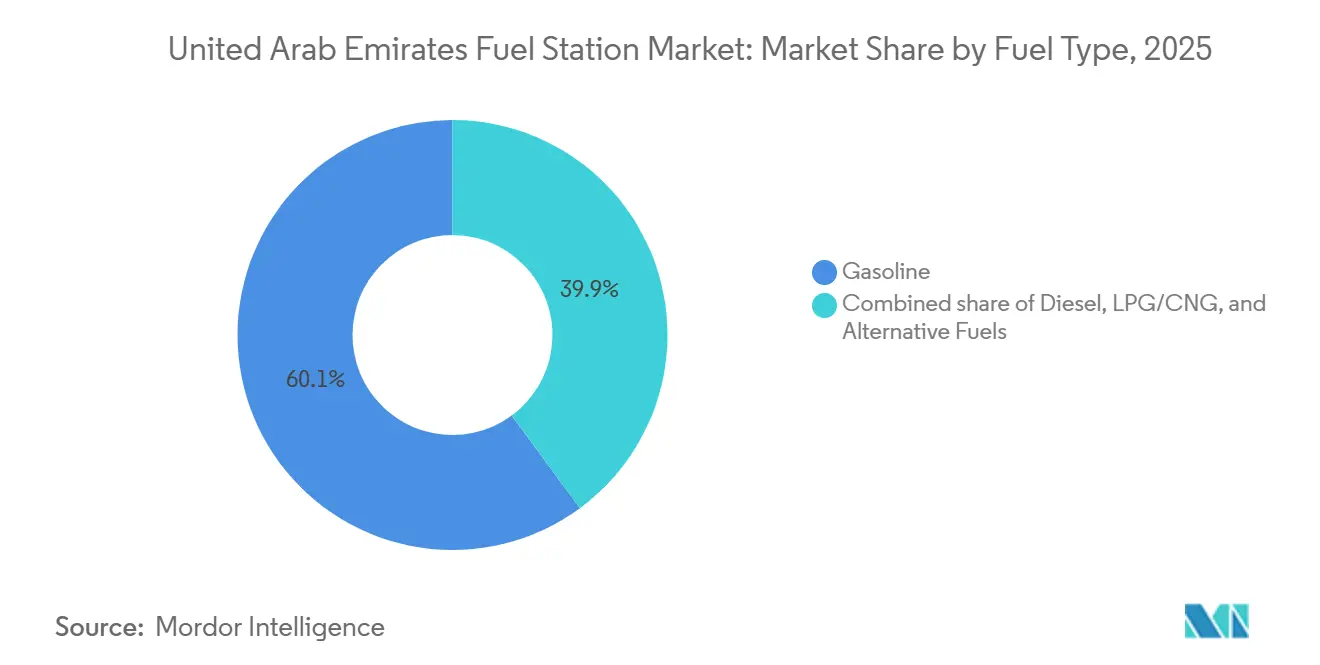
Gasoline still dominates with a 60.1% share, yet hydrogen and EV charging together are advancing at a 23.5% CAGR, signaling a structural reshaping of the refueling mix that operators must handle in parallel. Vehicle-parc expansion to 4.56 million units by June 2025, up 9.35% year-on-year, sustains throughput even as electrification policies nibble at conventional demand. Retail deregulation introduced monthly pump-price adjustments in 2015, elevating margin volatility but rewarding inventory discipline and dynamic pricing. Format innovation accelerates revenue diversification: fuel-and-convenience combinations now capture 49.9% share, while multi-energy hubs are expanding at 20.2% CAGR, driven by ADNOC Oasis and ZOOM collaborations. Highway service plazas, tied to the E11 and E311 expansions, grow at a 6.6% CAGR, capitalizing on freight and tourism traffic that supports diesel and premium-grade gasoline.
Key Report Takeaways
- By fuel type, gasoline led with 60.1% United Arab Emirates Fuel Station market share in 2025, whereas alternative fuels are forecast to expand at 23.5% CAGR through 2031.
- By service offering, fuel-and-convenience-store formats held 49.9% of the United Arab Emirates Fuel Station market size in 2025, while multi-energy hubs are projected to advance at 20.2% CAGR between 2026-2031.
- By station format, traditional full-service stations commanded 54.5% share of the United Arab Emirates Fuel Station market size in 2025; highway service plazas posted the highest forecast growth at 6.6% CAGR.
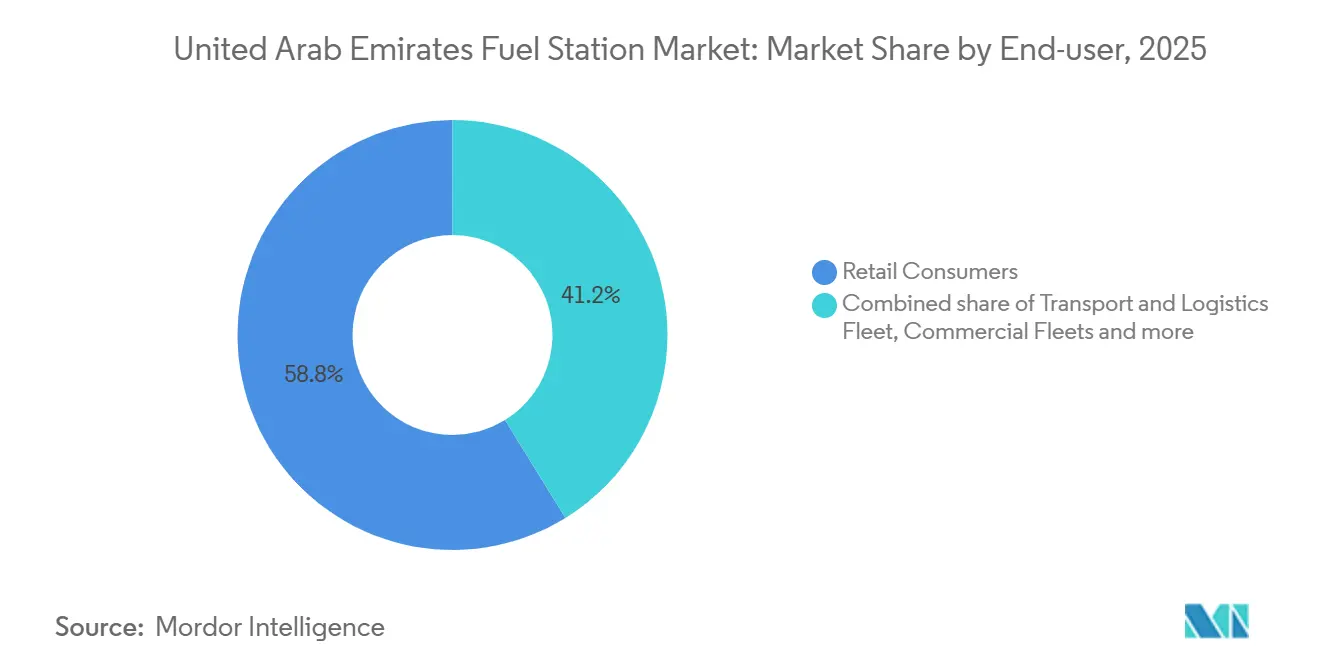
- By end-user, retail consumers accounted for a 58.8% share in 2025, yet transport and logistics fleets exhibit the fastest trajectory with a 7.1% CAGR to 2031.
- ADNOC Distribution, ENOC, and Emarat jointly controlled about 85% of retail volumes in 2025, signaling a concentrated competitive structure within the United Arab Emirates Fuel Station market.
Note: Market size and forecast figures in this report are generated using Mordor Intelligence’s proprietary estimation framework, updated with the latest available data and insights as of January 2026.
United Arab Emirates Fuel Station Market Trends and Insights
Drivers Impact Analysis*
| Driver | (~) % Impact on CAGR Forecast | Geographic Relevance | Impact Timeline |
|---|---|---|---|
| Growing vehicle parc | +1.2% | National focus on Dubai, Abu Dhabi, Sharjah | Medium term (2-4 years) |
| Liberalized retail fuel-margin policy | +0.8% | National | Short term (≤2 years) |
| Expansion of road and logistics infrastructure | +0.9% | National, emphasis on E11, E311, Jebel Ali | Long term (≥4 years) |
| Tourism-driven gasoline and diesel demand | +0.7% | Dubai, Abu Dhabi, spill-over to Northern Emirates | Medium term (2-4 years) |
| AI-based forecourt automation and predictive maintenance | +0.4% | Early adoption in Dubai, Abu Dhabi | Long term (≥4 years) |
| Multi-energy forecourts supporting Net-Zero 2050 | +0.6% | National, pilot sites in Abu Dhabi, Dubai | Long term (≥4 years) |
| Source: Mordor Intelligence | |||
Growing Vehicle Parc Across UAE
The registered fleet grew to 4.56 million units by June 2025, advancing 9.35% year-on-year, as rising incomes and limited mass-transit options outside the two largest cities added incremental vehicles. Light commercial vehicles and SUVs dominate new registrations, bolstering gasoline and diesel throughput despite an uptick in EV sales. Low fuel taxes and competitive pump prices encourage high mileage per vehicle when compared with European norms. ADNOC Distribution delivered 11.7 billion liters during the first nine months of 2025, a 5.9% lift that tracks the fleet expansion. Operators densify networks along Dubai–Sharjah and Abu Dhabi–Al Ain corridors where commuter traffic peaks, aligning capacity with real-time demand analytics.
Liberalized Retail Fuel-Margin Policy
Monthly price adjustments tied to Brent crude started in 2015, transferring price risk to consumers while enabling operators to optimize margins. ADNOC Distribution improved gross profit by 12% during the first three quarters of 2025 by hedging procurement and leveraging data-driven pricing. ENOC and Emarat adopted similar hedging, but the scale gaps narrow their upside. The policy raises consumer price sensitivity, prompting loyalty programs and bundled convenience offers that defend traffic during high-price periods.
Expansion of Road & Logistics Infrastructure
More than USD 3 billion flowed into highway and port upgrades during 2024-2025, including widening of E11 and E311, reinforcing freight corridors to Jebel Ali Port. Logistics activity, up 7.2% in 2024, feeds diesel demand along extended truck lanes. Highway plazas linked to these arteries earn 20%-30% higher revenue per square meter vs. urban stations, justifying 6.6% CAGR growth. The Dubai Logistics Corridor, launched in 2024, slices transit times by 25%, amplifying concentration of fueling needs at strategic nodes and supporting premium pricing structures.
Tourism-Driven Gasoline & Diesel Demand
International arrivals reached 17.15 million visitors in 2024, adding substantial rental and taxi mileage that equates to 12%-15% of total gasoline and diesel volumes. Dubai International Airport handled 87 million passengers in 2024, strengthening ground-transport demand around the airport. With a 25 million visitor target for 2025, incremental demand could reach 200-250 million liters annually. Stations near tourist districts log up to 20% higher throughput during peak months, driving investments in multilingual interfaces and premium grades. Yet the gradual pivot to electric rental fleets could temper this driver beyond 2027.
Restraints Impact Analysis*
| Restraint | (~) % Impact on CAGR Forecast | Geographic Relevance | Impact Timeline |
|---|---|---|---|
| Rapid EV-charging network roll-out | −0.9% | Dubai and Abu Dhabi spreading to Northern Emirates | Medium term (2-4 years) |
| Deregulated pump prices causing demand volatility | −0.5% | National | Short term (≤2 years) |
| Ride-sharing and mass-transit adoption | −0.4% | Dominant in Dubai, limited elsewhere | Medium term (2-4 years) |
| Fleet electrification mandates for taxis and last-mile | −0.6% | Dubai, Abu Dhabi | Short term (≤2 years) |
| Source: Mordor Intelligence | |||
Rapid EV-Charging Network Roll-Out
Public and semi-public charging points climbed to 868 by end-2025, equating to one charger per 5,250 vehicles, surpassing the IEA’s early-market threshold. Tesla added 12 Supercharger sites during 2024-2025, accelerating premium-segment electrification. Stranded capital risk emerges because a traditional pump island requires 7-10 years for payback, yet accelerated EV adoption could curtail utilization by the early 2030s. Operators retrofit sites with DC fast-chargers, though older urban grids present connection-cost hurdles.
Fleet Electrification Mandates for Taxis & Last-Mile
Dubai requires 30% of its 10,000+ taxis to be electric or hybrid by 2027, ramping to 90% in 2030. Abu Dhabi outlines analogous goals for 1,500 taxis. High-mileage segments consume up to four times more fuel than private cars, so policy affects urban stations disproportionately. Last-mile couriers pilot electric vans, chasing operating costs near USD 0.08-0.10 per kilometer versus USD 0.14-0.16 for diesel. Stations near fleet depots now layer EV charging, car washes, and telematics services to offset shrinking petroleum volumes.
*Our updated forecasts treat driver/restraint impacts as directional, not additive. The revised impact forecasts reflect baseline growth, mix effects, and variable interactions.
Segment Analysis
By Fuel Type – Alternative Fuels Surge Amid Gasoline Dominance
Gasoline secured 60.1% of the United Arab Emirates Fuel Station market share in 2025. Diesel maintains relevance with commercial fleets, yet heads toward marginal decline as electrification penetrates logistics and public-bus segments. Alternative fuels, notably hydrogen and EV charging, post a 23.5% CAGR, the sharpest across categories, powered by government mandates and decreasing charger capex. ADNOC Distribution targets 500-750 charging points by 2028, expanding the United Arab Emirates Fuel Station market footprint into electricity. Hydrogen remains pilot-scale due to dispenser costs and a nascent vehicle base, but strategic positioning today prepares operators for heavy-transport decarbonization. EV charging stands out as the primary growth vector through 2031, enabled by consumer familiarity and public-sector support. Those delaying multi-energy conversion may cede high-margin traffic to rivals that provide one-stop energy services.
The United Arab Emirates Fuel Station market size for alternative fuels is projected to climb steadily as policy pressure mounts, while diesel retention in long-haul segments cushions the transition. Liquefied petroleum gas and compressed natural gas together occupy a mid-single-digit space, promoted in taxis and select fleets where lower pump prices counter conversion costs. By 2031, the combined share of electricity and hydrogen is expected to challenge gasoline, forcing a recalibration of product mix, storage configuration, and pricing algorithms.


By Service Offering – Multi-Energy Hubs Redefine Forecourt Economics
In 2025, fuel-and-convenience-store formats captured 49.9% of segment revenue, underpinned by ZOOM and ADNOC Oasis footprints that allocate 25%-35% of sales to non-fuel items. Multi-energy hubs grow at a rapid 20.2% CAGR, adding electricity and hydrogen to petroleum to widen wallet share. ADNOC plans 50-75 flagship multi-energy conversions by 2028, targeting fleets seeking reliability and single-stop refueling. Fuel-only sites decline as on-demand refueling apps grow; CAFU raised USD 15 million in 2024 and serviced 100,000 users by late 2025.
United Arab Emirates Fuel Station market participants realize that convenience retail insulates against pump-margin swings borne from deregulation. Quick-serve restaurant integration deepens average basket size and lengthens dwell time. ENOC’s QSR partnerships and Emarat’s drive-through coffee initiatives respond to consumer demand for curated experiences. The inevitable bifurcation positions urban micro-sites for speed, while highway plazas compete on comfort and amenities, forcing operators to match format with catchment demographics.
By Station Format – Highway Plazas Gain While Traditional Sites Retrofit
Traditional full-service formats accounted for 54.5% of 2025 revenue but are expected to surrender share as compact and plaza styles expand. Highway service plazas demonstrate 20%-30% higher revenue density and grow at 6.6% CAGR on the back of logistics traffic through widened E11 and E311 routes. ADNOC and ENOC have secured multiyear concessions on these corridors, aligning capex with predictable throughput. Compact urban stations under 500 m² emerge where land exceeds USD 1,000 per m²; ENOC piloted three such sites, achieving sub-four-year paybacks in 2025.
The United Arab Emirates Fuel Station market size for compact and micro-formats rises as operators seek network densification without proportional capital strain. Regulatory hurdles around fire safety and grid capacity temper roll-out pace, yet profitability advantages sustain interest. Traditional sites undergo phased retrofits that add DC chargers and digitized payment kiosks to remain competitive, gradually converting legacy canopy space into multi-energy islands as demand dictates.
By End-User – Transport & Logistics Fleets Accelerate
Retail motorists still dominate with a 58.8% share in 2025, driven by a high vehicle parc and favorable taxation. Nonetheless, transport and logistics fleets register a 7.1% CAGR, buoyed by 14.1 million TEU throughput at Jebel Ali Port and a 7.2% logistics sector growth in 2024. ADNOC Distribution logged a 9% lift in commercial-fleet volumes in 2025 as fleet-card programs lock customers into negotiated rates. Industrial users, construction and mining, consume diesel in remote zones serviced by mobile refuelers, whereas aviation and marine niches deliver high-value flows through specialized terminals.
The United Arab Emirates Fuel Station market size captured by fleet segments grows because on-road freight and last-mile delivery expand alongside e-commerce. Electrification pilots among couriers and taxis temper petroleum growth but expand electricity revenues for multi-energy forecourts. Operators tailoring invoicing cycles, telematics integrations, and predictive delivery win wallet share and defend against the margin compression typical of mass retail sales.
Geography Analysis
Dubai and Abu Dhabi collectively accounted for an estimated 65%-70% of the United Arab Emirates Fuel Station market revenue in 2025, reflecting density, tourism, and industrial activity. Dubai’s 3.6 million residents and 17.15 million visitors in 2024 drive robust retail traffic along the Sheikh Zayed corridor and around Dubai International Airport, which processed 87 million passengers in 2024. Abu Dhabi contributes heavy-duty and government-fleet demand, supported by 977 ADNOC-operated sites nationwide, roughly 400 of which reside in the emirate.
Sharjah’s 1.8 million population produces commuter surges that peak twice daily; stations proximate to E11 and E311 corridors log up to 15% higher throughput than inland peers. Fujairah captures cross-border flows to Oman and fuels marine bunkering, though retail volumes remain modest. Ras Al Khaimah and Umm Al Quwain exhibit the lowest station density yet fastest household growth, attracting incremental investment. The United Arab Emirates Fuel Station market size for Northern Emirates may therefore outpace the national average in percentage terms, though from a smaller base.
Cross-border fuel tourism, once significant on the Oman border, has moderated since both nations liberalized prices, but weekend spikes remain. Geographic strategy thus aligns capex with traffic profiles: premium multi-energy hubs populate Dubai and Abu Dhabi, whereas cost-efficient formats fill Northern Emirates white spaces. Misalignment risks extended paybacks and operational drag.
Competitive Landscape
ADNOC Distribution, ENOC, and Emarat together operate over 1,350 stations, accounting for nearly 85% of volumes and establishing a tight competitive frame within the United Arab Emirates Fuel Station market. ADNOC’s 2017 IPO funded network growth and digital upgrades, culminating in AI-enabled forecourt management and an app reaching 1.2 million users. ENOC co-brands with TotalEnergies to offer premium fuels, while Emarat leverages Idemitsu Q8 lubricant alliances, each using loyalty schemes and QSR tie-ins to differentiate.
CAFU’s on-demand model bypasses real estate and now processes about 50,000 deliveries per month after a USD 15 million Series B in 2024. H2GO Power pilots hydrogen dispensers along the Abu Dhabi–Dubai route, staking an early claim on zero-emission heavy transport. Smaller players such as Al-Futtaim Blue Fuel stay niche, serving fleet B2B clients. Tesla’s 12-site Supercharger network and Powertech Mobility’s mall-based chargers give early EV adopters alternatives, increasing the strategic urgency for incumbents to add electricity alongside liquid fuels.
The pattern converges on vertical integration, data analytics, and ecosystem bundling. Operators unable to finance multi-energy upgrades and digital layers risk franchise erosion as customers prioritize convenience, app-based payments, and environmental alignment.
United Arab Emirates Fuel Station Industry Leaders
ADNOC Distribution
ENOC
Emarat
TotalEnergies
EPCO (Idemitsu Q8)
- *Disclaimer: Major Players sorted in no particular order


Recent Industry Developments
- January 2026: ADNOC Distribution announced 50 new EV fast-chargers for Dubai and Abu Dhabi corridors, lifting its network to 418 points.
- December 2025: ADNOC Distribution, the largest fuel retailer in the UAE, will accept the AE Coin stablecoin for payments at approximately 980 fuel and convenience stations across the UAE, Saudi Arabia, and Egypt.
- November 2025: H2GO Power obtained approval for three hydrogen stations in Masdar City and the Abu Dhabi-Dubai highway, commissioning mid-2026.
- September 2025: Fuel-tech startup Nawgati has partnered with Seed Group to implement digital solutions at fuel stations in the UAE. This initiative aims to modernize operations, reduce congestion, and enhance efficiency.


United Arab Emirates Fuel Station Market Report Scope
A fuel station, also known as a petrol station or gas station, is a facility that sells fuel and engine lubricants for motor vehicles. Fuel dispensers are used to pump gasoline and diesel into the tanks within vehicles and calculate the financial cost of the fuel transferred to the vehicle.
The United Arab Emirates fuel station market report is segmented into fuel type, service offering, station format, end-user, and geography. By fuel type, the market is divided into gasoline, diesel, LPG/CNG, and alternative fuels. By service offering, the market is segmented into fuel only, fuel and convenience store, fuel/c-store/QSR, and multi-energy hubs. By station format, the market is segregated into traditional full-service, compact/micro-stations, and others. By end-user, the market is divided into retail consumers, commercial fleets, industrial users, transport/logistics fleets, and air/marine transport. The market sizing and forecasts for each segment are based on the revenue generated (in USD).
By Fuel Type
| Gasoline |
| Diesel |
| Liquified Petroleum Gas (LPG)/Compressed Natural Gas (CNG) |
| Alternative Fuels (Hydrogen, EV Charging) |
By Service Offering
| Fuel Only |
| Fuel and Convenience Store |
| Fuel, C-Store, and Quick-Serve Restaurant |
| Multi-Energy Hubs (Fuel + EV/H₂) |
By Station Format
| Traditional Full-Service |
| Compact / Micro-stations |
| Highway Service Plazas |
By End-User
| Retail Consumers |
| Commercial Fleets |
| Industrial Users |
| Transport and Logistics Fleets |
| Air/Marine Transport |
| By Fuel Type | Gasoline |
| Diesel | |
| Liquified Petroleum Gas (LPG)/Compressed Natural Gas (CNG) | |
| Alternative Fuels (Hydrogen, EV Charging) | |
| By Service Offering | Fuel Only |
| Fuel and Convenience Store | |
| Fuel, C-Store, and Quick-Serve Restaurant | |
| Multi-Energy Hubs (Fuel + EV/H₂) | |
| By Station Format | Traditional Full-Service |
| Compact / Micro-stations | |
| Highway Service Plazas | |
| By End-User | Retail Consumers |
| Commercial Fleets | |
| Industrial Users | |
| Transport and Logistics Fleets | |
| Air/Marine Transport |


Key Questions Answered in the Report
How large is the United Arab Emirates Fuel Station market today?
The United Arab Emirates Fuel Station market size stood at USD 17.40 billion in 2026 and is projected to grow at a 4.15% CAGR to reach USD 21.32 billion by 2031.
Which fuel type is growing fastest in UAE stations?
Alternative fuels, namely hydrogen and EV charging, are advancing at 23.5% CAGR, far outpacing gasoline and diesel growth.
Who leads the competitive landscape for UAE fuel stations?
ADNOC Distribution, ENOC, and Emarat together control around 85% of retail volumes, with ADNOC Distribution alone operating 977 stations by Q3 2025.
What is driving station-format change in the UAE?
Multi-energy hubs and highway service plazas are expanding quickly, driven by infrastructure upgrades, electrification mandates, and consumer demand for bundled convenience.
How will taxi electrification affect fuel sales?
Dubai's mandate to shift 90% of taxis to electric or hybrid powertrains by 2030 is expected to reduce conventional fuel volumes in high-mileage segments, prompting stations to add EV charging to offset losses.
What role do convenience stores play in station economics?
Fuel-and-convenience formats generate 25%-35% of revenue from non-fuel items, providing a buffer against margin volatility caused by deregulated pump prices.
Page last updated on:


