
Transfer Pricing Services Market Size and Share
Market Overview
| Study Period | 2021 - 2032 |
|---|---|
| Market Size (2027) | USD 9.60 Billion |
| Market Size (2032) | USD 13 Billion |
| Growth Rate (2027 - 2032) | 6.20 % |
| Fastest Growing Market | Asia-Pacific |
| Largest Market | North America |
| Market Concentration | Low |
Major Players *Disclaimer: Major Players sorted in no particular order Image © Mordor Intelligence. Reuse requires attribution under CC BY 4.0. | |
Transfer Pricing Services Market Analysis by Mordor Intelligence
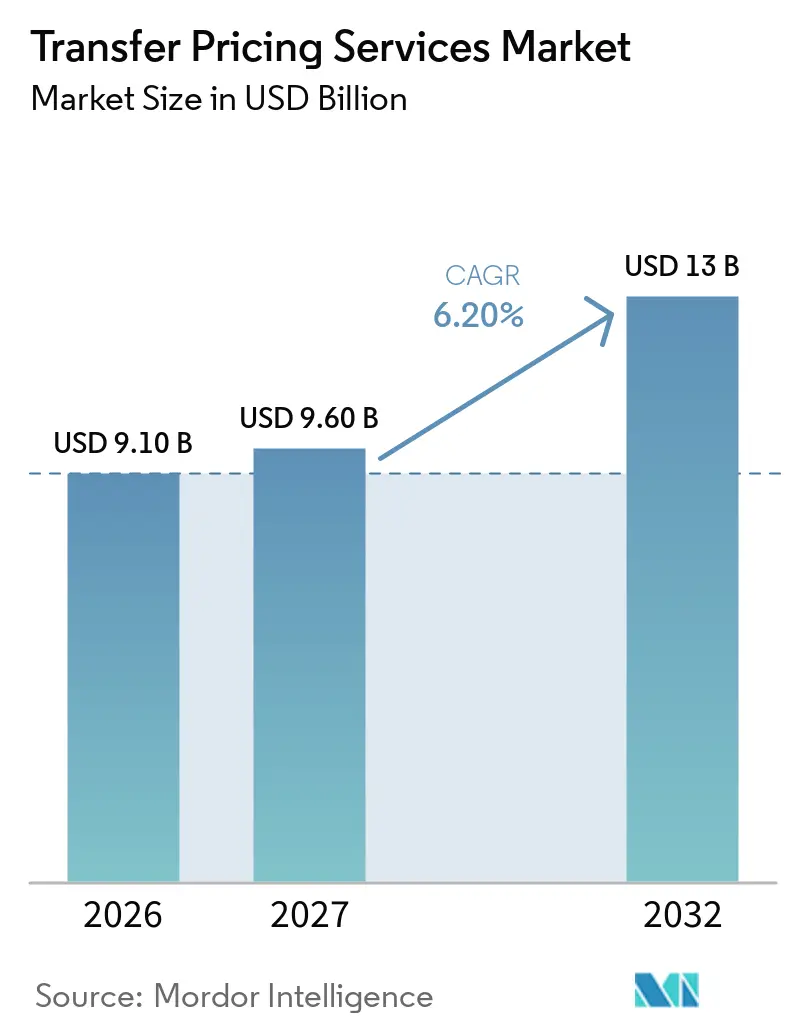
The Transfer Pricing Services Market size is expected to grow from USD 9.10 billion in 2026 to USD 9.60 billion in 2027 and is forecast to reach USD 13 billion by 2032 at 6.20% CAGR over 2027-2032.
The transfer pricing services market is expanding as multinational enterprises face more cross-border transactions and stricter tax oversight. World merchandise trade volume grew 4.6% in 2025, while G20 merchandise trade increased 5.3% quarter-on-quarter in the first quarter of 2026, increasing the number of intercompany flows that require support. Public country-by-country reporting is expected across major jurisdictions in 2026, moving transfer pricing into a more visible governance role. This change favors providers that combine policy work, documentation, data management, and dispute support. The transfer pricing services market also reflects a shift from periodic compliance projects toward ongoing operating models supported by technology.
Key Report Takeaways
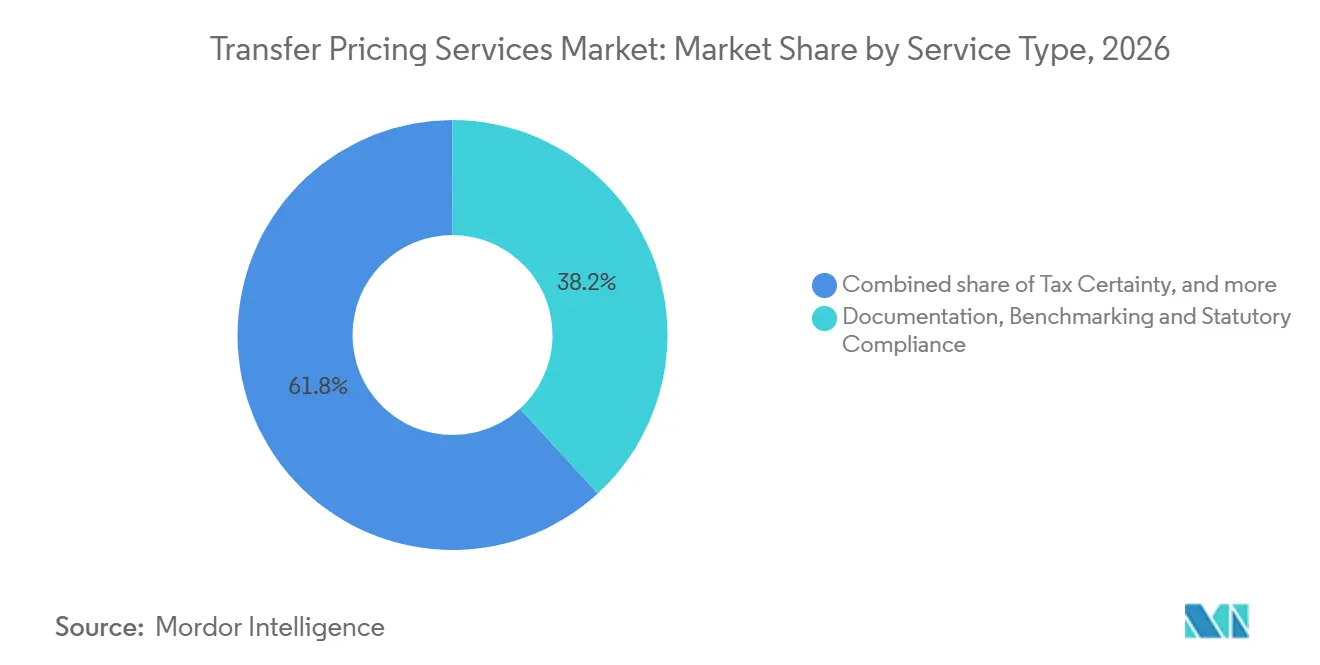
- Documentation, benchmarking, and statutory compliance accounted for 38.2% of the transfer pricing services market share in 2026, while controversy, mutual agreement procedure (MAP), and dispute resolution are projected to register an 8.1% CAGR through 2032.
- Project- and mandate-based arrangements accounted for 46.8% of revenue in 2026, while co-sourced and managed transfer pricing operations are projected to grow at a 9.2% CAGR through 2032.
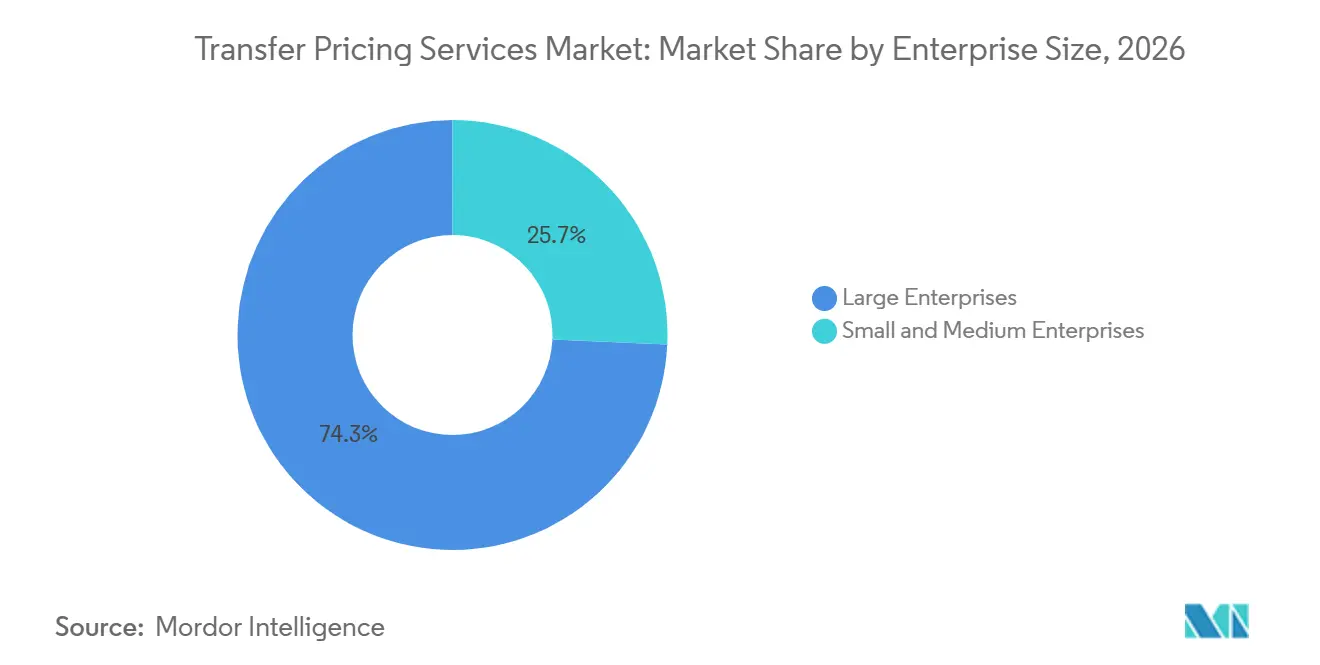
- Large enterprises accounted for 74.3% of the transfer pricing services market share in 2026, while SMEs are forecasted to grow at a 7.0% CAGR through 2032.
- Industrial manufacturing accounted for 22.1% of the transfer pricing services market share in 2026, while TMT is forecasted to grow at a 7.8% CAGR through 2032.
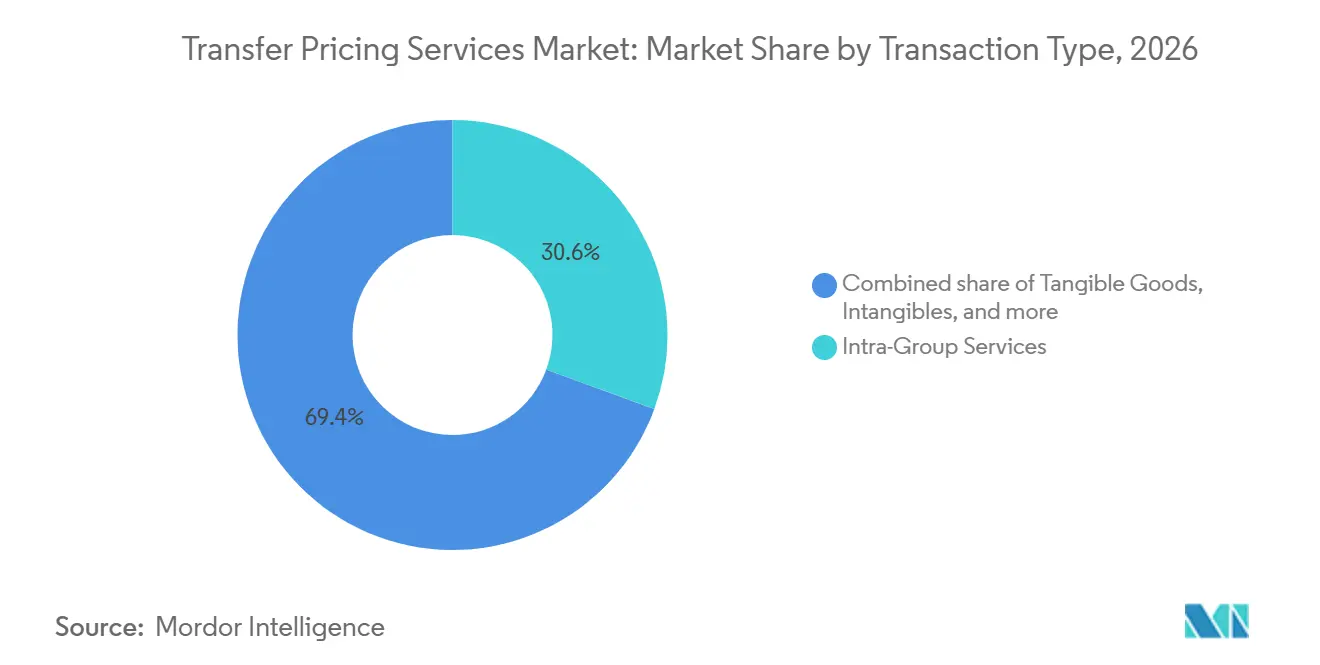
- Intra-group services accounted for 30.6% of the transfer pricing services market share in 2026, while financial transactions are forecasted to grow at an 8.4% CAGR through 2032.
- Accounting and tax networks accounted for 66.4% of the transfer pricing services market share in 2026, while specialist transfer pricing boutiques are forecasted to grow at an 8.2% CAGR through 2032.
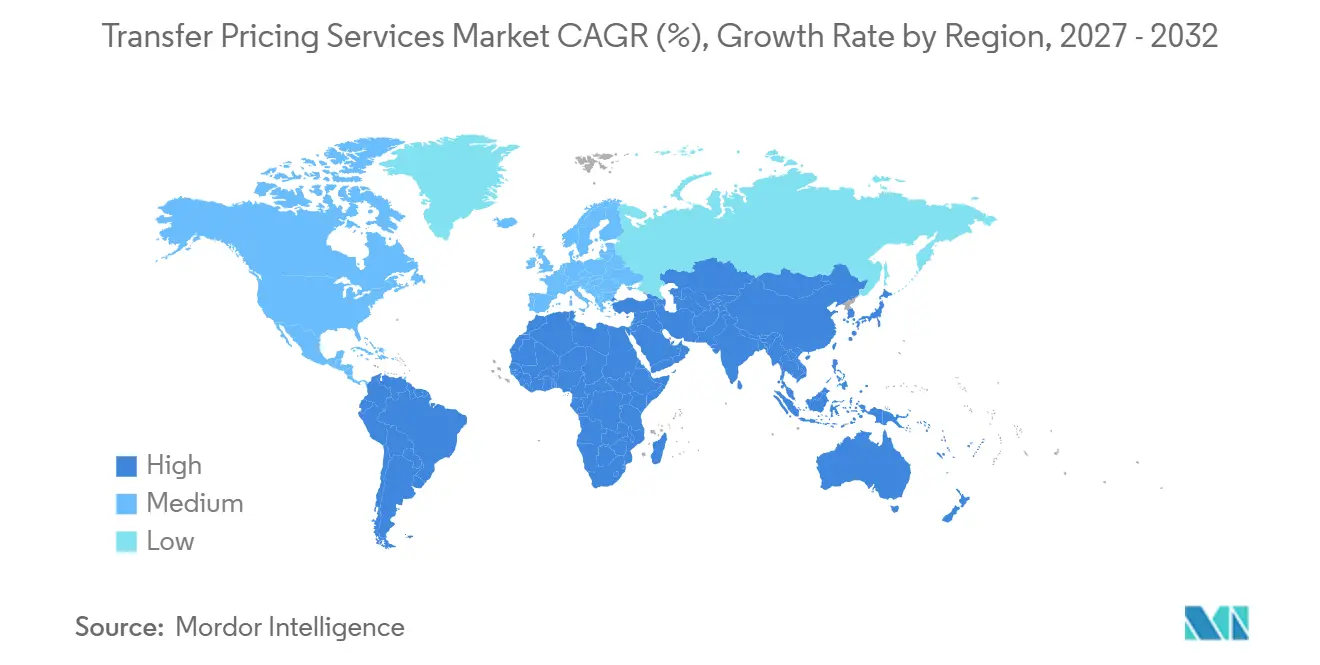
- North America accounted for 40.6% of the transfer pricing services market share in 2026, while Asia-Pacific is forecasted to grow at a 7.7% CAGR through 2032.
Note: Market numbers in this report are based on Mordor Intelligence's proprietary estimation framework, which combines nine months of actuals with Q4 projections for base year 2026.
Market Trends and Insights
Drivers Impact Analysis of Transfer Pricing Services Market*
| Driver | (~) % Impact on CAGR Forecast | Geographic Relevance | Impact Timeline |
|---|---|---|---|
| Rising Volume of Cross-Border Related-Party Transactions | +1.7% | Global | Short term (≤ 2 years) |
| Expansion of TP Documentation and Compliance Requirements | +1.5% | North America and Europe, spill-over to Asia-Pacific and Middle East, and Africa | Medium term (2-4 years) |
| Implementation of OECD TP and International Tax Reforms | +1.2% | Global | Medium term (2-4 years) |
| Increasing Tax Authority Scrutiny, Audits, and TP Disputes | +1.0% | North America, Europe, Asia-Pacific core | Short term (≤ 2 years) |
| Growing Demand for TP Planning and Business Restructuring Advisory | +0.5% | North America, Asia-Pacific core, spill-over to Middle East and Africa | Short term (≤ 2 years) |
| Adoption of Technology-Enabled TP Compliance and Risk Management | +0.4% | Global | Medium term (2-4 years) |
| Source: Mordor Intelligence | |||
Rising Volume of Cross-Border Related-Party Transactions
The expansion of international business activity increases the need for multinational enterprises to assess and document cross-border transactions between associated entities in accordance with applicable national rules and the OECD Transfer Pricing Guidelines. The OECD reported that services delivered through commercial presence reached USD 8.8 trillion in 2023, a channel that often involves intra-group arrangements[1]. Changes in supply chains, sourcing arrangements, and production locations can alter the functions performed, assets used, and risks assumed by related entities, requiring companies to reassess their transfer pricing policies. These developments support ongoing tax, economic, and operational analysis, along with periodic documentation and compliance work.
Expansion of Transfer Pricing Documentation and Compliance Requirements
Transfer pricing documentation obligations are becoming more time-sensitive and increasingly standardized across jurisdictions. Germany generally requires requested transfer pricing records to be submitted within 30 days, while certain documents must be submitted within that period following notification of a tax audit. In the United Kingdom, the Finance Act 2026 authorized HMRC to introduce an International Controlled Transactions Schedule (ICTS), with draft regulations published for consultation in June 2026 and implementation intended for accounting periods beginning on or after 1 January 2027[2]. Meanwhile, approximately 120 jurisdictions have introduced country-by-country reporting obligations under the OECD/G20 BEPS Action 13 framework, reinforcing transparency requirements for qualifying multinational groups. These developments support demand for coordinated documentation, transaction-level data management, and ongoing compliance services, although the extent of recurring managed-service adoption varies across businesses and jurisdictions.
Implementation of OECD Transfer Pricing and International Tax Reforms
OECD reforms are changing how groups assess routine distribution, services, and reporting obligations. Amount B was incorporated into the OECD Transfer Pricing Guidelines in February 2024 and applies from fiscal years starting January 1, 2025, in adopting jurisdictions. The OECD released proposed revisions to Chapter VII in June 2026, with a stronger focus on intra-group services and transaction delineation. Public country-by-country reports expected in 2026 also make transfer pricing policies more visible to external stakeholders. The transfer pricing services market, therefore, needs support that connects technical policies with reliable financial and operational data. Luxembourg’s April 2026 Amount B circular illustrates continued jurisdictional adoption of the simplified framework[3]. This regulatory activity supports advisory work for distribution arrangements and intra-group service charges.
Increasing Tax Authority Scrutiny, Audits, and Transfer Pricing Disputes
Tax authority scrutiny remains a sustained source of demand for controversy support. OECD statistics recorded 2,731 new mutual agreement procedure cases in 2024, up 29% from 2023. Transfer pricing cases rose 29.1% to 2,525, and the average resolution time was 30.9 months[4]. Long resolution periods encourage companies to improve evidence before disagreements become formal disputes. The transfer pricing services market benefits from this need for audit readiness, APA support, and coordinated dispute management. Korea’s stronger evidence rules and the United Arab Emirates’ APA guidance show that scrutiny is broadening across regions. These conditions maintain demand for dispute work even when documentation systems are already in place.
Restraints Impact Analysis of Transfer Pricing Services Market*
| Restraint | (~) % Impact on CAGR Forecast | Geographic Relevance | Impact Timeline |
|---|---|---|---|
| High Cost of Multi-Jurisdictional Transfer Pricing Compliance | -0.5% | Global | Medium term (2-4 years) |
| Shortage of Skilled TP, Tax, and Economics Professionals | -0.4% | Global | Medium term (2-4 years) |
| Fragmented Financial and Transactional Data Across Enterprise Systems | -0.3% | Global | Short term (≤ 2 years) |
| Complexity of Divergent Country-Level Transfer Pricing Regulations | -0.3% | Asia-Pacific core, Middle East and Africa, spill-over to Europe | Long term (≥ 4 years) |
| Source: Mordor Intelligence | |||
High Cost of Multi-Jurisdictional Transfer Pricing Compliance
Multi-jurisdictional compliance can place a substantial burden on groups with limited internal resources. Different filing dates, documentation rules, and penalty regimes require separate workflows and specialist review. Additional reporting obligations in Germany and the United Kingdom can raise the cost of maintaining a compliant global approach. Bilateral APAs can also require extended engagement with competent authorities, limiting their use among smaller businesses. The transfer pricing services market faces different spending patterns among large and mid-sized clients because their internal capabilities differ. These cost pressures favor standardized documentation, managed services, and tools that reduce repetitive work.
Shortage of Skilled Transfer Pricing, Tax, and Economics Professionals
Transfer pricing work requires tax knowledge, financial analysis, and an understanding of how a business operates. A 2025 NBER study found that OECD-aligned reforms were followed by material increases in transfer pricing consultants across Chile, Colombia, Spain, and Uruguay. The study also indicated that the supply response can lag regulatory demand by 2 to 4 years. Digital tools can assist with benchmarking and routine information-related work, but they do not replace senior judgment in complex cases. Valuation disputes, functional characterizations, and mutual agreement procedure matters still require experienced practitioners. The transfer pricing services market can therefore face capacity constraints even as client demand increases.
*Our forecasts treat driver/restraint impacts as directional, not additive. The impact forecasts reflect baseline growth, mix effects, and variable interactions.
Transfer Pricing Services Market Segment Analysis
By Service Type:
Compliance Anchors Revenue While Controversy Drives GrowthDocumentation, benchmarking, and statutory compliance held 38.2% of service type revenue in 2026, reflecting the recurring need for local files, benchmarking studies, transaction descriptions, and statutory submissions among multinational enterprises. The segment provides the basic records required under Action 13 and gives providers a stable foundation of repeat work across jurisdictions. Policy, planning, and operating-model advisory helps companies align policies with operating changes, while tax certainty services support groups seeking clarity before undertaking complex cross-border arrangements. India’s Central Board of Direct Taxes concluded 219 APA agreements in fiscal year 2025-26, including 84 bilateral agreements, showing continued use of certainty mechanisms. Operational transfer pricing is also gaining importance as companies seek controls that link policy choices to transactions processed throughout the year.
Controversy, MAP, and dispute resolution are projected to grow at an 8.1% CAGR through 2032, supported by higher case volumes and limited capacity among competent authorities. The OECD recorded a record number of transfer pricing MAP cases in 2024, increasing the need for pre-dispute analysis, evidence preparation, and coordinated case management. The June 2026 Chapter VII consultation may produce additional documentation work for service transactions because it gives greater attention to transaction delineation and supporting examples. Effective support in this segment combines transfer pricing documentation, economic analysis, and a clear explanation of the commercial benefit received by group entities. The transfer pricing services market is likely to retain the segment’s growth lead as tax authorities continue to test intra-group charges and related evidence.
By Delivery Model:
Mandates Lead but Co-Sourcing DisruptsProject/mandate arrangements accounted for 46.8% of revenue in 2026 because APA negotiations, valuation disputes, and business restructurings are fact-specific and often require senior specialist involvement. These assignments cannot always be standardized, which supports a premium advisory role for experienced providers. Recurring retainer arrangements serve clients with predictable annual documentation, review, and benchmarking needs, particularly groups that need regular access to specialists without a large internal team. The transfer pricing services market continues to use both models, although tools can now automate parts of information collection and routine comparison work. Clients increasingly expect advisers to spend more time on exceptions, review, and professional judgment rather than repetitive production tasks.
Co-sourced/managed transfer pricing operations are projected to grow at 9.2% CAGR through 2032, the highest growth rate in the segmentation estimates. Tighter calendars in Germany, the United Kingdom, and Asia-Pacific jurisdictions are encouraging companies to maintain transfer pricing controls throughout the year rather than prepare files only near filing deadlines. Deloitte reported that organizations with mature AI tools reduced external documentation adviser spending by 51% and internal staff hours by 38% in 2025. The transfer pricing services market is responding through hybrid models that combine client teams, technology platforms, and specialist review for a more continuous governance process. These arrangements preserve expert support for complex cases while creating a more consistent record of pricing decisions and supporting evidence.
By Enterprise Size:
Large Enterprises Anchor Spend, SMEs AccelerateLarge enterprises accounted for 74.3% of revenue in 2026 because their international footprints create a broad range of related-party transactions, legal entities, reporting duties, and tax authority interactions. They require global coverage for APAs, MAP cases, documentation, and operational controls, which support coordinated multi-country delivery. The transfer pricing services market is anchored by this demand, especially where clients need systems that reconcile policies with financial information and local records. Established provider relationships are durable because global programs require in-country staffing and accumulated knowledge of the client’s operating model. These features explain why large enterprises remain central to provider revenue and to the business case for wide professional networks.
SMEs are projected to grow at 7.0% CAGR through 2032 as regulatory attention extends to smaller cross-border groups, especially those with material loans and management fees. Canada’s 2025 budget increased scrutiny of SMEs involved in related-party loans and management fees. The proposed United Kingdom ICTS could also affect mid-sized groups with qualifying cross-border transactions, creating demand for practical reporting processes. These clients are usually more cost-sensitive, which creates an opening for standardized and technology-supported documentation that remains defensible under review. The transfer pricing services market can serve this group through focused scopes, lower delivery costs, and expert support for unusual financing, intangible, or restructuring matters.
By Industry Vertical:
Manufacturing Anchors Share as TMT Rewrites the RulesIndustrial manufacturing held 22.1% of industry vertical revenue in 2026 because capital investment, long product cycles, and multi-country supply chains produce a substantial number of related-party transactions. Customs and transfer pricing interactions increase the need for margin analysis, documentation updates, and dispute support across manufacturing businesses. United States tariff actions during 2025 and 2026 placed pressure on limited-risk manufacturer returns and required groups to reconsider whether recorded margins remained consistent with stated functions and risks. Financial services also contribute through treasury, cash pooling, and captive insurance arrangements that require detailed financial analysis and clear documentation. The transfer pricing services market retains manufacturing as an important source of work because physical supply chains remain closely connected to tax and customs scrutiny.
TMT is projected to grow at a 7.8% CAGR through 2032 because the sector combines distributed talent, high-value intangibles, and rapidly changing business models. Intellectual property, user data, and algorithms make standard comparability analysis more difficult and increase the need for detailed functional analysis. As of early 2026, neither the OECD nor the United States Treasury had issued transfer pricing guidance specifically for AI businesses. Existing frameworks must therefore be applied to new commercial arrangements, which increases the complexity of pricing support. Life sciences and consumer and retail also contribute demand through intangible-heavy structures, brand arrangements, and the need to connect value creation with documented returns.
By Transaction Type:
Intra-Group Services Dominate as Financial Transactions Face Intensified ScrutinyIntra-group services represented 30.6% of revenue in 2026 because shared services, management fees, information technology support, and research allocations are common throughout multinational groups. Each charge requires evidence of a recipient benefit, an appropriate allocation key, and a defensible pricing method. OECD’s June 2026 Chapter VII consultation directly addressed benefit tests and method selection for service transactions. Tangible goods work is linked to manufacturing audit cycles and supply chain changes, while intangibles receive scrutiny because licensing and cost contribution structures can have high tax consequences. The transfer pricing services market has a large recurring workload in this category because providers must connect service descriptions, evidence, allocation methods, and pricing analysis.
Financial transactions are projected to grow at 8.4% CAGR through 2032 as tax authorities apply a more detailed review to intercompany financing. OECD’s November 2025 update to the Model Tax Convention Article 9 commentary emphasized accurate delineation before the pricing of financial transactions. A Belgian court decision in June 2025 also required independently supported credit rating analysis for intra-group loans. Pillar Two adds an effective tax rate consideration to financing structures, making the analysis more connected to wider tax reporting decisions. The transfer pricing services market needs specialists who can document borrowers, loan terms, guarantees, market conditions, and the alignment of financing arrangements with actual facts.
By Provider Type:
Networks Dominate but Boutiques Grow FastestAccounting and tax networks held 66.4% of provider type revenue in 2026 because multinational clients require coordinated support across many jurisdictions. These networks support BEPS 2.0 compliance, transaction work, local tax authority engagement, documentation, and dispute management through broad staffing coverage. The transfer pricing services market favors wide networks when a client needs a consistent methodology across multiple countries and business units. Law firms remain relevant where disputes move into formal litigation, while economic consultancies contribute to valuation, benchmarking, and expert testimony mandates. Global relationships and local knowledge create switching costs that support the position of established accounting and tax networks in complex engagements.
Specialist TP boutiques are projected to grow at 8.2% CAGR through 2032 because some clients value focused technical expertise and lower-cost delivery. Valentiam and TPA Global provide transfer pricing documentation and international coverage through their respective operating models. Their use of technology-supported benchmarking and partner-led service can appeal to mid-market clients with defined needs. The transfer pricing services market gives boutiques room to compete where continuity and technical depth matter more than a full global network. Senior professionals moving from large firms can strengthen boutique capabilities, particularly in managed service models that combine specialists with technology platforms.
Geography Analysis
North America Transfer Pricing Services Market
North America held 40.6% of revenue in 2026, the largest regional position in the transfer pricing services market. The United States has a large base of multinational headquarters and a significant level of tax enforcement activity. The Eighth Circuit’s final 3M ruling in February 2026 changed elements of audit defense strategy under post-Loper Bright judicial review. Canada’s 2025 budget aligned SME documentation more closely with OECD standards and increased the addressable client base among cross-border operators. Mexico contributes through its maquiladora manufacturing base and advance pricing program. These conditions make North America important for compliance, controversy, and operating-model work.
Europe Transfer Pricing Services Market
Europe remains shaped by national OECD-aligned rules rather than a binding regional framework. The European Commission withdrew its proposed transfer pricing directive in October 2025, leaving national differences in place. Germany’s rules, effective from January 2025, require transfer pricing records within 30 days of an audit request. The European Court of Justice’s September 2025 Arcomet ruling increased attention to VAT treatment of year-end transfer pricing adjustments linked to identifiable services. The United Kingdom’s proposed ICTS would add disclosure requirements for cross-border related-party transactions. These developments support demand for coordinated direct-tax and indirect-tax analysis across the region.
APAC and MEA Transfer Pricing Services Market
Asia-Pacific is forecast to grow at 7.7% CAGR through 2032. India’s Income Tax Act 2025 took effect on April 1, 2026, introducing a 3-year block assessment framework, automated APA approvals, revised safe harbor margins, and broader transaction reporting requirements. India concluded 219 APA agreements in fiscal year 2025-26, including 84 bilateral agreements, and exceeded 1,034 cumulative agreements. Singapore’s eighth transfer pricing guidelines, issued in February 2026, included a simplified approach for certain distribution transactions. China’s tariff-disrupted environment has increased the need to reassess manufacturer margins and documentation. The Middle East and Africa are an emerging area, supported by the United Arab Emirates’ APA guidance and broader regional expansion of transfer pricing obligations.
Competitive Landscape
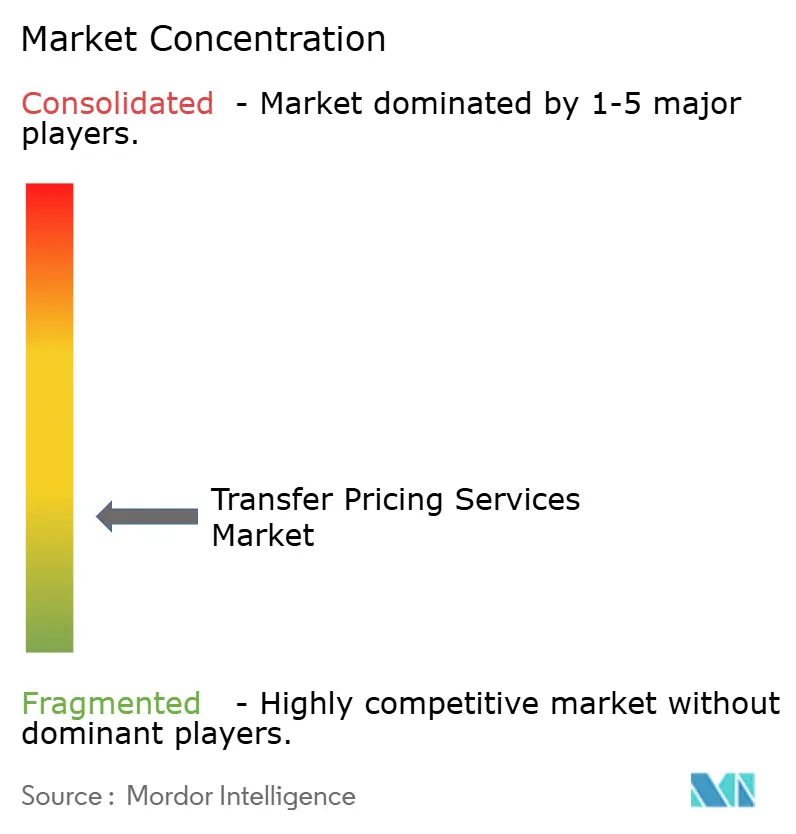
The transfer pricing services market is fragmented. The largest networks retain an advantage where clients need global coverage and established local relationships. Their scale also supports work across documentation, disputes, international tax reforms, and operational controls. Mid-tier consolidation is increasing competitive pressure below the largest networks. Grant Thornton’s July 2026 agreement to acquire CBIZ for USD 5 billion would create a larger professional services platform with more than USD 7.5 billion in combined revenue. This supports the ability of mid-tier firms to compete for broader mandates. The market structure still allows specialists to compete where technical depth or cost discipline is more important than a full network.
PwC United States and PwC India announced a joint venture in September 2026 that combines PwC India’s Consulting business with PwC United States Advisory capabilities in India. The move strengthens a shared delivery model for clients in India, the United States, and other markets. Deloitte, EY, KPMG, and PwC also participated in the discussion around the OECD’s June 2026 Chapter VII consultation. This reflects the continued role of large firms in technical transfer pricing policy work. Alphatax acquired TP Accurate and Intra Pricing Solutions in August 2026, adding intra-group financing and AI-assisted documentation capabilities. The transaction illustrates competition through technology-enabled compliance tools. Providers that combine specialist advice with reliable workflows are better placed to serve recurring client needs.
Technology is becoming more important in routine documentation, benchmarking, and process management. Fonoa’s May 2026 acquisition of PwC’s Indirect Tax Edge platform and its USD 110 million Series C funding show continued investment in technology-led tax delivery. These tools can reduce repetitive tasks and allow teams to focus on review and difficult cases. White-space opportunities remain in integrated transfer pricing and Pillar Two compliance management. Digital-business and AI-intensive multinational enterprises also need support because comparable company availability remains limited. Andersen Group’s July 2026 acquisitions in Nigeria expanded its African platform and advisory capacity. The transfer pricing services market, therefore, remains competitive across networks, specialist firms, and technology providers.
Transfer Pricing Services Industry Leaders
-
Deloitte
-
PwC
-
EY
-
KPMG
-
Grant Thornton International Ltd
- *Disclaimer: Major Players sorted in no particular order
Transfer Pricing Services Market Companies Covered in this Report
- Deloitte
- PwC
- EY
- KPMG
- BDO
- Grant Thornton
- RSM International
- Crowe Global
- Baker Tilly International
- Forvis Mazars
- Kroll
- Alvarez & Marsal
- FTI Consulting
- TPA Global
- Valentiam
- Andersen
- Baker McKenzie
- Nexia International
- TMF Group
- WTS Global
Recent Industry Developments in Transfer Pricing Services Market
- September 2026: PwC United States and PwC India announced a joint venture combining PwC India’s Consulting business and PwC United States Advisory’s India-based capabilities into a single advisory platform spanning India, the United States, and global clients, with closing expected in the first half of 2027.
- August 2026: Alphatax acquired TP Accurate and Intra Pricing Solutions, including TPGenie AI-assisted documentation, to expand its transfer pricing compliance capabilities.
- July 2026: Grant Thornton Advisors agreed to acquire CBIZ for USD 5 billion in cash, creating a larger United States professional services firm with a presence in more than 20 countries and combined revenue above USD 7.5 billion.
- July 2026: Andersen Group Inc. acquired Andersen Tax LP in Nigeria and Verraki Partners, adding them to its 180-country, 50,000-professional platform.
Global Transfer Pricing Services Market Report Scope
Segmentation Overview
| Policy, Planning and Operating-Model Advisory |
| Documentation, Benchmarking and Statutory Compliance |
| Tax Certainty |
| Controversy, MAP and Dispute Resolution |
| Operational Transfer Pricing |
| Project / Mandate |
| Recurring Retainer |
| Co-Sourced / Managed TP Operations |
| Large Enterprises |
| Small and Medium Enterprises |
| Financial Services |
| Technology, Media and Telecommunications |
| Life Sciences |
| Energy, Resources and Utilities |
| Industrial Manufacturing |
| Consumer and Retail |
| Other Industries |
| Tangible Goods |
| Intra-Group Services |
| Intangibles |
| Financial Transactions |
| Restructuring and PE Attribution |
| Accounting and Tax Networks |
| Law Firms |
| Economic Consultancies |
| Specialist TP Boutiques |
| North America | United States |
| Canada | |
| Mexico | |
| South America | Brazil |
| Argentina | |
| Rest of South America | |
| Europe | United Kingdom |
| Germany | |
| France | |
| Italy | |
| Spain | |
| Rest of Europe | |
| Asia-Pacific | China |
| Japan | |
| India | |
| South Korea | |
| Australia | |
| Indonesia | |
| Thailand | |
| Malaysia | |
| Singapore | |
| Vietnam | |
| Rest of Asia-Pacific | |
| Middle East and Africa | Saudi Arabia |
| United Arab Emirates | |
| Turkey | |
| South Africa | |
| Egypt | |
| Rest of Middle East and Africa |
| By Service Type | Policy, Planning and Operating-Model Advisory | |
| Documentation, Benchmarking and Statutory Compliance | ||
| Tax Certainty | ||
| Controversy, MAP and Dispute Resolution | ||
| Operational Transfer Pricing | ||
| By Delivery Model | Project / Mandate | |
| Recurring Retainer | ||
| Co-Sourced / Managed TP Operations | ||
| By Enterprise Size | Large Enterprises | |
| Small and Medium Enterprises | ||
| By Industry Vertical | Financial Services | |
| Technology, Media and Telecommunications | ||
| Life Sciences | ||
| Energy, Resources and Utilities | ||
| Industrial Manufacturing | ||
| Consumer and Retail | ||
| Other Industries | ||
| By Transaction Type | Tangible Goods | |
| Intra-Group Services | ||
| Intangibles | ||
| Financial Transactions | ||
| Restructuring and PE Attribution | ||
| By Provider Type | Accounting and Tax Networks | |
| Law Firms | ||
| Economic Consultancies | ||
| Specialist TP Boutiques | ||
| By Geography | North America | United States |
| Canada | ||
| Mexico | ||
| South America | Brazil | |
| Argentina | ||
| Rest of South America | ||
| Europe | United Kingdom | |
| Germany | ||
| France | ||
| Italy | ||
| Spain | ||
| Rest of Europe | ||
| Asia-Pacific | China | |
| Japan | ||
| India | ||
| South Korea | ||
| Australia | ||
| Indonesia | ||
| Thailand | ||
| Malaysia | ||
| Singapore | ||
| Vietnam | ||
| Rest of Asia-Pacific | ||
| Middle East and Africa | Saudi Arabia | |
| United Arab Emirates | ||
| Turkey | ||
| South Africa | ||
| Egypt | ||
| Rest of Middle East and Africa | ||
Key Questions Answered in the Report
What is driving demand for transfer pricing services?
Cross-border trade, public reporting requirements, stricter documentation rules, and higher tax authority scrutiny are increasing demand for ongoing support.
How large is the transfer pricing services sector?
It is estimated at USD 9.6 billion in 2027 and is forecast to reach USD 13 billion by 2032, at a 6.2% CAGR.
Which service area is growing fastest?
Controversy, MAP and Dispute Resolution is projected to grow at 8.1% CAGR through 2032.
Which delivery model is expanding most quickly?
Co-Sourced and Managed TP Operations is projected to grow at 9.2% CAGR through 2032.
Which region has the highest growth forecast?
Asia-Pacific is projected to grow at 7.7% CAGR through 2032, supported by regulatory change in India and Singapore.
Why are financial transactions receiving more attention?
New treaty commentary, court decisions, and Pillar Two considerations are increasing the need for documentation and analysis of intercompany financing.