
Transcutaneous Monitors Market Size and Share
Market Overview
| Study Period | 2020 - 2031 |
|---|---|
| Market Size (2026) | USD 295.84 Million |
| Market Size (2031) | USD 400.97 Million |
| Growth Rate (2026 - 2031) | 6.27 % |
| Fastest Growing Market | Asia Pacific |
| Largest Market | North America |
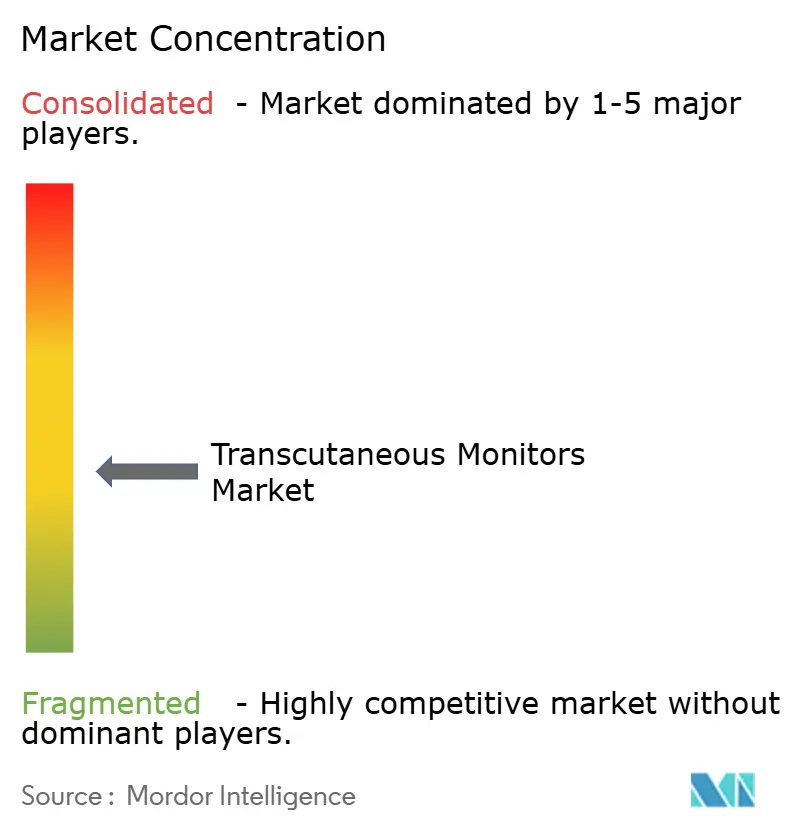
| Market Concentration | Medium |
Major Players *Disclaimer: Major Players sorted in no particular order Image © Mordor Intelligence. Reuse requires attribution under CC BY 4.0. | |
Transcutaneous Monitors Market Analysis by Mordor Intelligence
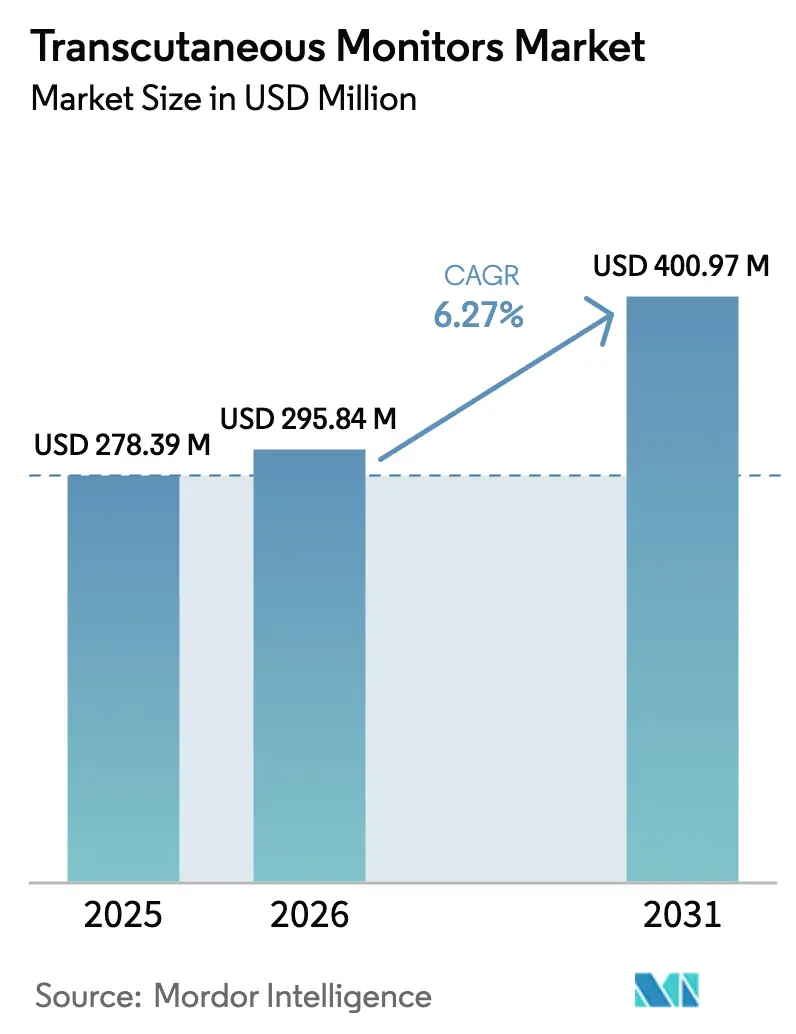
The transcutaneous monitors market size was valued at USD 278.39 million in 2025 and estimated to grow from USD 295.84 million in 2026 to reach USD 400.97 million by 2031, at a CAGR of 6.27% during the forecast period (2026-2031). The expansion is driven by rapid device miniaturization, clinical confidence in non-invasive blood-gas substitutes, and the growing expectation that monitoring hardware will link seamlessly with analytics platforms. Hospitals remain the principal buyers, yet demand is spreading to specialty clinics and home-care programs as reimbursement widens and as clinicians seek workflow-friendly equipment. Advancements in luminescence sensors, photoacoustic spectroscopy, and AI algorithms are shortening product cycles while improving accuracy, which in turn encourages replacement purchases [1]U.S. Food and Drug Administration, “Medical Device Databases,” fda.gov . Meanwhile, combined-parameter platforms are taking share from single-parameter devices because multidisciplinary teams prefer consolidated views of oxygen, carbon dioxide, and other biomarkers.
Key Report Takeaways
- By application, Blood Gas Monitoring led with 41.02% of the transcutaneous monitors market share in 2025, while Wound Healing is poised to grow at a 6.95% CAGR through 2031.
- By end user, Hospitals commanded 67.12% share of the transcutaneous monitors market size in 2025; Specialty Clinics are projected to expand at a 7.03% CAGR to 2031.
- By parameter monitored, transcutaneous CO₂ sensors accounted for 44.05% of the transcutaneous monitors market size in 2025, whereas Combined Parameters systems are set to progress at a 6.86% CAGR over the same period.
- By patient age group, Adults comprised 45.44% of total 2025 revenue, yet the Neonatal segment shows the fastest advance at 7.02% CAGR through 2031.
- By geography, North America comprised 39.78% of total 2025 revenue, yet the Asia-Pacific segment shows the fastest advance at 7.05% CAGR through 2031.
Note: Market size and forecast figures in this report are generated using Mordor Intelligence’s proprietary estimation framework, updated with the latest available data and insights as of 2026.
Market Trends and Insights
Drivers Impact Analysis of Transcutaneous Monitors Market*
| Driver | (~) % Impact on CAGR Forecast | Geographic Relevance | Impact Timeline |
|---|---|---|---|
| Growing prevalence of respiratory diseases | +1.8% | Global, concentrated in North America & Europe | Medium term (2-4 years) |
| Technological miniaturization & sensor accuracy gains | +1.5% | Global, led by Asia-Pacific innovation hubs | Long term (≥ 4 years) |
| Rise in chronic disorders necessitating continuous monitoring | +1.2% | Global, especially developed markets | Long term (≥ 4 years) |
| Demand spike for non-invasive neonatal & critical-care monitoring | +1.0% | North America & EU, expanding to APAC | Medium term (2-4 years) |
| AI-enabled wearable capnometry for home & sleep diagnostics | +0.7% | North America & EU early adoption | Long term (≥ 4 years) |
| Hyperbaric-medicine expansion driving TcPO₂ adoption | +0.5% | North America & Europe; selective APAC | Medium term (2-4 years) |
| Source: Mordor Intelligence | |||
Growing Prevalence of Respiratory Diseases
Chronic obstructive pulmonary disease, sleep apnea, and post-viral respiratory complications are driving sustained demand for continuous non-invasive monitoring [2]Radiometer America, “Clinical Performance of Transcutaneous Monitoring in Neonates,” radiometeramerica.com . Hospitals that introduced transcutaneous CO₂ sensors in neonatal intensive care units reduced arterial blood draws by 25%, lowering infection risk and nursing time. Home-based sleep-diagnostic programs using smartwatch-linked oximetry algorithms achieved 89.4% sensitivity, illustrating the shift from clinic-centric testing to consumer-friendly screening [3]Radiometer America, “Clinical Performance of Transcutaneous Monitoring in Neonates,” radiometeramerica.com . U.S. coverage determinations now deem transcutaneous systems medically necessary for restrictive thoracic disorders, broadening reimbursement and reinforcing their role in value-based care. Together, disease burden and policy alignment underpin a robust outlook for the transcutaneous monitors market.
Technological Miniaturization & Sensor Accuracy Gains
Luminescence, photoacoustic, and electronic-paramagnetic-resonance sensing have trimmed probe footprints while dispensing with heating membranes, clearing a path for round-the-clock wearables that rival arterial sampling accuracy. Non-contact epidermal flux monitors showcased by Nature reported clinically acceptable variance without direct skin coupling, extending use cases to fragile or burn patients. Masimo embedded ML-driven “Sleep Halo” analytics in consumer devices that log 70,000 daily health points, illustrating how software stickiness can lengthen hardware life cycles. The U.S. Food & Drug Administration recently cleared laser-based oximeters that correct melanin-related signal drop, signaling regulatory support for equity-minded accuracy upgrades. Such breakthroughs are expected to influence platform specifications for at least the next product generation.
Rise in Chronic Disorders Necessitating Continuous Monitoring
Health-systems are migrating from episodic to longitudinal care models, and payers are rewarding devices that enable early intervention. Insertable cardiac monitors saved USD 4,532 per patient relative to legacy testing while generating 0.30 additional QALYs, demonstrating economic justification for continuous monitoring. Abbott’s alliance with Medtronic on closed-loop glucose control highlights how transcutaneous sensing is embedding itself in therapeutic automation pathways. Roche obtained CE Mark for a hypoglycemia-predictive glucose sensor that layers AI atop electrochemical measurements, underscoring incumbent readiness to diversify into broader continuous-monitor portfolios. The FDA then cleared the first 12-month glucose sensor, validating long-wear transcutaneous form factors that reduce patient workload.
Demand Spike for Non-Invasive Neonatal & Critical-Care Monitoring
Wire-free, multi-signal wearables are now prioritized in neonatal ICUs, where adhesive electrodes previously caused skin tears and infection. Flexible epidermal electronics fabricated on ultrathin silicone conformed to infant anatomy and transmitted synchronized pulse oximetry, ECG, and temperature data with negligible motion artifact. Contactless photoplethysmography produced mean heart-rate deviation of –0.2 bpm versus reference methods, supporting adoption for infants in isolette environments. Masimo’s joint project with March of Dimes to supply FDA-cleared home baby monitors demonstrates commercialization beyond hospital walls. Collectively, these efforts re-position neonatal monitoring from episodic spot-checks toward unobtrusive continuous oversight.
Restraints Impact Analysis of Transcutaneous Monitors Market*
| Restraint | (~) % Impact on CAGR Forecast | Geographic Relevance | Impact Timeline |
|---|---|---|---|
| Complex & lengthy regulatory approvals | -1.2% | Global; most stringent in EU under MDR | Medium term (2-4 years) |
| High device & sensor replacement cost | -0.8% | Emerging markets, cost-sensitive systems | Short term (≤ 2 years) |
| Limited clinician training in TC monitoring workflows | -0.6% | Worldwide; pronounced in developing regions | Medium term (2-4 years) |
| Skin-tone accuracy bias triggering extra validation | -0.4% | Global; regulatory focus in North America | Short term (≤ 2 years) |
| Source: Mordor Intelligence | |||
Complex & Lengthy Regulatory Approvals
Europe’s Medical Device Regulation widened classification scope to include stand-alone software, compelling manufacturers to run full clinical evaluations and post-market surveillance for transcutaneous systems. In the United States, Class II filings must show substantial equivalence with predicate devices and prove accuracy across diverse patient groups, often extending bench-to-bedside timelines. Although recent guidance permits limited data waivers, companies still prepare extensive technical dossiers for MDR and 510(k) submissions, straining smaller entrants and slowing iteration cycles. Divergent U.S.–EU evidence expectations oblige global firms to conduct parallel regulatory strategies, adding up-front compliance costs that can dampen innovation velocity.
High Device & Sensor Replacement Cost
Up-front system prices and frequent sensor swaps weigh on adoption in budget-capped facilities. Health-economic studies show transcutaneous monitoring lowers complications long term, yet capital budgets and per-procedure tariffs rarely capture those downstream savings. U.S. Medicare requires detailed documentation for coverage, imposing administrative overhead that can deter smaller clinics. Emerging healthcare systems face out-of-pocket models that amplify cost sensitivity. To sidestep procurement obstacles, suppliers are piloting bundled-payment agreements that link device fees to outcome metrics, easing cash-flow constraints while aligning incentives.
*Our forecasts treat driver/restraint impacts as directional, not additive. The impact forecasts reflect baseline growth, mix effects, and variable interactions.
Transcutaneous Monitors Market Segment Analysis
By Application:
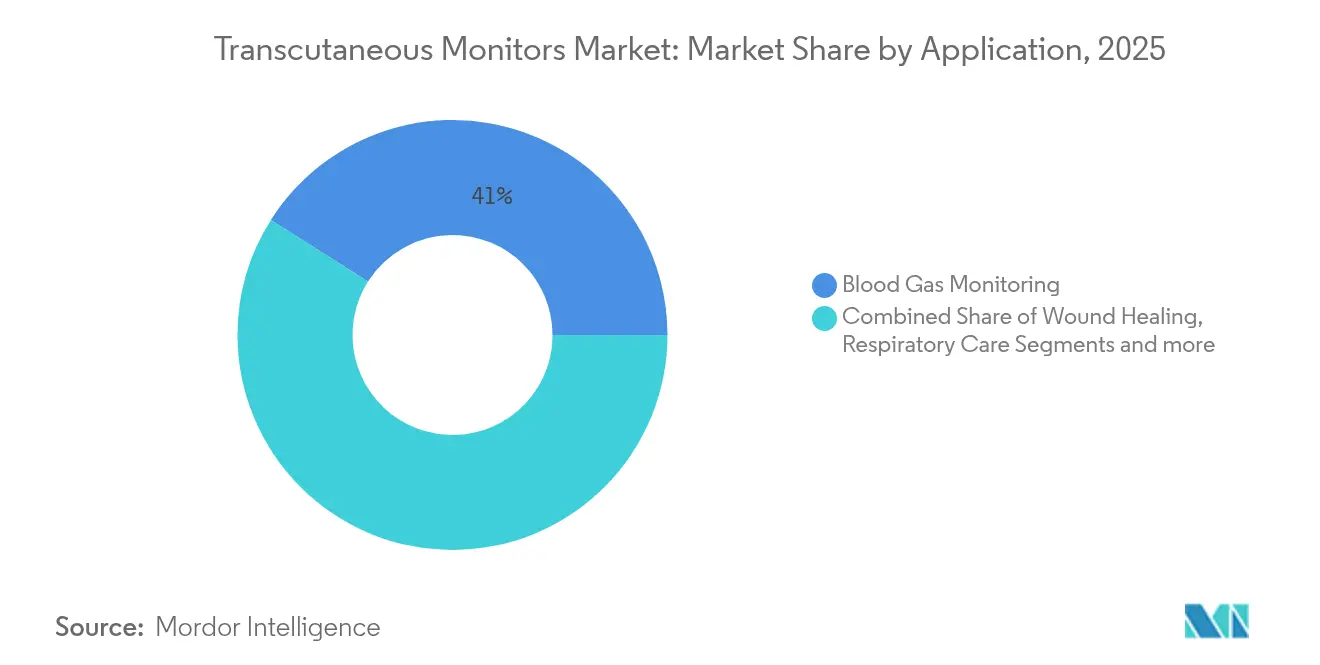
Blood Gas Dominates, Wound Healing AcceleratesBlood Gas Monitoring accounted for 41.02% of the transcutaneous monitors market size in 2025, reflecting decades of evidence that end-tidal and skin-based measurements reduce invasive sampling frequency in intensive-care suites. Integration with ventilator dashboards further cements its role in respiratory management. Wound Healing, though smaller, is advancing at a 6.95% CAGR. Hyperbaric clinics rely on transcutaneous oxygen (TcPO₂) to triage limb-salvage candidates; values below 30 mmHg flag compromised microcirculation, prompting adjunctive therapy. As funding for diabetic-foot programs rises, TcPO₂ is becoming a routine prognostic marker, placing this niche on a rapid ascent.
The convergence of expanded hyperbaric coverage and portable TcPO₂ devices creates favorable conditions for outpatient wound centers. Societies now list TcPO₂ as a pre-operative measure for peripheral arterial disease, embedding the test in vascular algorithms. Meanwhile, AI-enhanced capnography is spilling into sleep-diagnostic toolkits, foreshadowing new overlaps between pulmonary and wound-care domains. Consequently, the transcutaneous monitors market is widening its clinical footprint without cannibalizing incumbent segments.



By End User:
Hospitals Hold Share, Specialty Clinics Gain MomentumHospitals retained 67.12% of revenue in 2025 as critical-care units depend on round-the-clock physiology data. Yet Specialty Clinics are registering 7.03% CAGR because portable monitors now suit outpatient infusion centers and dialysis suites. Ambulatory Surgical Centers deploy single-use sensors to flag hypoventilation episodes during conscious sedation, mitigating post-op complications.
Philips’ decision to move its Healthdot business into smartQare highlights an ecosystem pivot: open platforms that aggregate feeds from multiple vendors are edging out proprietary silos. The model improves staffing efficiency; one Dutch pilot demonstrated 47% less routine vitals collection when continuous wireless sensors fed directly into electronic medical records. Budget-minded clinics view such labor offsets as justification for capital outlay, fuelling demand beyond hospital campuses.
By Parameter Monitored:
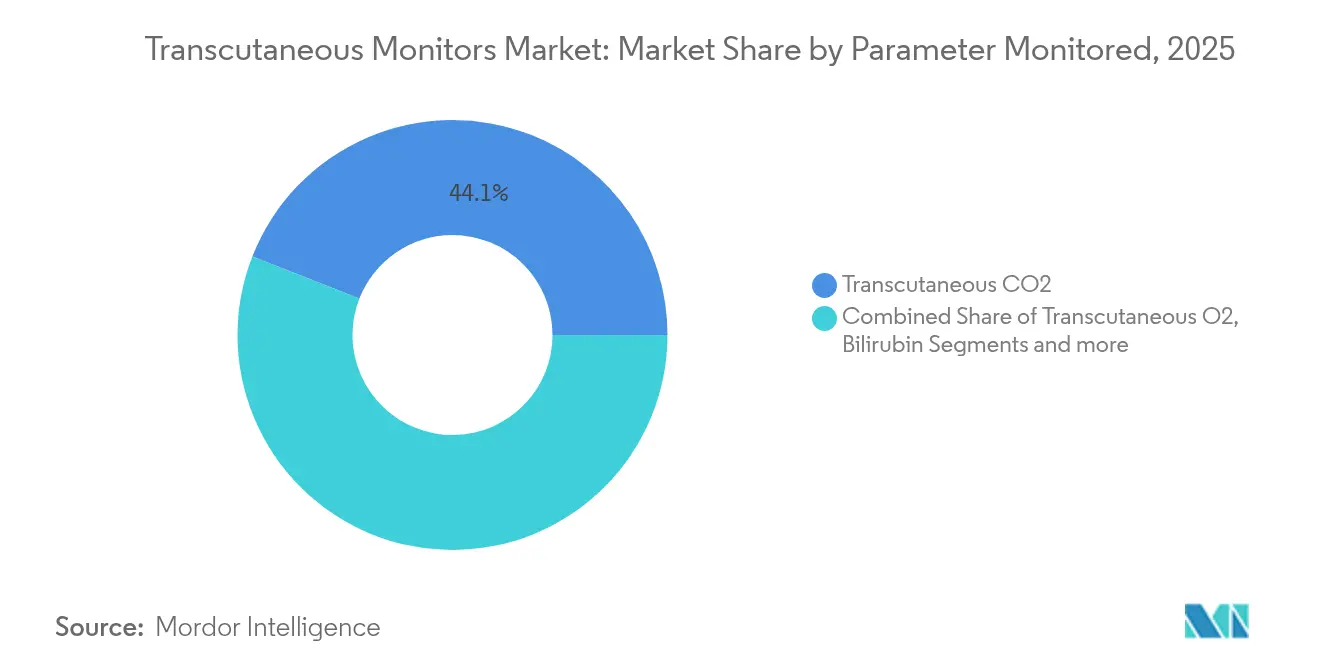
CO₂ Leads, Combined Parameters OutperformCO₂ probes captured 44.05% of 2025 sales, reinforcing their superiority in ventilation titration. However, Combined Parameters systems are expanding at 6.86% CAGR as integrated boards collect CO₂, O₂, pulse oximetry, and surface temperature simultaneously. Multisensor packages cut bedside clutter and lower total device count, an important factor as ICU beds host more infusion pumps and infusion lines.
Recent research replaced heated polarographic cells with multiparameter luminescence arrays that last 20,000 hours before recalibration. Cardiac-monitor specialist iRhythm licensed BioIntelliSense silicon to enrich its arrhythmia patches with continuous oximetry and skin-temperature data, signaling cross-pollination between cardiology and respiratory care markets. These alliances forecast an era where the transcutaneous monitors market migrates toward platform economics rather than single-function components.
By Patient Age Group:
Adult Volume, Neonatal VelocityAdults generated 45.44% of 2025 turnover owing to chronic-disease prevalence and ICU throughput. Neonatal systems, though less than one-quarter of shipments, show a 7.02% annual rise as clinicians prioritize atraumatic designs. Soft epidermal patches trimmed motion artifact by 40% compared to adhesive electrodes, improving alarm accuracy and nursing workflow. Contactless imaging photoplethysmography, already validated against reference monitors, enters trial use in high-acuity nurseries and post-discharge home programs.
Sensor fusion algorithms tailor alarm thresholds to neonatal physiology, minimizing false positives that otherwise desensitize staff. The resulting performance gains accelerate purchasing cycles as hospitals refurbish legacy fleets to meet updated safety standards. For suppliers, the neonatal growth spurt offers a proving ground for technologies later repackaged for broader pediatric and geriatric audiences.
Geography Analysis
North America Transcutaneous Monitors Market
North America continues to anchor the transcutaneous monitors market through robust reimbursement, integrated care networks, and a track record of technology uptake. Medicare covers multiple use cases, from ambulatory ECGs to continuous capnography, encouraging hospital procurement even during budget squeezes. BD’s USD 4.2 billion purchase of Edwards Lifesciences’ critical-care unit exemplifies scale-seeking consolidation aimed at building end-to-end monitoring ecosystems. Masimo’s healthcare segment grew 10% in 2024 to USD 1,395 million, reflecting high replacement demand for advanced pulse oximeters and capnometers.
APAC Transcutaneous Monitors Market
Asia-Pacific is the fastest-growing region at 7.05% CAGR, propelled by aging demographics, infrastructure upgrades, and harmonizing device rules. National reimbursement codes in Japan now bundle continuous oxygen monitoring into postoperative packages, while India’s Ayushman Bharat scheme broadens public funding for critical-care instrumentation. Because many facilities leapfrog older wired technology, suppliers that offer mobile, cloud-linked monitors gain early-mover advantages. The region’s dense innovation hubs also accelerate sensor R&D; several photoacoustic startups in South Korea and Singapore secured Series B funding for wearable capnographs in 2025.
Europe Transcutaneous Monitors Market
Europe remains a sizeable but increasingly regulated arena. MDR enforcement lengthens submission lead-times, yet it also stabilizes quality expectations, which benefits manufacturers with strong clinical datasets. Roche’s AI-assisted glucose sensor received CE Mark clearance in 2025 under the new rules, proving that evidence-rich dossiers can still move efficiently. Regional procurement patterns favor devices with proven workflow integrations; thus, platforms capable of merging with hospital EMRs see smoother tender wins. While currency volatility and varied national insurance models complicate pricing, the demand for neonatal and wound-healing monitors is rising as speciality clinics across Germany and France adopt hyperbaric programs.


Regulatory Landscape
Transcutaneous carbon dioxide (PcCO2) and oxygen (PcO2) monitors are Class II devices in the United States under 21 CFR 868.2480 (cutaneous carbon-dioxide monitor) and 21 CFR 868.2500 (cutaneous oxygen monitor). They typically enter through the 510(k) pathway with special controls for cutaneous gas measurement and labeling. The FDA Class II Special Controls Guidance for cutaneous gas monitors, together with alignment to the IEC 60601 family (including IEC 60601-2-23 for transcutaneous partial pressure monitoring equipment), sets expectations around electrical safety, probe performance, and clinical use conditions.
In Europe, conformity assessment under the Medical Device Regulation (EU) 2017/745 continues to influence both launch timing and the depth of documentation for transcutaneous monitoring systems, including software elements used for monitoring and decision support. In 2025, the European Commission published proposal COM(2025)1023 to address MDR and IVDR implementation bottlenecks and device availability, reinforcing the direction toward process improvements while keeping evidence and post-market requirements in place. In practice, country-level reimbursement and procurement criteria remain key gating factors, especially for neonatal and critical-care workflows where validation across diverse patient groups is emphasized.
Competitive Landscape
The transcutaneous monitors market is moderately fragmented. Incumbent device makers defend share by embedding analytics software and by forming alliances that extend their hardware into remote settings. Masimo, whose SET pulse oximetry features in all of the top 10 U.S. hospitals ranked by Newsweek in 2024, leverages proven outcome data to secure formulary preference. Philips, GE HealthCare, and Dräger compete through interoperability, pitching vendor-neutral hubs that aggregate telemetry to frontline tablets.
Acquisitions underscore a shift toward portfolio breadth. BD added Edwards’ hemodynamic lines to pair catheter-based pressure readings with skin-level gas metrics, rolling these under a unified smart-connected-care unit. Teleflex’s July 2025 purchase of BIOTRONIK’s vascular intervention business widens its procedural footprint and may create downstream demand for real-time oxygenation feedback during limb revascularization. On the partnership front, open-source data standards are emerging; firms that publish well-documented APIs attract third-party algorithm developers, making their hardware sticky in hospital IT ecosystems.
Smaller innovators, often spun out of university labs, focus on sensor miniaturization and skin-tone-agnostic optics. Many adopt licensing models, feeding OEM pipelines rather than building full marketing channels. While their agile R&D can threaten commoditization, the capital and regulatory muscle of large strategics still dominates high-volume tenders. Overall, the market rewards firms that merge best-in-class hardware with SaaS-style analytics and that demonstrate cost offsets in high-acuity settings.
Transcutaneous Monitors Industry Leaders
Sentec AG
Radiometer
Primed AB
Koninklijke Philips N.V.
HUMARES GMBH
- *Disclaimer: Major Players sorted in no particular order
Transcutaneous Monitors Market Companies Covered in this Report
- SenTec
- Radiometer
- HUMARES GmbH
- Perimed
- Koninklijke Philips
- Masimo
- Dragerwerk
- Siemens Healthineers
- GE Healthcare
- Medtronic
- Kent Imaging
- Perimed AB (PeriFlux)
- Baxter International (O? Boot)
- Natus Medical
- Atom Medical Corp.
- Nihon Kohden Corp.
- Smith & Nephew (O? therapy patches)
- Abbott Laboratories (Libre Sense)
- AliveCor
- iRhythm Technologies
- Convatec
- Solventum
- Johnson & Johnson
- Boston Scientific (TENS)

Market Opportunities and Future Outlook
A key whitespace for transcutaneous monitors is lowering dependence on heated sensors and frequent site rotation while maintaining trend accuracy in neonates and fragile-skin patients, where clinical protocols already use continuous transcutaneous CO2 monitoring to reduce arterial blood gas sampling burden. Vendors that pair TcCO2 and TcPO2 with consolidated, multi-parameter bedside platforms and enterprise connectivity are positioned to compete in tenders that prioritize interoperability and workflow integration. This is especially relevant as hospitals move toward vendor-neutral data aggregation, reflected in ecosystem moves such as Philips shifting Healthdot into smartQare across the broader monitoring stack.
Ongoing R&D in continuous, non-invasive physiology monitoring also supports a broader technology roadmap for transcutaneous modalities and their analytics layers. In 2026, peer-reviewed work highlighted new form factors and sensing approaches, including a wearable ultrasound patch validated by Stanford Medicine for continuous fetal blood-flow monitoring (Nature Biotechnology) and cuffless blood pressure monitoring concepts reported in Nature Communications and IOPscience. For transcutaneous monitor suppliers, these developments reinforce opportunities in wire-free neonatal monitoring, home and sleep diagnostics extensions, and software-led differentiation that improves usability, reduces maintenance friction, and supports longitudinal monitoring programs.
Recent Industry Developments in Transcutaneous Monitors Market
- June 2026: Koninklijke Philips N.V. launched the IntelliVue Patient Monitor 6000 Series with flexible measurement configurations and expanded connectivity aimed at hospital deployments. The release supports enterprise standardization and makes it easier to combine multiple measurement modalities on a single platform, which aligns with demand for consolidated views of oxygenation and ventilation-related parameters.
- September 2025: Sentec received FDA 510(k) clearance for the LuMon Electrical Impedance Tomography (EIT) system, including indications for premature infants and spontaneously breathing patients in the United States. The clearance broadens Sentec's acute-care monitoring footprint and strengthens its position with neonatal and respiratory-care customers that frequently co-procure complementary monitoring technologies.
- July 2025: Teleflex completed the acquisition of BIOTRONIK's Vascular Intervention business for EUR 760 million (USD 825 million). Expanding its peripheral intervention portfolio can increase procedural demand for real-time oxygenation and perfusion assessment in vascular pathways where transcutaneous oxygen monitoring is used in wound-care and limb-salvage decision-making.


Transcutaneous Monitors Market Report Scope and Research Methodology
Market Definition and Coverage
This market covers transcutaneous monitoring devices and related measurement modules that noninvasively track physiologic parameters through the skin in clinical care, mainly for oxygenation and ventilation monitoring and adjacent use cases where transcutaneous readings guide decisions.
Scope exclusions: We exclude general bedside patient monitors that do not offer a transcutaneous measurement function, along with pure consumables and service-only revenue that is not tied to device deployment.
Segments Covered in This Report
- By Application
- Wound Healing
- Blood Gas Monitoring
- Respiratory Care
- Sleep Diagnostics
- Others
- By End User
- Hospitals
- Ambulatory Surgical Centers
- Specialty Clinics
- Others
- By Parameter Monitored
- Transcutaneous CO2
- Transcutaneous O2
- Bilirubin
- Combined Parameters
- By Patient Age Group
- Neonates
- Pediatric
- Adult
- Geriatric
- By Geography
- North America
- United States
- Canada
- Mexico
- Europe
- Germany
- United Kingdom
- France
- Italy
- Spain
- Rest of Europe
- Asia-Pacific
- China
- Japan
- India
- Australia
- South Korea
- Rest of Asia-Pacific
- Middle East and Africa
- GCC
- South Africa
- Rest of Middle East and Africa
- South America
- Brazil
- Argentina
- Rest of South America
- North America
Data Sources, Market Sizing, and Validation
Desk Research
Desk research was used to map the demand pool, understand clinical adoption patterns, and set realistic checks for volumes and pricing by care setting. Public sources such as the US FDA device listings and safety communications, the Centers for Medicare and Medicaid Services fee schedules and coverage notes, the US CDC health statistics, and the World Health Organization health indicators were reviewed to anchor utilization signals. We also reviewed sources like OECD health data, peer reviewed clinical journals on transcutaneous oxygen and carbon dioxide monitoring, and association websites that describe neonatal and respiratory monitoring practice.
Company annual reports, investor decks, and reputable press releases were then used to identify product footprints, launch timelines, and regional exposure that affects shipment mix. For fill-in items such as ownership links, patent activity, and import-export movement for relevant HS categories, we also used paid subscriptions for company intelligence, patent databases, and shipment-level trade datasets where it helped validate directionally. These desk inputs are illustrative only, and we used many other public and paid sources for data collection, validation, and clarification during the work.
Primary Interviews and Surveys
Primary discussions were run with device manufacturers, distributors, clinical users, and biomedical teams who influence procurement, calibration practices, and replacement cycles. For a global view, we spoke across APAC, EMEA, and the Americas so regional NICU capacity, respiratory care load, and reimbursement comfort could be compared, and then used the feedback to tighten assumptions that desk sources often leave vague.
Distribution of primary research fieldwork respondents
| Company type | Respondent position | Region |
|---|---|---|
| Top tier: 35% | CXOs: 21% | APAC: 42% |
| Mid tier: 44% | Functional/Unit leaders: 38% | EMEA: 33% |
| Smaller Players: 21% | Managers: 41% | Americas: 25% |
Market-Sizing & Forecasting
Sizing starts from a top-down demand reconstruction, where care delivery indicators are translated into likely monitoring needs and then converted into device demand by use case. In practice, we tied the model to signals such as NICU and pediatric ICU bed availability, respiratory and sleep diagnostic procedure volumes, wound care caseload in hospital settings, and replacement and upgrade cycles for installed devices. Because pricing changes over time, average selling price ranges were adjusted by product mix (single parameter versus combined parameter systems) and by regional procurement behavior, and then converted using consistent currency timing.
Once the first cut is built, results were corroborated with selective bottom-up approximations using supplier revenue direction checks, sampled unit volumes by channel, and typical utilization per facility to see if totals were explainable. Where bottom-up inputs were incomplete, we handled gaps using conservative penetration assumptions tied to facility counts and clinical adoption constraints, and then rechecked with primary feedback. For forecasting, scenario analysis was used so shifts in neonatal care investment, respiratory monitoring demand, and pricing pressure could be reflected without overfitting, and the final trajectory was aligned to what experts viewed as the most realistic operating case.
Data Validation & Update Cycle
Outputs were checked against independent signals, including whether implied device density per relevant hospital cohort and regional growth patterns match what clinicians and channel participants described. When a number looked unusual, assumptions were revisited, and follow-up calls were triggered to confirm whether the change came from scope, pricing, or a true demand shift. Before sign-off, the model goes through multi-step analyst review so calculation logic, unit consistency, and regional roll-ups are aligned.
The report is refreshed annually, and interim updates are made when material events occur such as major regulatory changes, product launches, or notable shifts in hospital capital spending. Right before delivery, a final review pass is done so clients receive the most current view that can be traced back to clear inputs and checks.
Mordor Intelligence's Transcutaneous Monitors Market Size Measured Against Other Published Estimates
Published market values for transcutaneous monitors can look far apart, even when the same product theme is being discussed, because the counted product set and timing assumptions are often not aligned. Differences also show up when some publishers pick a different base year, use a different currency conversion date, or lean more heavily on a single end user setting.
The main gap comes from whether multi-parameter transcutaneous platforms and age-group related demand signals are counted only when a true transcutaneous measurement module is present, a rule applied in Mordor Intelligence's scope, while some other estimates appear to blend in broader patient monitoring revenue or adjacent oximetry-only systems. On top of scope, the spread also reflects how ASP progression is treated, since some figures assume flat pricing even when mix is shifting toward combined parameter systems and service bundles.
Benchmark comparison
| Source | Market Size | Gaps in Research Methodology |
|---|---|---|
| Mordor Intelligence | USD 295.84 M (2026) | |
| Industry Publisher A | USD 294.79 M (2026) | Uses a similar year marker but appears to include a wider application basket, including neonatal intensive care as a standalone application line, which can pull in adjacent monitoring spend beyond transcutaneous measurement modules. |
| Global Publisher B | USD 455.90 M (2025) | Starts from a larger base year value and likely blends broader device categories and channel definitions, including home care and multi-channel monitoring spend that may not consistently map to transcutaneous oxygen and carbon dioxide device revenue only. |
Across the three figures, the spread is mainly explained by scope alignment and how pricing and mix are handled, not by a completely different growth story. When the device definition is kept tight and then checked with facility-level demand signals and practical ASP ranges, the resulting market size tends to stay more reproducible from year to year.


Key Questions Answered in the Report
What is the current value of the transcutaneous monitors market?
The market is valued at USD 295.84 million in 2026 and is projected to reach USD 400.97 million by 2031, growing at a 6.27% CAGR.
Which application segment generates the most revenue?
Blood Gas Monitoring leads with 41.02% of 2025 revenue, reflecting its entrenched use in intensive-care ventilation management.
Why are specialty clinics adopting transcutaneous monitors faster than hospitals?
Portable, interoperable devices let clinics monitor patients continuously without intensive capital build-outs, supporting a 7.03% CAGR through 2031.
Which patient group shows the highest growth potential?
Neonates represent the fastest-growing age group at 7.02% CAGR, thanks to soft epidermal sensors that avoid skin trauma and enable continuous vital-sign capture.
How are new regulations affecting product launches in Europe?
The EU Medical Device Regulation demands broader clinical evidence and post-market tracking, lengthening launch timelines but raising quality standards for all entrants.
What technological innovation is most likely to reshape the transcutaneous monitors industry next?
Multi-parameter luminescence sensors that operate without heating elements are expected to drive platform consolidation and extend wear-time, positioning suppliers for new home-care and outpatient applications.
Page last updated on:


 Your data is secure and never sold or shared.


